A solid start to the US earnings season
This week's focus is on the impact of rising oil and energy prices in light of increasing tensions between Iran and the United States over the Strait of Hormuz. Add to this the damage to energy infrastructure in the Gulf region and the outlook for US energy companies such as Chevron could improve by mid-2026. In the meantime, the reporting season for the first quarter of 2026 has gotten off to a good start in the US, with 88% of S&P 500® companies reporting positive earnings surprises so far.
Case of the week: More energy crises on the horizon?
Last week, we discussed how the conflict in Iran and the closure of the Strait of Hormuz have caused the biggest involuntary disruption to oil supplies since 1973. With Saudi Arabian pipelines falling far short of crude oil from the sea, the situation remains critical.
However, oil futures have recently given back their initial gains following the outbreak of the conflict. The announcement of a ceasefire between the US and Iran and Israel has eased some supply concerns. Iran's subsequent declaration that the Strait of Hormuz was open for trade led to a rally in stock prices on Friday, April 18, while oil futures fell 10 percent to settle at around $90 per barrel. US markets posted their third consecutive week of strong gains, with the Nasdaq and S&P 500® rising 6.8 percent and 4.5 percent, respectively.
In contrast, tensions between Iran and the US appeared to rise again over the weekend ahead of the next expected round of peace talks. Both parties claimed that the strait was closed again. Iran accused the United States of violating the fragile ceasefire between the two countries after the US Navy fired on an Iranian-flagged cargo ship in the Arabian Sea and promised retaliation. In response, President Trump threatened to destroy Iran's power plants and bridges if no agreement was reached. The ceasefire expires on Wednesday, April 22.
The situation therefore remains unclear and the risk of further escalation is still high. With very few ships having crossed the waters since the conflict began, there is a real risk of an "air pocket" forming in global oil supplies in the coming quarters, and the full impact of the first month of war is probably yet to be seen. The longer the conflict lasts, the greater the impact on the energy markets and the global economy will be.
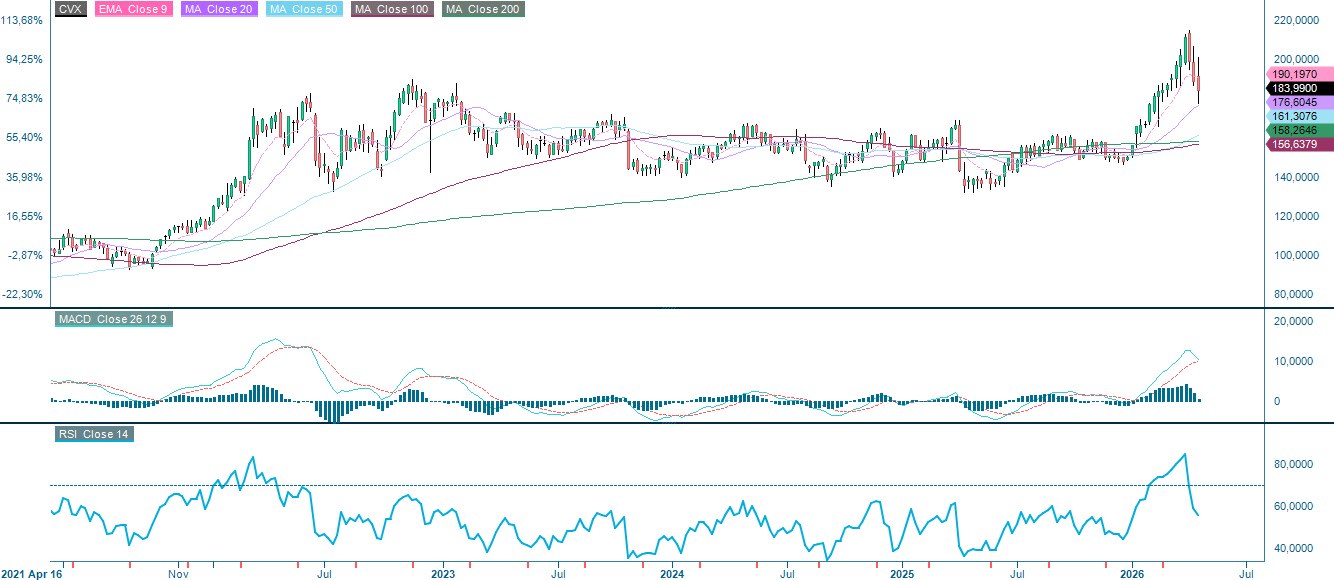
The prospect of high and rising oil prices could support the shares of energy companies, which have fallen in recent weeks despite earlier gains. Chevron, for example, is the second-largest US oil and gas company. According to consensus estimates compiled by Barron's, the stock is valued at a price-to-earnings (P/E) ratio of around 16 in 2026. Chevron is scheduled to release its first-quarter results on May 1. However, the full impact of higher oil prices and war-related disruptions is unlikely to be seen until Q2 results are released. The long-term trend for Chevron shares is positive, with prices reaching levels similar to those at the start of the war. The MA50 level at USD 192 per share could be the next upside target. In an upside scenario, reaching the all-time high of around USD 215 per share seems possible.
Chevron (CVX) in USD, one-year daily chart

Chevron (CVX) in USD, five-year daily chart
Mini Futures on Chevron Corp.
In general, however, most stock markets are likely to be negatively impacted by higher oil prices. The Japanese economy is relatively dependent on oil imports. In contrast, the Nikkei 225 Index is trading close to an all-time high. This suggests that investors are relaxed about the risks of higher oil prices. There could therefore be downside potential if the conflict in Iran drags on.
Nikkei 225 Index (in JPY), one-year daily chart

Nikkei 225 Index (in JPY), five-year daily chart

Mini Futures on the Nikkei 225 Index
Macro comments
As of Friday, April 20, 10 percent of all S&P 500® companies had reported their first quarter 2026 results. According to Earnings Insight, 88 percent of these companies reported positive earnings surprises and 84 percent reported positive revenue surprises. Among the S&P 500® sectors, Communication Services and Information Technology companies have delivered the most positive earnings surprises so far in the first quarter of 2026.
This week we have updated the ranking of global equity performance. The Nikkei index ranked first in terms of year-to-date (YTD) performance. Compared to the global equity market so far this year, the other major US equity indices have underperformed, with the exception of the Russell 2000 and its US small caps.
The one-month, annual and five-year performance of equity indices

On Wednesday, April 22, the following Stockholm-listed companies will present their interim reports for Q1 2026: ABB, Nordea, Handelsbanken, Tele2, Sandvik and Alfa Laval. Other Nordic companies presenting quarterly reports include the Finnish companies Nokian Renkaat and Metso. Interim reports are also expected from the following US companies: AT&T, Boeing, IBM, Lam Research, Philip Morris, Tesla, and Texas Instruments. . Macroeconomic headlines follow, starting with the UK Consumer Price Index and the Consumer Price Index for March. The Eurozone Household Confidence Indicator for April will be released shortly. The US Department of Energy will publish the weekly oil inventory data.
The following Stockholm-listed companies will present their interim reports for the first quarter of 2026 on Thursday, April 23: Essity, Gränges, Hexagon, Husqvarna, JM, Saab and Trelleborg. Other companies presenting interim reports are the Norwegian companies Europris and DNB and the Finnish companies Nokia and Orion. Interim reports are also expected from STMicroelectronics in Switzerland and Sanofi in France. In the USA, companies such as American Express, Caterpillar, Honeywell International, Intel, Lockheed Martin, NextEra Energy, Thermo Fisher Scientific and Union Pacific are on the reporting calendar. Thursday's macroeconomic news will be dominated by the April purchasing managers' indices from Japan, India, France, Germany, the eurozone, the UK and the US. France will publish a domestic business confidence indicator and the UK the CBI industrial trends, both for April. From the US, the Chicago Fed National Activity Index for March, the Weekly Initial Jobless Claims report and the Kansas Fed Index for April will be released.
On Friday, April 24, interim reports are due from the following Swedish companies: Electrolux, Indutrade, Nordnet, SCA, Telia, Volvo, as well as from the following Norwegian companies: Norske Skog, Tomra, Yara and Finland's Kemira. In the USA, an interim report from Procter & Gamble is expected. Friday's macro data will start with the Japanese consumer price index for March. A few hours later, the Swedish producer price index for March and UK retail sales for March will be released. This is followed by a survey on French household confidence and the Ifo index for Germany, both for April. Finally, the Michigan index for April is published from the USA.
Could the reporting season give the stock market a further boost?
Share prices skyrocketed on the back of progress towards a peace agreement with Iran and the possible reopening of the Strait of Hormuz. The market seemed unstoppable and the S&P 500® reached new highs. However, escalating tensions between the US and Iran over the weekend led to a change in sentiment on Monday, April 20, while the price of oil and the 2-year US yield bounced off support. The RSI points to overbought conditions. Unless the reporting season can provide fresh impetus, a dip below 7000 could provide an opportunity to lock in gains, with the next support at 6750.
S&P 500® (in USD), one-year daily chart

S&P 500® (in USD), five-year weekly chart

Mini Futures on the S&P 500® Index
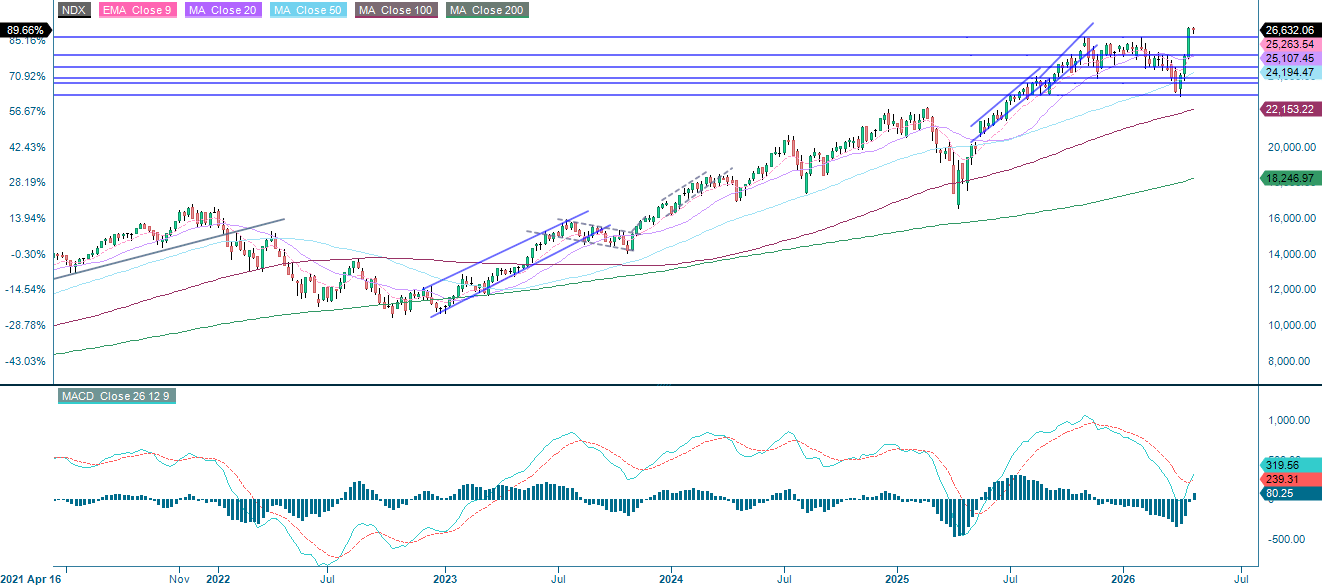
On Monday, April 20, the NASDAQ-100 Index® ended its 13-day winning streak, the longest since 1992, fueled by enthusiasm for artificial intelligence and optimism over the de-escalation of the situation in Iran, but momentum stalled when geopolitical risks resurfaced over the weekend. Although the RSI is in overbought territory, a dip below 26,160 would provide a good opportunity for profit-taking, with the next support at around 25,135.
NASDAQ-100 Index® (in USD), one-year daily chart

NASDAQ-100 Index® (in USD), five-year weekly chart
Mini Futures on the NASDAQ-100 Index®
The DAX® is currently testing the support levels between 24,000 and 24,220. The next step could be a breakout to the downside and below the MA20, which is currently at 23,445.
DAX® (in EUR), one-year daily chart

DAX® (in EUR), five-year weekly chart

Mini Futures on DAX®
The full name for the abbreviations used in the previous text:
EMA 9: 9-day exponential moving average
Fibonacci: There are several Fibonacci lines used in technical analysis. The Fibonacci numbers are a sequence in which each subsequent number is the sum of the two previous numbers.
MA20: 20-day moving average
MA50: 50-day moving average
MA100: Moving 100-day average
MA200: 200-day moving average
MACD: Convergence/divergence of the moving average
External author:
This information is the sole responsibility of the guest author and does not necessarily represent the opinion of Bank Vontobel AG or any other company of the Vontobel Group. The further development of the index or a company and its share price depends on a large number of company-, group- and sector-specific as well as economic factors. Every investor must take the risk of share price losses into account when making an investment decision. Please note that no current income can be achieved by investing in these products.
The products are not capital-protected; in the worst case, a total loss of the capital invested is possible. In the event of insolvency of the issuer and the guarantor, the investor bears the risk of a total loss of his investment. In any case, investors should note that past performance and/or analysts' opinions are not a sufficient indicator of future performance. The performance of the underlying assets depends on a variety of economic, corporate and political factors that should be taken into account when forming a market expectation.