Investors’ Outlook: Over the peak

Having held up well for most of the year, financial markets hit a rough patch in October. A sell-off in government bonds pushed yields higher, and the turbulence spilled over into equities. Later in the month, a tech-driven stock correction prompted a flight to safety that lifted government bond prices.
Growing strains
Energy markets were thrown off balance too, as Iran aligned Houthi forces claimed responsibility for attacks on Saudi Arabian energy and civilian infrastructure, reviving concerns that the world’s oil supply could be at risk. With the situation in the Middle East already fragile, the new disruption sent Brent crude well above USD 100 per barrel, and the jump was soon felt in refined products such as diesel and gasoline. Keen to bring prices down before the midterm elections on November 3rd, US President Donald Trump threatened to curb diesel exports, then secured Europe’s agreement to coordinate the release of part of its diesel reserves. The push was likely a sign of how politically sensitive high fuel costs have become. Citing US national interests, Trump also suspended parts of a Russia sanctions package days before it was due to take effect. With the US midterm elections over soon, he may turn more of his attention abroad, which carries the risk of headlines on tariff threats or escalation in the Middle East.
Bending, not breaking: 2026 was the year of resilience. What to expect for 2027?
Investors spent much of 2026 worrying about a series of shocks that, on paper, appeared capable of derailing the global expansion. Geopolitical tensions in the Middle East escalated, the temporary closure of the Strait of Hormuz pushed Brent crude prices above USD 100 per barrel, and renewed trade disputes fueled fears of a return to the tariff battles of 2025. Yet the global economy absorbed these blows far better than many had expected. Rather than faltering, growth remained strong. Manufacturing activity strengthened across much of the world, with the global manufacturing cycle regaining momentum.
The US stood out, as the ongoing AI investment boom unleashed a wave of spending on data centers, semiconductors, and digital infrastructure. What initially appeared to be a narrow technology story increasingly spilled over into broader business investment and industrial activity. Nor was this resilience limited to the US. Across Asia, export-oriented economies benefited from a recovery in global demand and the continued strength in the technology cycle. South Korea, often regarded as a bellwether for global growth because of its exposure to trade and electronics, reported surging exports throughout much of the year, sending a reassuring signal about underlying demand in the world economy. In Europe, Germany’s export-sensitive economy enjoyed a manufacturing recovery as well. Even amid dramatic headlines, the economic backdrop became more stable. Measures of economic policy uncertainty generally trended lower over the course of the year. While tariff threats featured prominently in the headlines, many proposed measures were ultimately softened, delayed, or never implemented, reducing the economic damage feared by financial markets.


Outlook for growth, inflation, and monetary policy in 2027
The global economy may have weathered 2026, but the outlook for 2027 is likely to be more challenging. Higher oil prices have rekindled inflationary pressures, prompting major developed-market central banks to tighten monetary policy. The European Central Bank (ECB), for example, has raised rates by a cumulative 50 basis points (bps), bringing the deposit facility rate to 2.50 percent, and the Fed delivered a 25 bps hike in September, lifting the federal funds rate to a range of 3,75 – 4 percent.
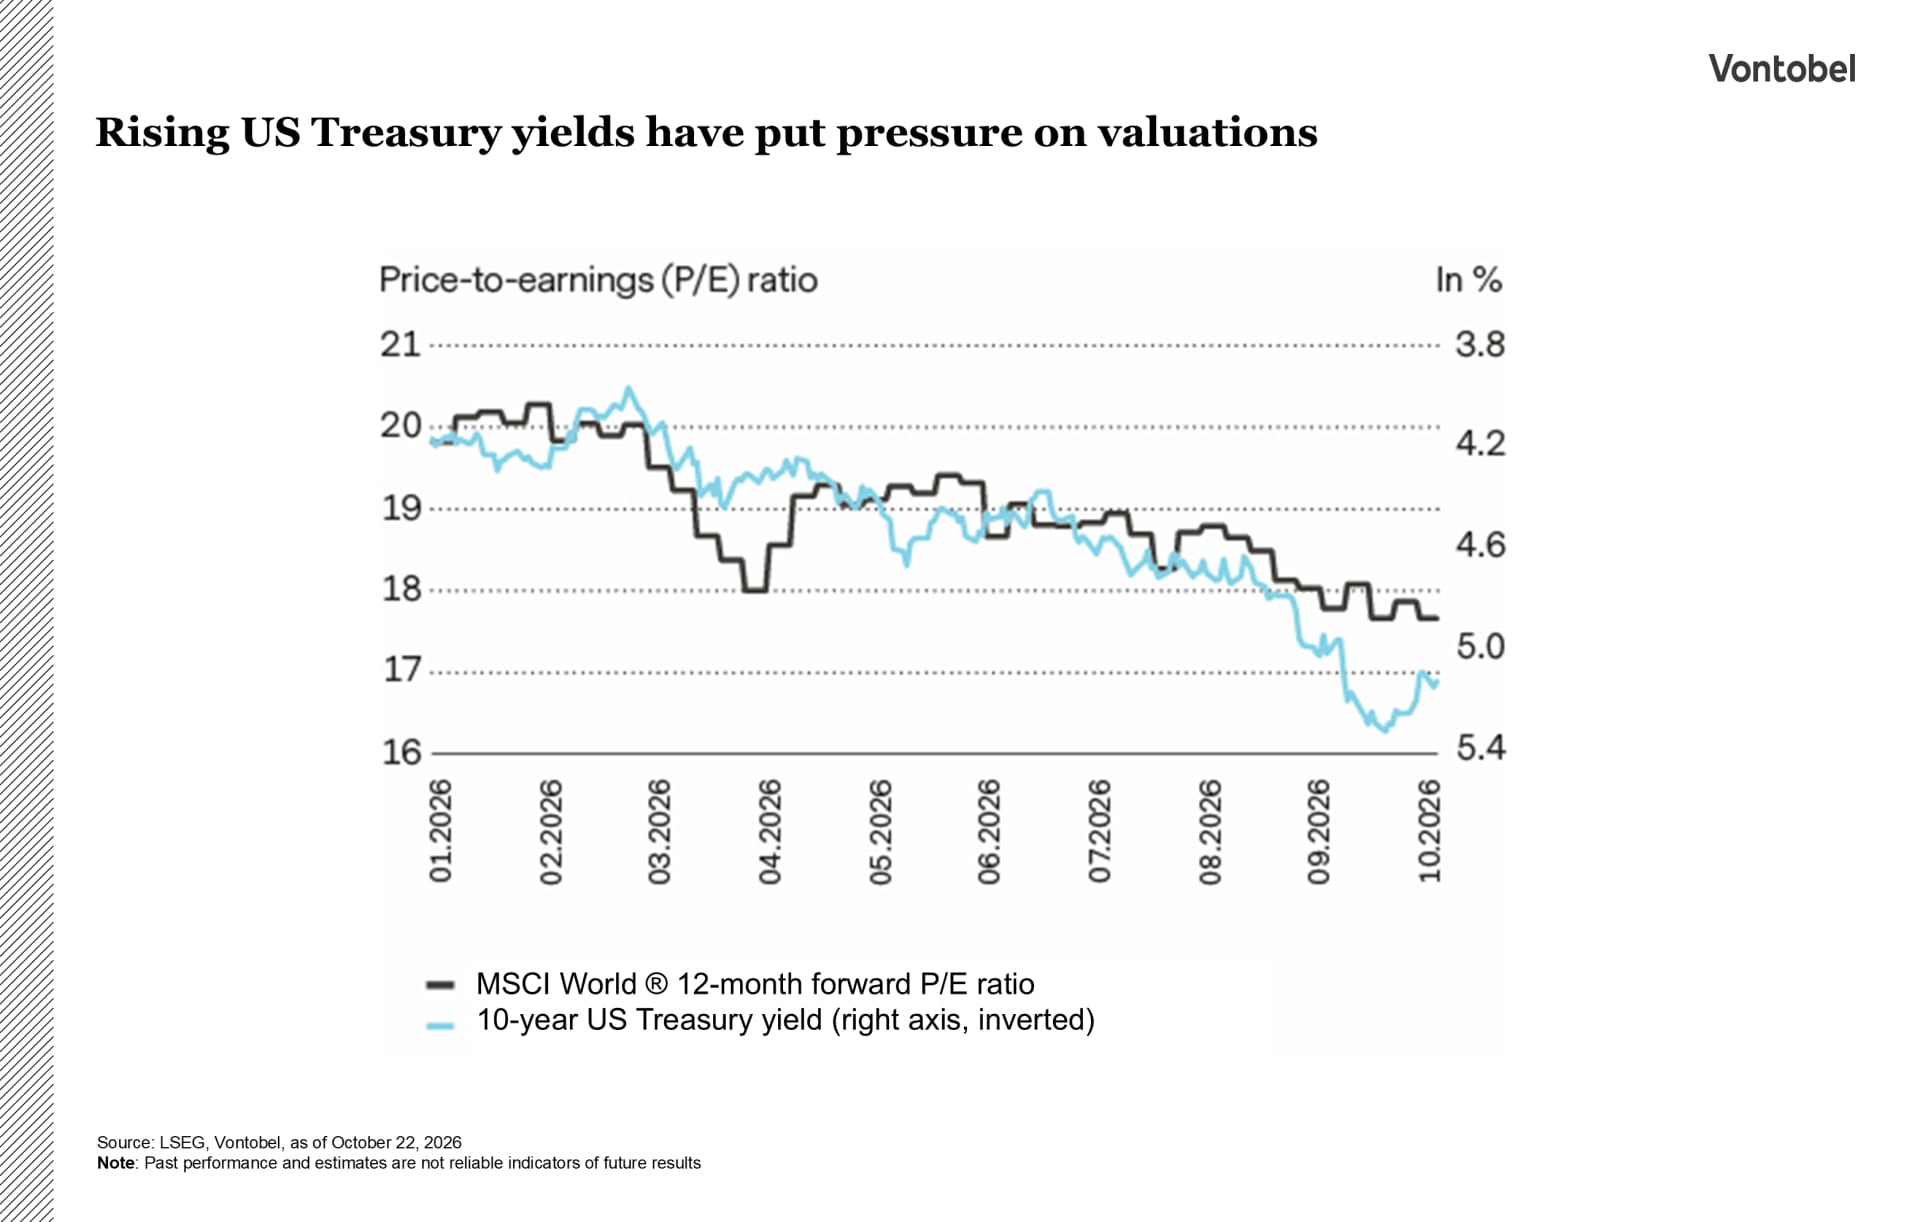
In Asia, the Bank of Japan has pushed its policy rate to a 31-year high of 1,25 percent. Monetary conditions have tightened as policy rates have increased and bond yields have risen. In the US, the 10-year Treasury yield has climbed by more than 100 bps in 2026, breaching the 5 percent threshold. The move has reverberated across global fixed-income markets, pushing up European sovereign yields and driving French borrowing costs higher amid mounting fiscal concerns. This repricing has not been confined to highly indebted countries. Yields have also risen markedly in lower-debt markets such as Germany and Switzerland, which showed the global reach of the sell-off. Higher policy rates and bond yields are likely to act as an increasing headwind to growth in 2027.
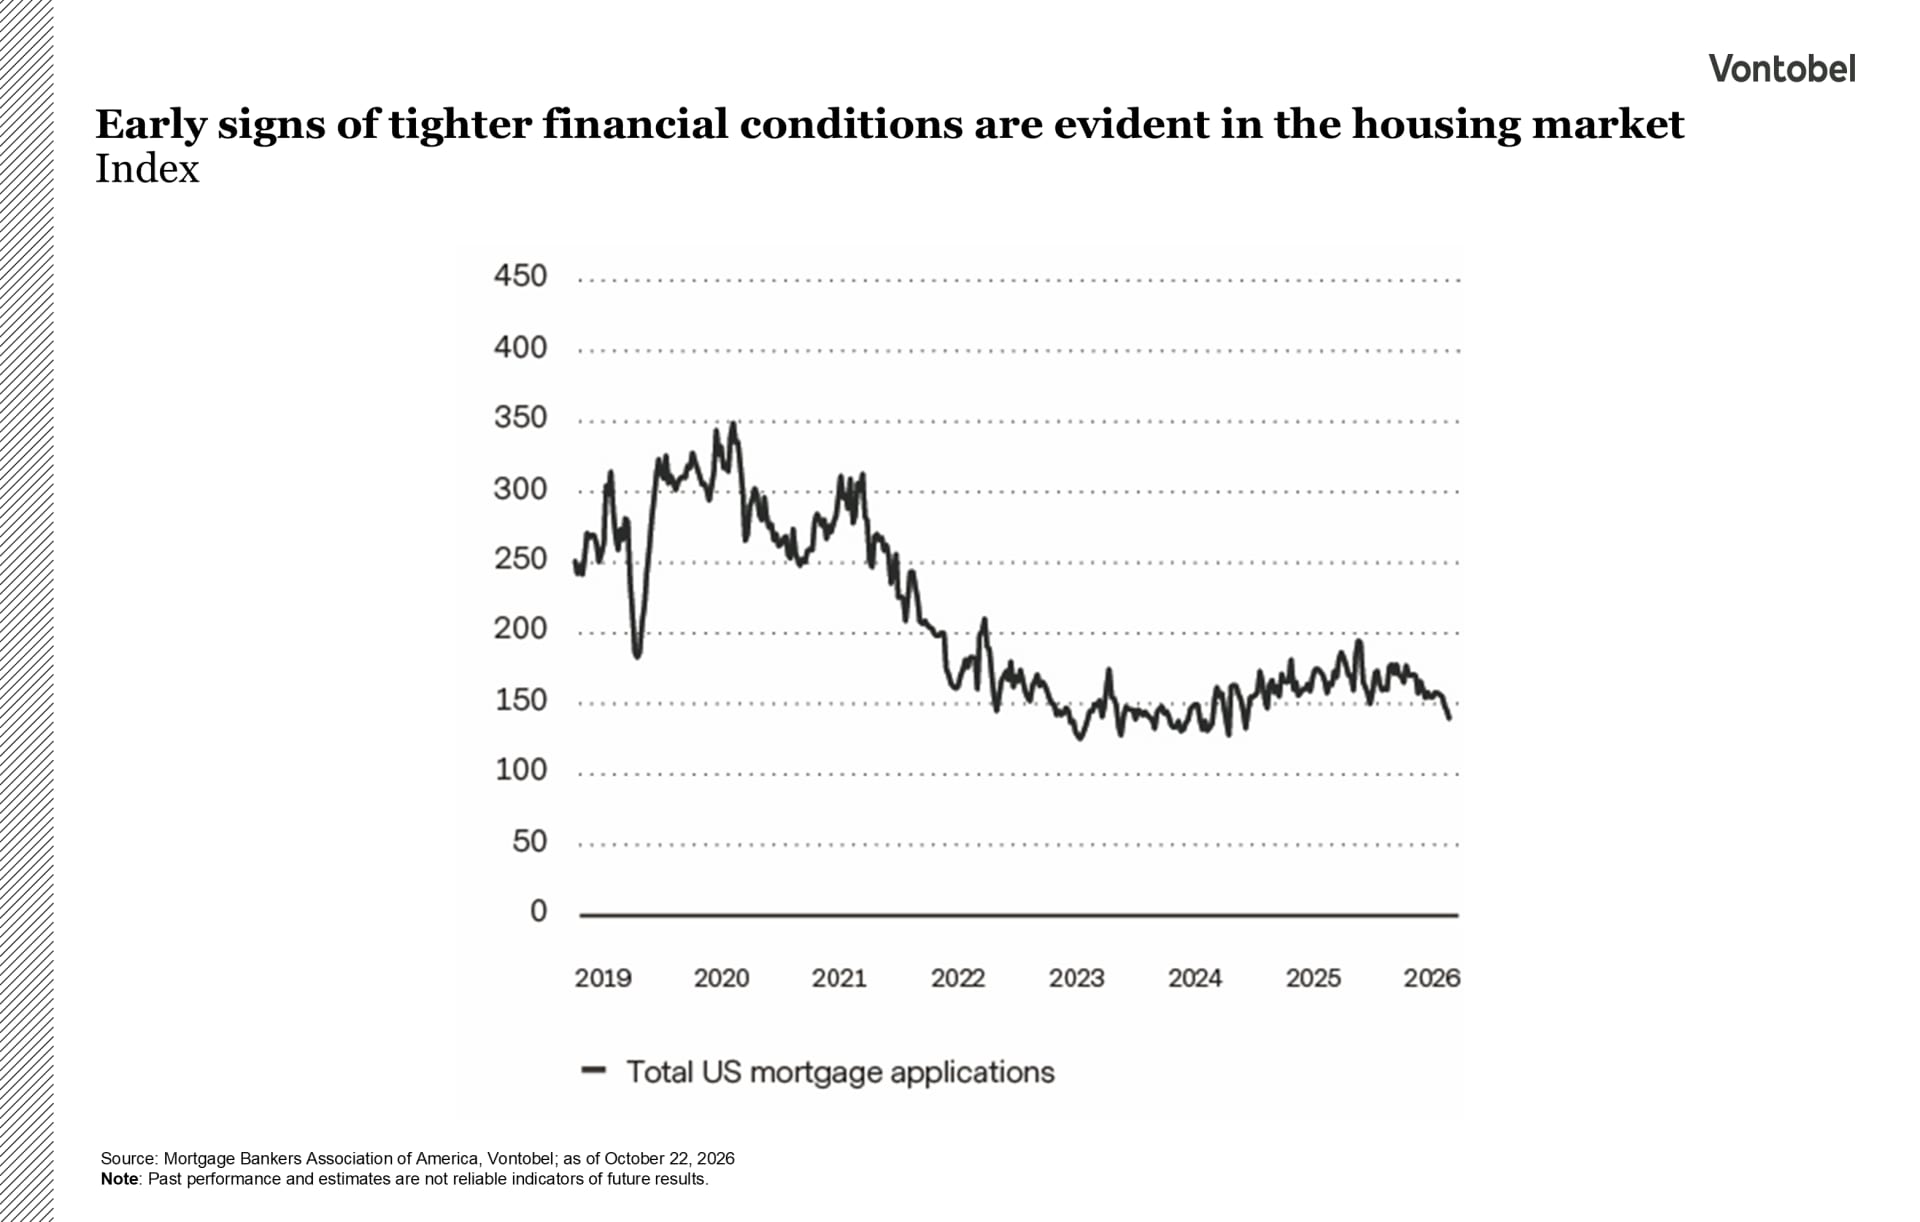
The impact is already becoming visible in interest-rate-sensitive areas of the economy, with housing typically serving as the earliest indicator of a turning business cycle. In the US, the 30-year fixed mortgage rate, which is closely tied to bond yields, pushed past 7.6 percent in late October. Mortgage applications fell in its wake, highlighting the impact of higher borrowing costs on housing demand and residential investment. Costlier consumer credit is likely to weigh on household spending, while steeper funding costs encourage businesses to rein in capital expenditure. Rising interest rates can also put pressure on equity valuations, reducing wealth effects and thereby tempering consumption. Finally, higher debt-servicing costs leave governments with less fiscal room to prop up economic activity.
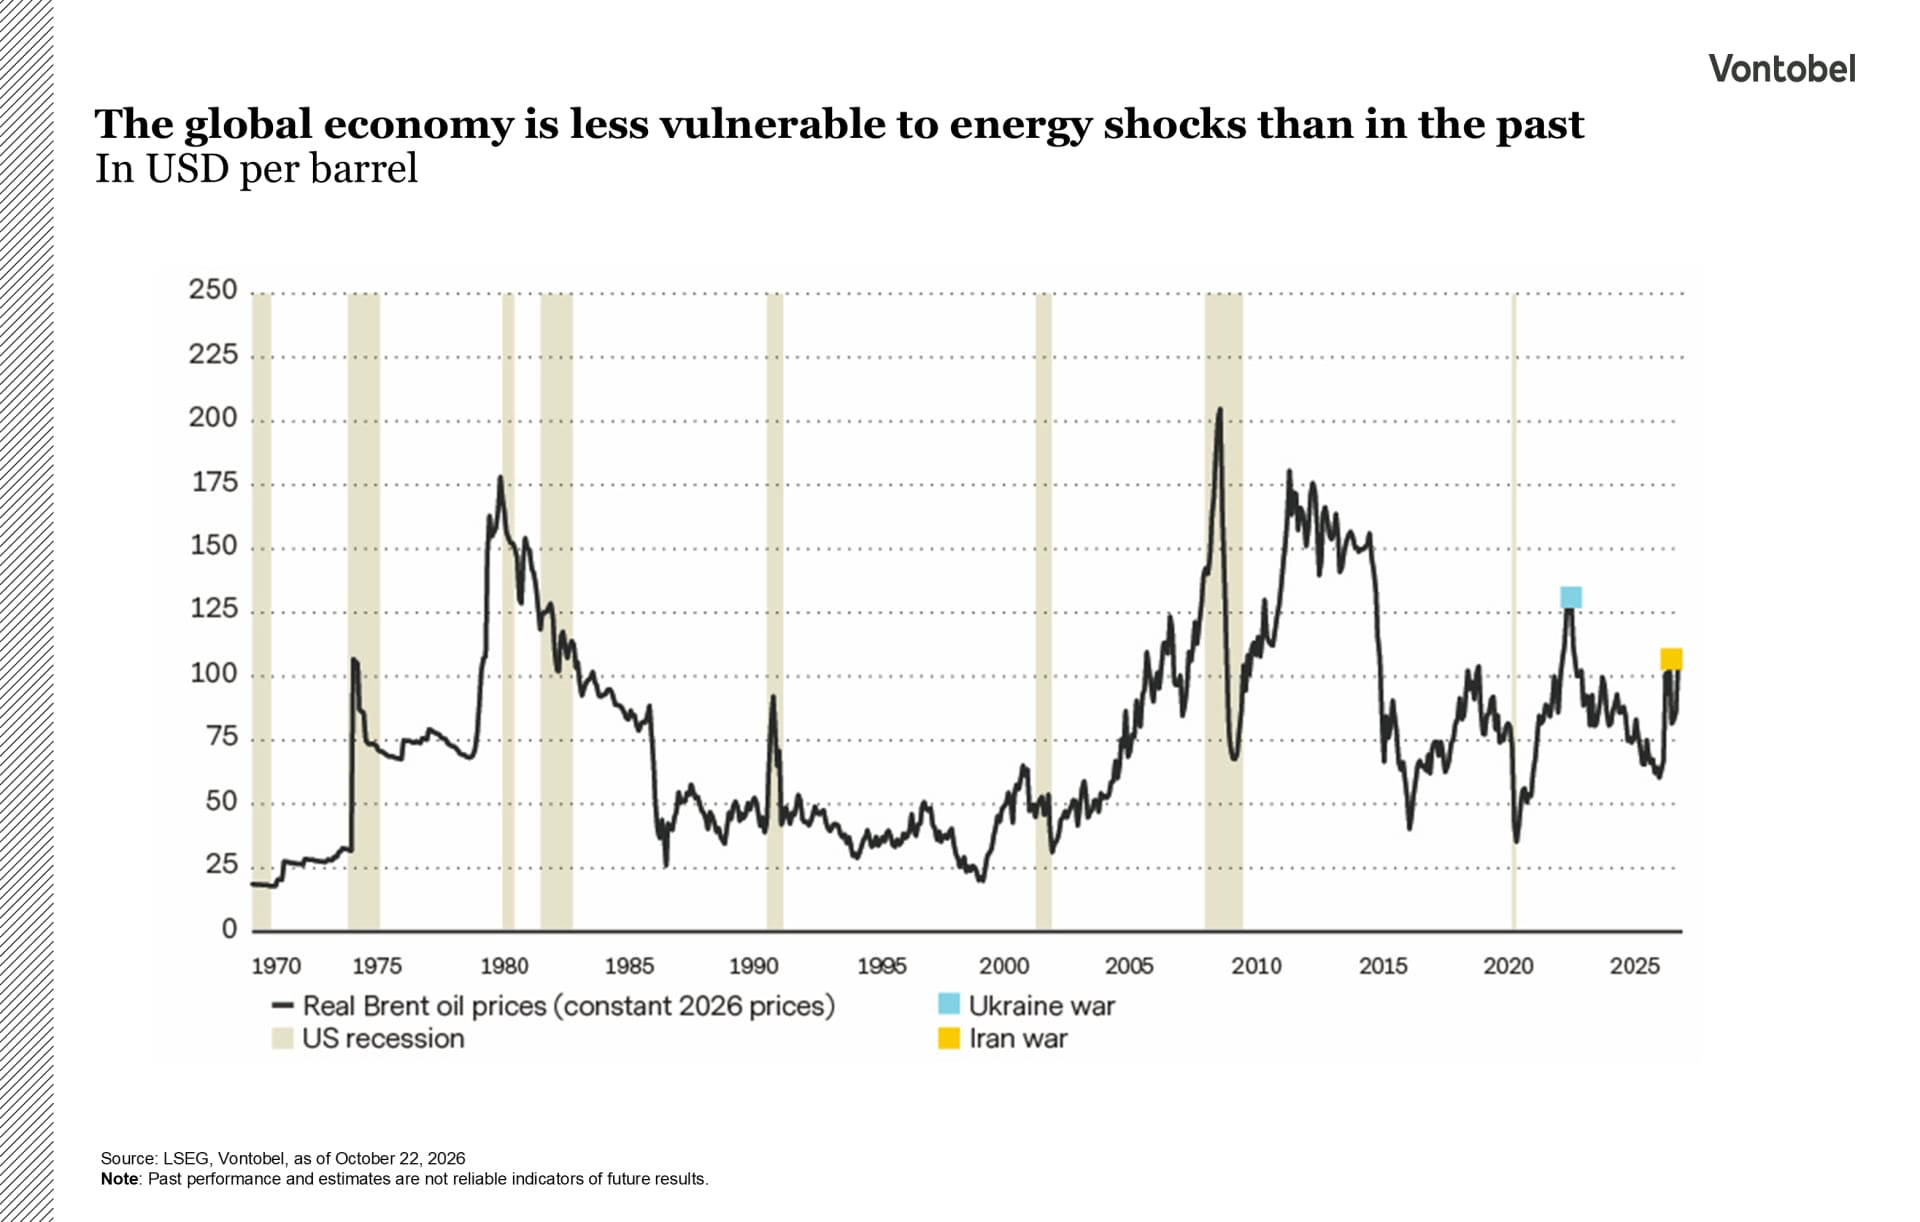
Although economic growth may moderate, a recession is not the Multi Asset team’s base case. The economy looks sturdy enough to withstand somewhat tighter financial conditions. Households are in relatively healthy shape, having pared back their leverage since the Global Financial Crisis. As a result, higher interest rates are more likely to slow economic activity at the margin than to trigger the balance-sheet stress seen in previous downturns. The economy is probably robust enough to digest current oil price levels. Nominal oil prices may appear high, but real oil prices, once adjusted for inflation and income growth, sit well below the levels seen during past energy crises. This distinction is relevant because oil prices of USD 100 per barrel sting far less when household incomes, corporate revenues, and the overall price level stand much higher than they did a few decades ago.
Lastly, and perhaps most importantly, the global economy is still buoyed by a powerful capital expenditure cycle. Investment spending is likely to remain supported by the continued AI boom, which is driving large-scale spending on data centers, power generation, and digital infrastructure. At the same time, many countries are accelerating investments aimed at reducing strategic dependencies on the US and other foreign suppliers, while rising defense spending commitments are providing an additional tailwind.
Together, these forces should help keep economic activity afloat even as tighter financial conditions weigh on more rate-sensitive sectors of the economy.
What about the inflation outlook? To answer that, it helps to step back and consider what drove prices in 2026. Much of this year’s upward pressure traced back to three sources: the lingering impact of higher tariffs, the Middle East energy shock, and the surge in AI-related investment. Inflation remains uncomfortably high, but some of these forces may lose their intensity in 2027. The energy shock, for one, may gradually unwind as crude flows through the Strait of Hormuz normalize, additional capacity comes online in Saudi Arabia and the United Arab Emirates, and producers outside the Gulf maintain solid output growth. As a result, energy prices are unlikely to exert the same inflationary jolt next year as they did in 2026.
Not every driver is fading, though. The buildout of AI infrastructure continues to feed demand for labor, electricity, data centers, semiconductors, and a range of industrial inputs, creating pockets of upward price pressure across the global economy. Even so, the disinflationary effects from easing energy pressures and the fading tariff shock should outweigh these sector-specific inflationary forces, allowing overall inflation to trend lower in 2027.
Tighter financial conditions and slower economic growth is likely to help contain demand-side inflation pressures as 2027 unfolds. Higher interest rates, elevated bond yields, and a cooling economy should gradually dampen demand, while wage growth remains surprisingly subdued across most major economies. This is encouraging, as wages are often the channel through which temporary price shocks become embedded in broader inflation dynamics. Taken together, underlying inflation pressures are likely to moderate rather than intensify over the coming year.
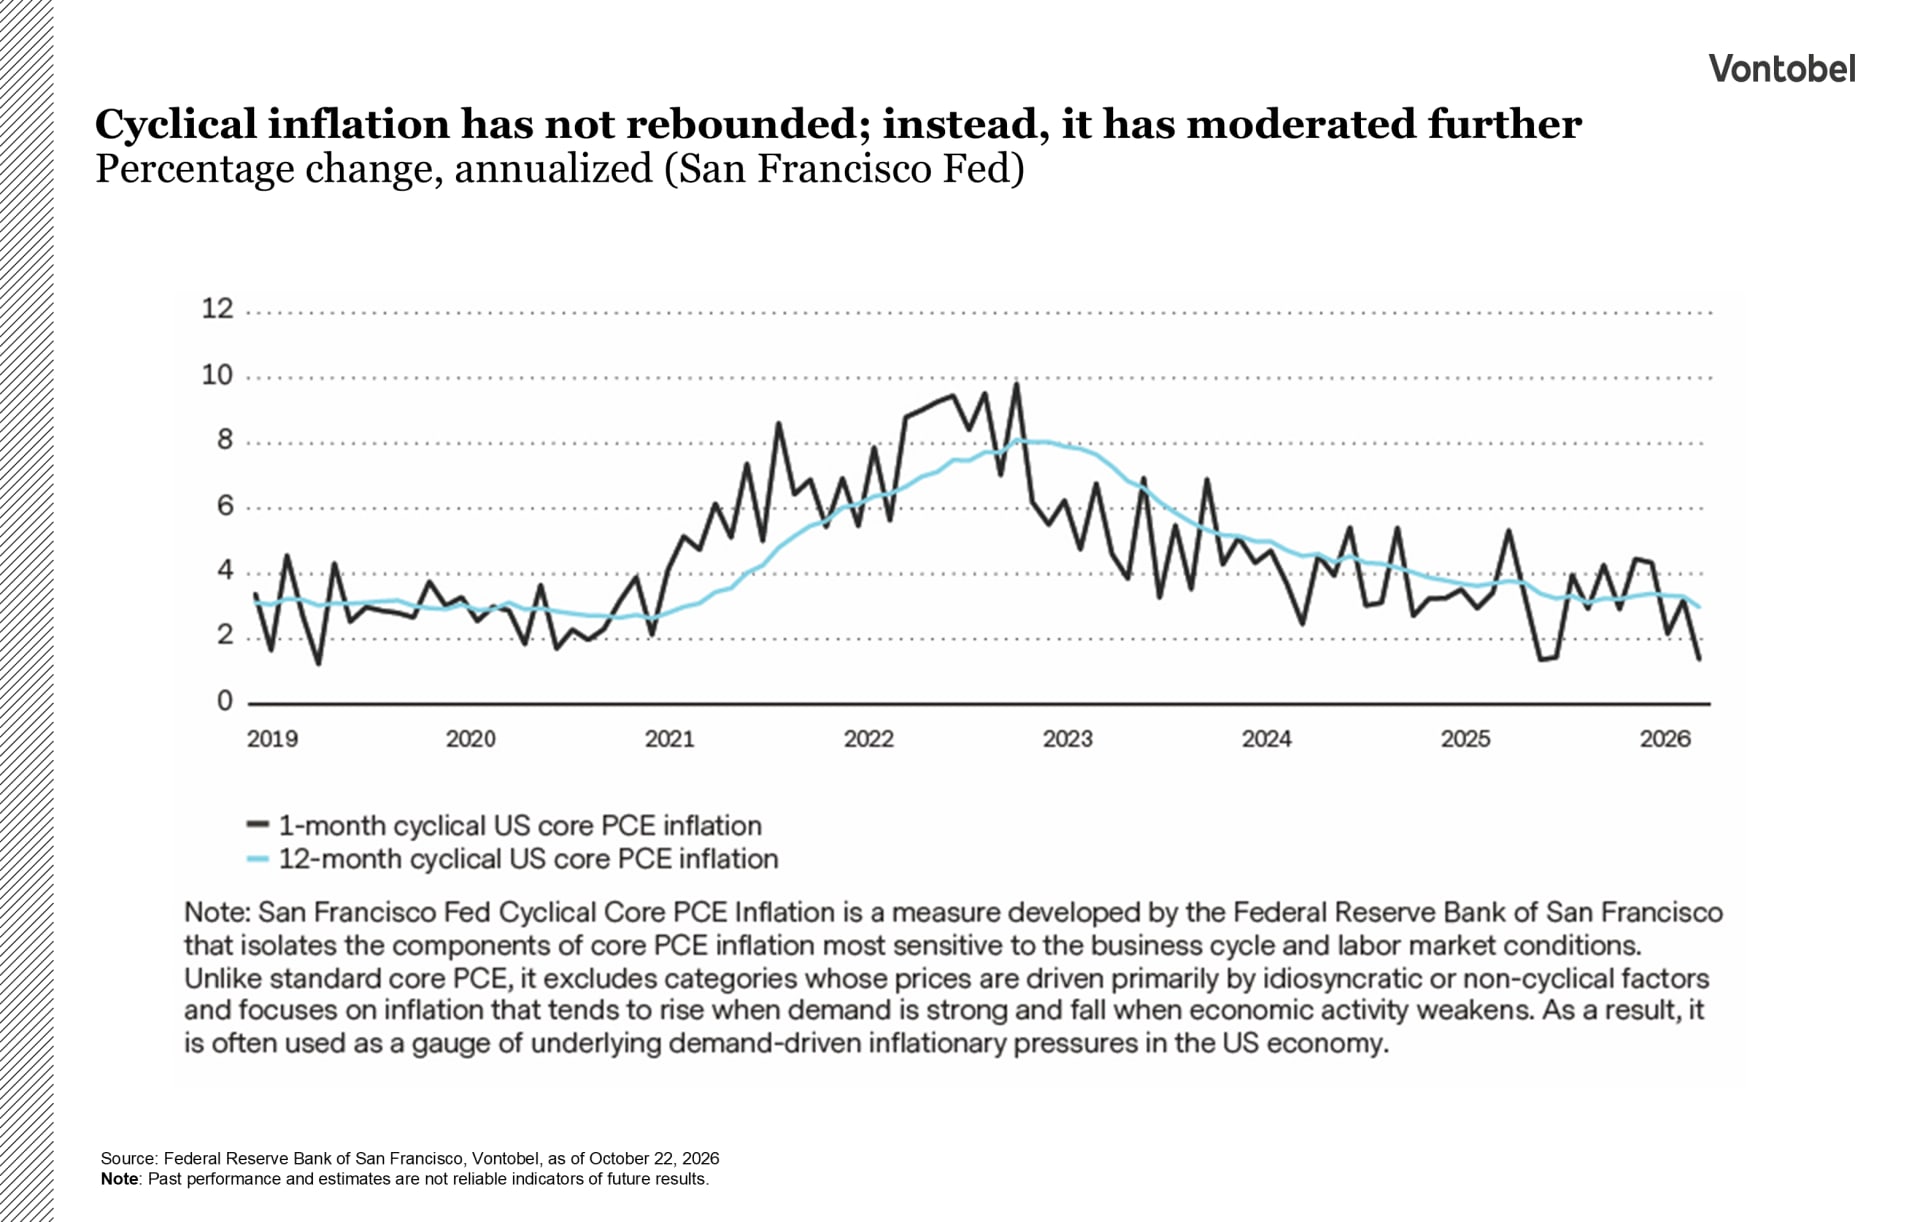
When it comes to the monetary policy outlook, the current tightening cycle likely has limited longevity. Headline inflation has been pushed higher by supply-side developments, but underlying inflation trends remain considerably more benign. In the US, cyclical inflation,
as measured by the San Francisco Federal Reserve’s Cyclical Core Personal Consumption Expenditures (PCE) Inflation gauge, has not reaccelerated. If anything, the opposite has occurred: the measure has kept inching lower, suggesting that demand-driven price pressures remain well contained despite the recent energy shock. Longerterm inflation expectations have also been stable. Five-year forward inflation swap rates have stayed remarkably well anchored, an indication that investors continue to view the recent inflation pickup as a passing supply shock rather than the beginning of a new inflation regime.
The labor market also warrants close attention. Historically, central-bank tightening cycles have often ended not because inflation suddenly disappeared, but because economic activity and labor demand began to soften. The US labor market has remained resilient so far, yet there are signs of gradual cooling beneath the surface. The next meaningful deterioration in employment conditions could give policymakers the catalyst they need to bring the current tightening cycle to a close.
Key Risks to the Multi Asset team's 2027 outlook
While its base case remains one of continued, albeit slower, economic growth and somewhat sticky but manageable inflation in 2027, the range of potential outcomes is wide. Several risks could tilt the economy toward either a more inflationary or a more deflationary path.
Geopolitics likely remains the foremost upside risk to inflation and downside risk to growth. A renewed supply shock, whether it originates in the Middle East, Eastern Europe, or some other flashpoint, could once again disrupt trade flows, energy markets, and global supply chains. The global economy appears less vulnerable to energy shocks than in the past, but another surge in commodity prices would complicate the inflation outlook and constrain central banks’ ability to support growth.
Fiscal sustainability is a second concern. Government debt levels have risen significantly across much of the developed world, and higher interest rates have increased debt-servicing costs. Markets have so far been willing to finance large deficits, but investor confidence cannot be taken for granted. Any reassessment of fiscal sustainability, particularly in major economies such as the US, France, or the UK, could potentially trigger higher bond yields, tighter financial conditions, and stoke market volatility.
On the downside, central banks may be overestimating how much restrictive policy the economy can bear. Monetary policy tends to work with long and variable lags, so the full weight of past tightening may yet be felt. If rates stay restrictive for too long, weakness in rate-sensitive sectors such as housing could spill over into consumption, investment, and employment, increasing the risk of recession.
Finally, the possibility of an AI-related downturn is one that investors may wish to keep in mind. As discussed above, the current wave of investment in AI infrastructure has become a major driver of global capital expenditure. The longterm potential of AI remains considerable, but periods of technological fervor have historically been accompanied by episodes of overinvestment. A slow-down in AI spending, weaker-than-expected commercial adoption, or a breakthrough by competing regions could temper expectations and weigh on growth, particularly in sectors that have benefited most from the boom.
These risks point in very different directions. Geopolitical and fiscal shocks would likely prove inflationary, whereas a recession born of overtightening or a reversal of the AI investment cycle would lean deflationary.
Running ahead
On October 28, the Fed left its target range at 3,75 – 4 percent, with two members favoring a 25 bps increase. December tightening remains a market expectation, not a Fed commitment. The gap is in 2027: the Fed’s median projection shows rates flat, while markets anticipate close to two further hikes.
The market is more likely to move toward the Fed than the other way around. Energy has driven much of this year’s rise in inflation, and wage growth has stayed moderate. If sticky core services inflation eases, the extra rate hikes priced in for 2027 would likely be the first to go.
The composition of the rise in yields supports this view. Almost all of this year’s rise in 10-year Treasury yields reflects higher real yields rather than higher inflation compensation, and a higher expected path for policy rates rather than a higher term premium. Firmer growth plays a part, with second-quarter gross domestic product revised up and activity holding up into the autumn. But the Fed’s own projections point to inflation as the driver. This is an oil shock filtered through the expected Fed response, and it shows up in real yields because the market trusts the Fed. Such a move can reverse. The main risk would be doubt about the Fed’s resolve, which could weigh most on longer maturities. At around 5 percent, 10-year yields may offer an attractive asymmetry, with potential gains appearing larger than potential losses. For illustration purposes only, over 12 months, a yield rise of about 75 bps could be absorbed before a US dollar investor incurred a loss, while a one-percentage-point fall could imply a return of more than 12 percent.*
In credit, spreads have widened, most visibly in high yield, where stress has spread from CCC-rated bonds to BB and B.3 With yields around 8 percent, no recession in the team’s base case, and companies still able to raise new funding, the team sees no case for turning negative. Investment-grade (IG) spreads also remain thin and offer little compensation for the supply ahead. After a pause since August, AI-related issuance in the US IG market looks set to resume with Microsoft’s planned bond sale, while hyperscalers’ spending plans point to further large, long-dated deals. With little spread cushion, returns are likely to come from carry and rates, not tighter spreads.
*Note: These scenarios are not forecasts; actual returns may differ.


A change of mood
Few themes have had a greater impact on equity markets than AI, and few have been as volatile. In recent weeks, the AI trade suffered one of its steepest setbacks yet, as chipmakers recorded their longest losing streak since 2008. Yet the weakness was concentrated within technology. Defensive sectors such as consumer staples, energy, and health care gained ground, styles such as quality and low volatility outperformed, and the average stock held up better than the major indices.
The sell-off came down to four main concerns. First, higher-than-expected US inflation sent bond yields to their highest levels in over two decades, weighing on equity valuations. Second, investors grew more concerned about how the AI boom would be financed. Building the infrastructure requires enormous capital, much of it funded with debt, and as borrowing costs rose, bonds issued by the most indebted AI computing providers slumped. The worry quickly spread to equities as industry leaders warned that access to financing could become a bigger constraint on AI growth than chips or electricity. Third, progress announced by CXMT, a Chinese memory-chip maker, fueled concerns about pricing power, hitting South Korea and Taiwan particularly hard. Finally, crowded positions in a small group of AI winners amplified the decline as investors rushed for the exit.
The AI cycle has likely not yet peaked. Demand is still strong, and the latest company results confirm that computing power is in short supply. Investors are weighing the pace of AI growth against the cost of funding it, and becoming more selective, rewarding companies that can finance their investments from their own profits.
Several factors may support equities from here. The earnings picture has been encouraging across regions, and bond yields appear to be stabilizing from their peak, taking some pressure off valuations. Sentiment and positioning have become less stretched, leaving markets on a somewhat healthier footing. Concerns about debt could recede if large cloud providers fund more of their AI spending from their own cash flows.
Risks haven’t disappeared. Inflation could stay sticky, energy prices and geopolitical tensions could flare up again, and volatility is poised to stay elevated. But overall, it looks like a healthy adjustment in an ongoing investment cycle. It also highlights that concentration carries risks, as portfolios heavily weighted toward a handful of large companies may be less diversified than they appear.

From tight to tamer
2026 was a year of tight, volatile oil markets. Supply disruptions kept prices well supported, even as demand suffered its second-largest annual decline in 60 years. Despite the recent strength, the team’s base case for 2027 is one of gradual normalization, with firmer prices in the first half and softer prices in the second.
Inventories absorbed most of the supply shock. Rather than being offset by an immediate increase in production elsewhere, hundreds of millions of barrels were drawn from government and commercial stockpiles to offset lost Middle Eastern supply, preventing prices from rising further. Yet high prices ultimately did what high prices tend to do: they curtailed demand. The International Energy Agency (IEA) estimates that global oil demand fell by around 2.5 to 2.6 million barrels per day in 2026, most visibly in Europe and Asia.
The outlook for 2027 looks different. As Middle Eastern exports normalize and trade flows recover, consensus expectations are for the market to swing from deficit into surplus. Non-Middle Eastern producers have little incentive to restrain output after benefiting from elevated prices throughout much of 2026, so supply growth
could stay robust, at least early in the year. A looser market does not automatically translate into a big drop in prices. The 2026 inventory drawdowns have created substantial restocking needs, meaning part of the expected surplus may never reach the spot market, as governments, refiners, and traders seek to rebuild depleted reserves.
The US Strategic Petroleum Reserve (SPR),6 which is near its lowest level since 1982, is a case in point. No meaningful refilling has taken place yet. Commercial oil inventories, meanwhile, have already shown signs of rebuilding, while product inventories are lagging. This supports the team’s view that oil prices could stay relatively well supported in the first half of 2027. As restocking runs its course and surplus production becomes harder to absorb, softer market fundamentals could become increasingly visible in the second half.
Where could the team be wrong? One risk is that the Middle East conflict escalates into a broader regional war, damaging energy infrastructure, disrupting key shipping routes, and removing significant volumes from the market. This is probably not the most likely scenario, as few parties want an oil shock that could tip the global economy into recession and destroy oil demand. Conversely, the cohesion of the Organization of the Petroleum Exporting Countries and its allies (OPEC+) may be tested. Some producers may prefer to maximize exports while prices remain high over managing supply jointly. If producers end up competing for market share, oil prices could fall more than expected.


The euro pays a French risk premium
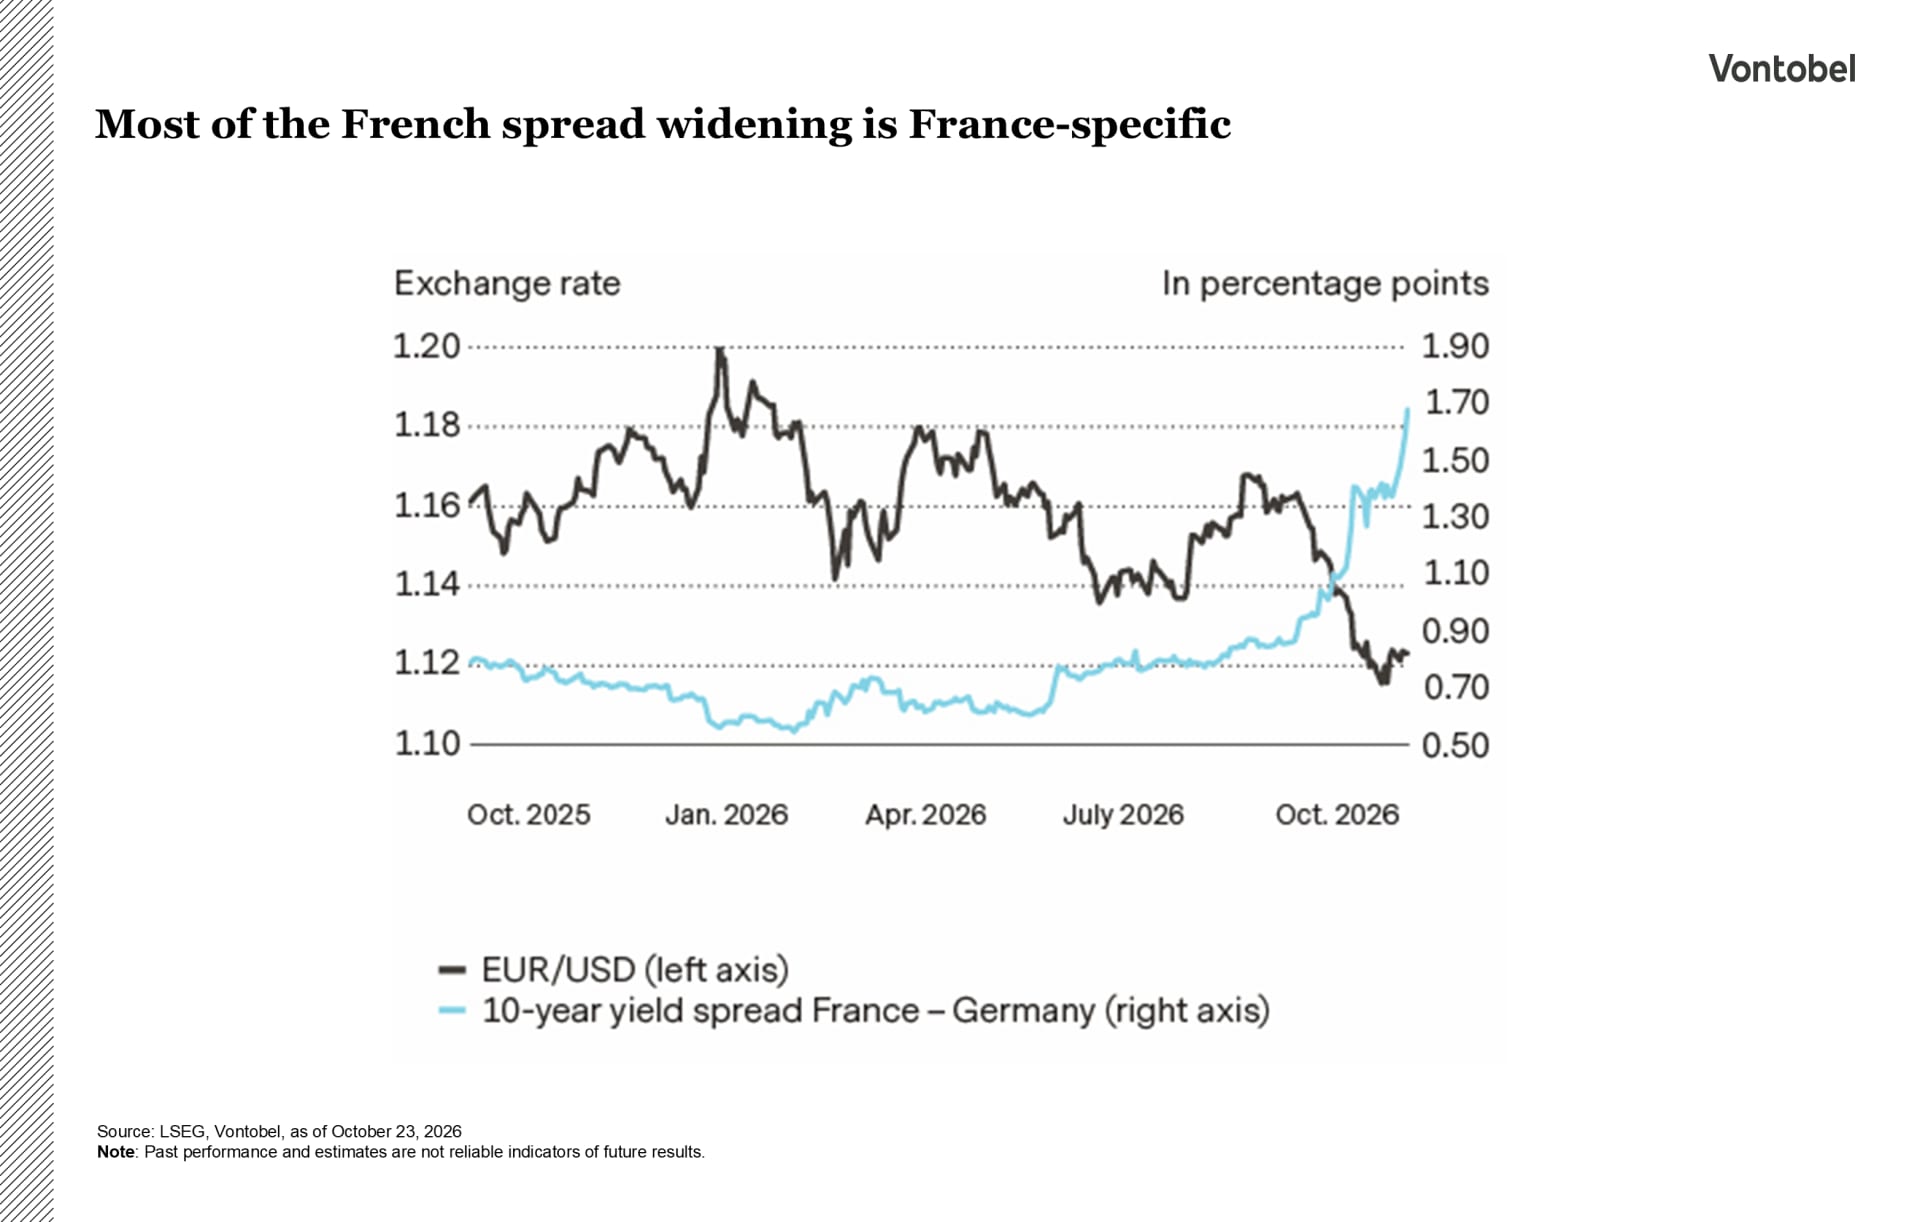
The euro has had a difficult autumn. Its exchange rate against the US dollar (EUR / USD) has fallen from just above 1.20 in January to around 1.12, and the drop since mid-September has been faster than higher US rate expectations alone would explain. French fiscal uncertainty has added to the pressure.
The gap between French and German 10-year government bond yields has widened sharply since July, to levels last seen during the euro debt crisis, and the euro has weakened alongside it. The speed of the move has stood out more than its size, a sign that market liquidity has thinned. The team’s analysis suggests that changes in growth and inflation expectations explain only a small part of the widening. Most of it appears to reflect the budget and politics. Cutting a deficit of around 5 percent of GDP is difficult for a fragmented parliament ahead of the 2027 presidential election.
Still, this looks like a French problem, not a euro crisis. In 2011, sovereign bonds, banks, equities and money markets came under pressure at the same time. Today, the strain is largely confined to French government bonds. Italian and Spanish bonds show little stress, and the ECB’s measure of systemic stress is near historic lows. As long as the widening reflects French fiscal risk rather than disorderly markets, the bar for ECB intervention is likely to stay high. EUR/USD is likely to trade in a range of roughly 1.10 to 1.15 until a budget is passed. A credible budget could quickly remove part of the French risk premium, while a downgrade of France’s credit rating or a failed budget vote could push the euro toward the lower end of that range.
A rates bounce, not a new dollar uptrend
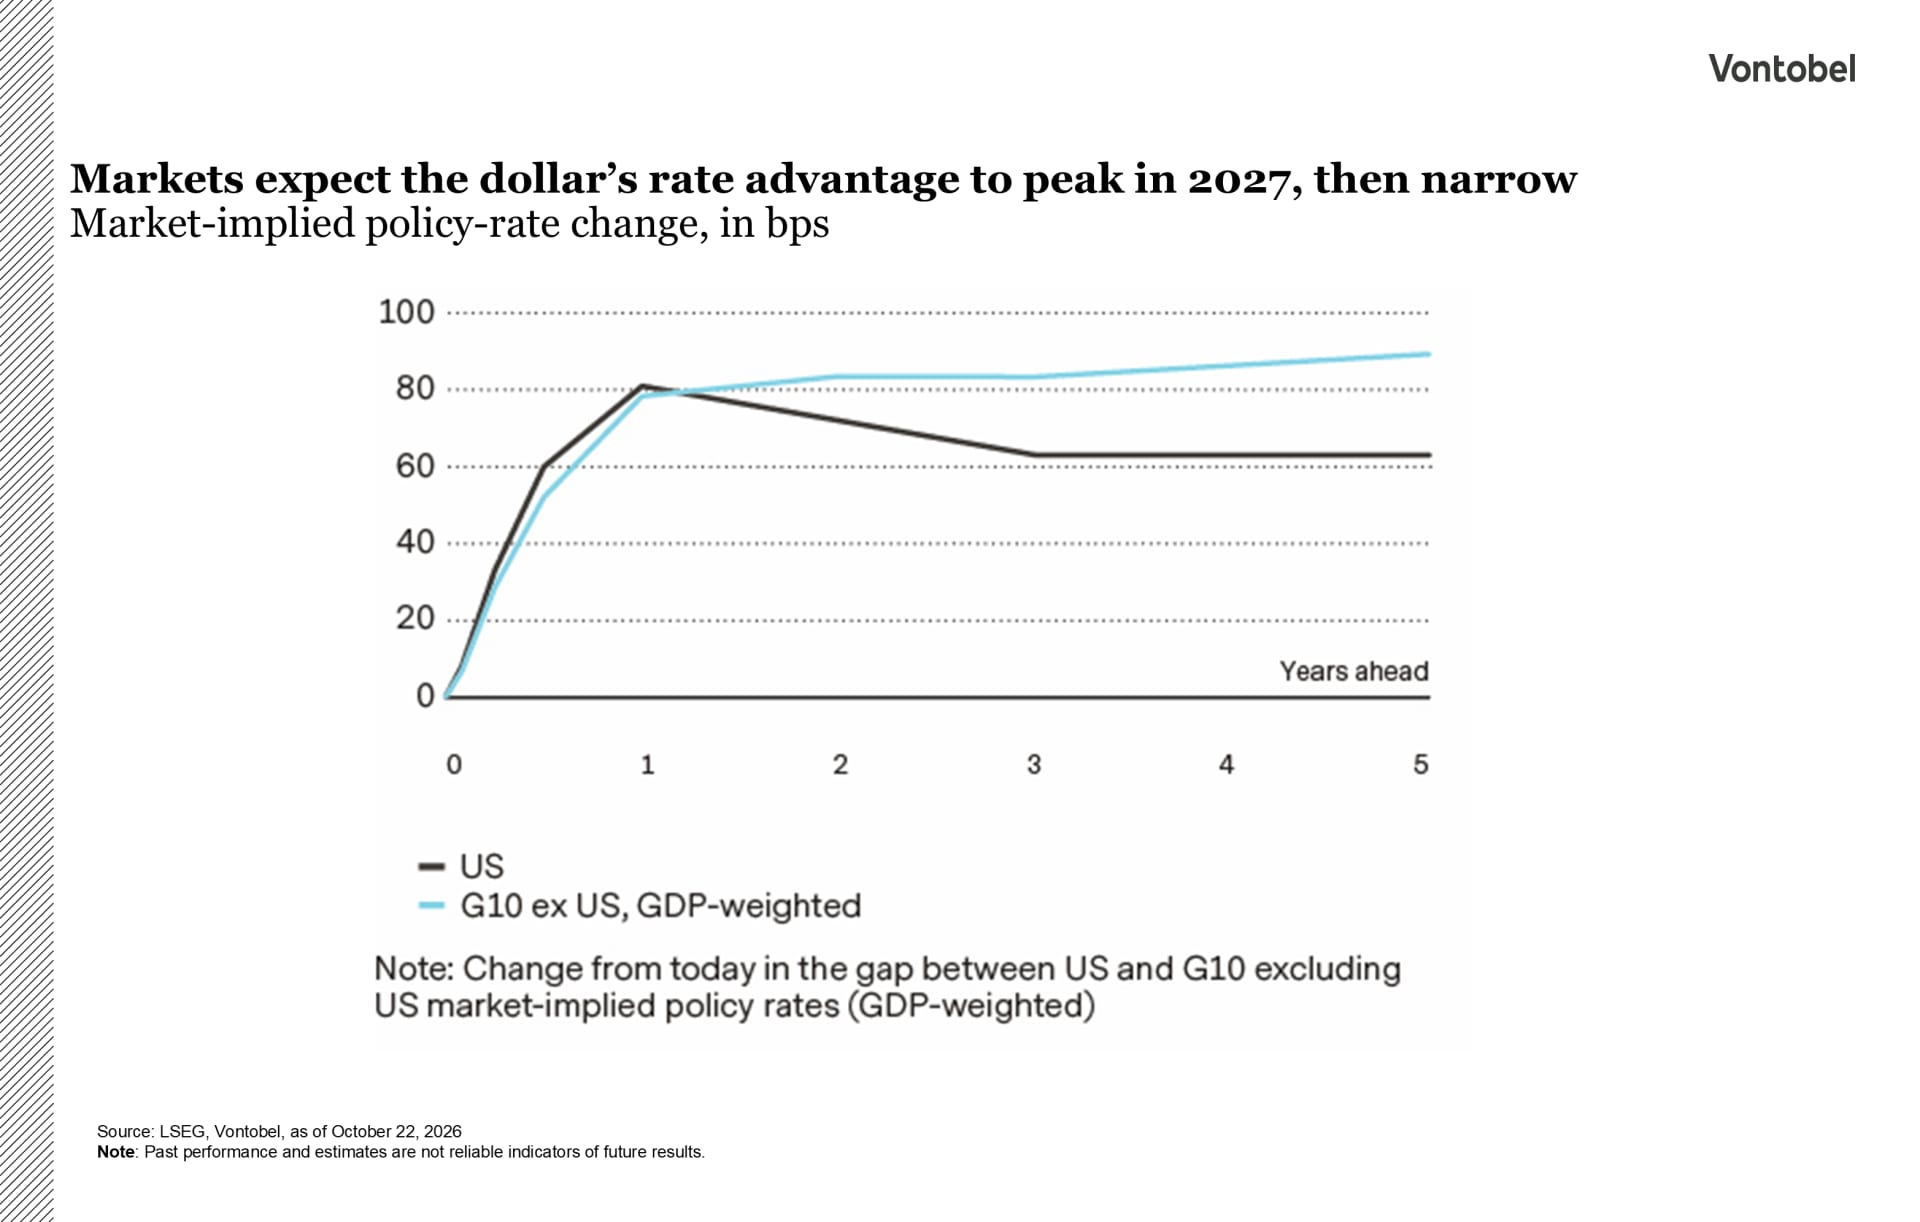
The dollar has benefited from the Fed’s hawkish shift, and the US Dollar Index has moved back toward the upper end of its range since mid-2025. This looks like a rates-driven bounce rather than the start of a new uptrend. Markets now price in rate hikes across the G10 currencies, and US hikes are expected earlier, so the dollar’s rate advantage is expected to peak in the first half of 2027 and narrow after that. Large fiscal deficits and a weak external position remain medium-term head-winds. Geopolitics is likely the main risk, as it could revive safe-haven demand.
As for the Swiss franc, it has given back part of its gains against the dollar but has firmed against the euro as French stress led investors to seek safety. With the Swiss National Bank (SNB) policy rate at zero and in no rush to raise it, the yield gap is likely to cap further gains, and the SNB would probably counter renewed strength.