Higher energy costs are pushing up US rates

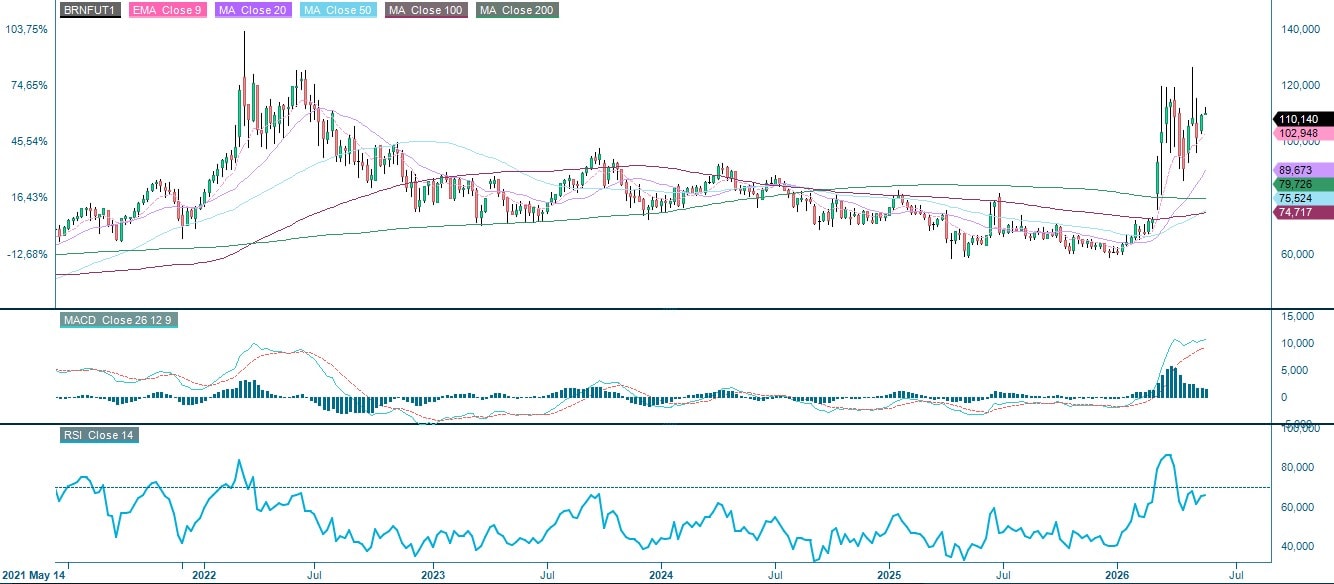
President Trump is sending mixed signals to the market about the direction of the war with Iran, and, consequently, the price of Brent oil. Although the U.S. escorted neutral ships through the Strait of Hormuz, Trump has warned Iran that the deadline for negotiations is approaching. Following the US-China summit this past weekend, there is also hope that China will mediate the conflict. Higher energy prices contributed to the increase in the U.S. Producer Price Index in April, which is, in turn, driving up U.S. interest rates.
Brent futures (in USD/barrel), one-year daily chart

Brent futures (in USD/barrel), five-year weekly chart
Mini Futures auf den Brent Crude Oil Future
Macro comments
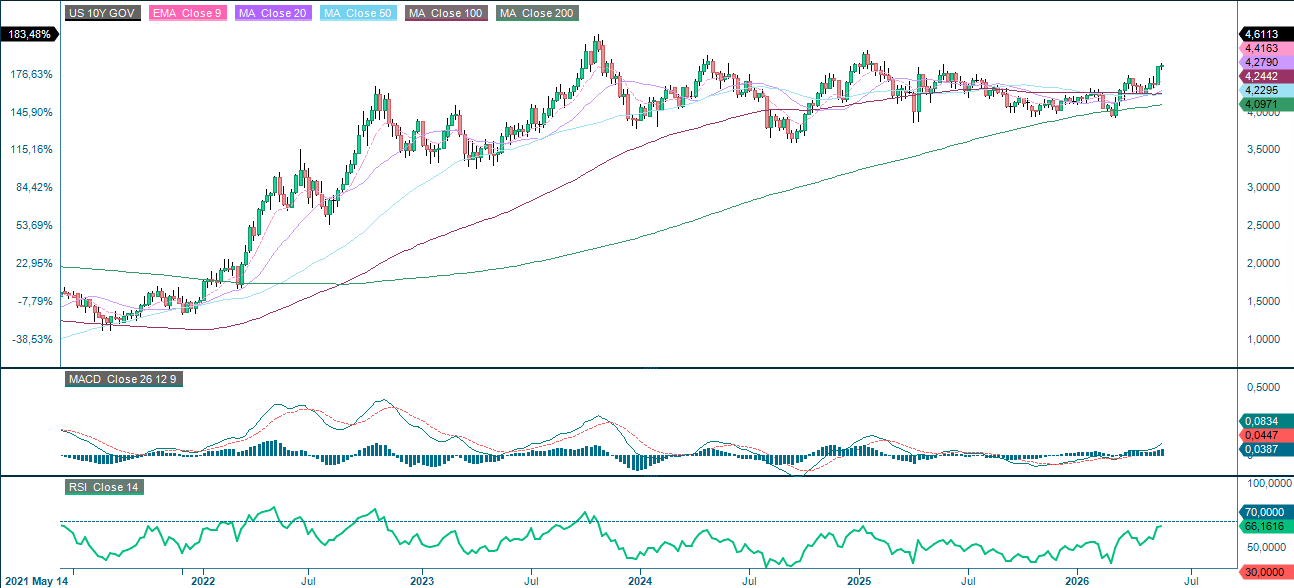
In April 2026, the US Producer Price Index was 1.4 percent on a monthly basis and 6.0 percent on an annual basis, compared to expectations of 0.5 percent and 4.9 percent, respectively. The majority of this increase can be attributed to higher energy prices. On Friday, May 15, the US ten-year Treasury yield increased by 13 basis points, rising from 4.45 percent to 4.58 percent (see graph below). Rising interest rates pose a risk to S&P 500® and NASDAQ-100 Index® valuations.
The US 5-year Treasury yield (in %) on a five-year weekly chart
On Wednesday 20 May, the Swedish companies Addtech and BioArctic, as well as the Norwegian companies Salmar and Orkla, will release their interim reports. However, most of the world is waiting for Nvidia's results though, which are expected to be published later on Wednesday. Turning to the macro statistics, starting with the UK's producer and consumer price index figures for April, the Eurozone will also release its April consumer price index. Finally, the US will release its weekly oil inventory figures from the Department of Energy.
On Thursday 21 May, an interim report from the Swedish investment company Lundberg is expected. In the US, companies such as Deere, Take-Two and Walmart will publish their interim reports. Thursday's macroeconomic news agenda will be dominated by the purchasing managers' index for May from Japan, India, France, Germany, the Eurozone, the UK and the US. The Japanese trade balance for April will also be expected, as well as machinery orders for March. From the Eurozone, a household confidence indicator for May is expected. The UK will present its CBI industrial trends for May. In addition to the aforementioned Purchasing Managers' Index, the U.S. will release data on housing construction in April, as well as the Philadelphia Fed Index and the Kansas Manufacturing Index in May, along with initial weekly jobless claims.
On Friday, May 22, the Norwegian company Frontline is scheduled to report its interim results. The release of macro statistics begins with Japan's April consumer price index. Next are the UK's retail sales for April. Germany will release the GfK consumer confidence index for June, the GDP for the first quarter, and the Ifo index for May. The U.S. will contribute the Michigan index for May.
S&P 500® (in USD), one-year daily chart

S&P 500® (in USD), five-year weekly chart

Mini Futures auf den S&P 500® Index
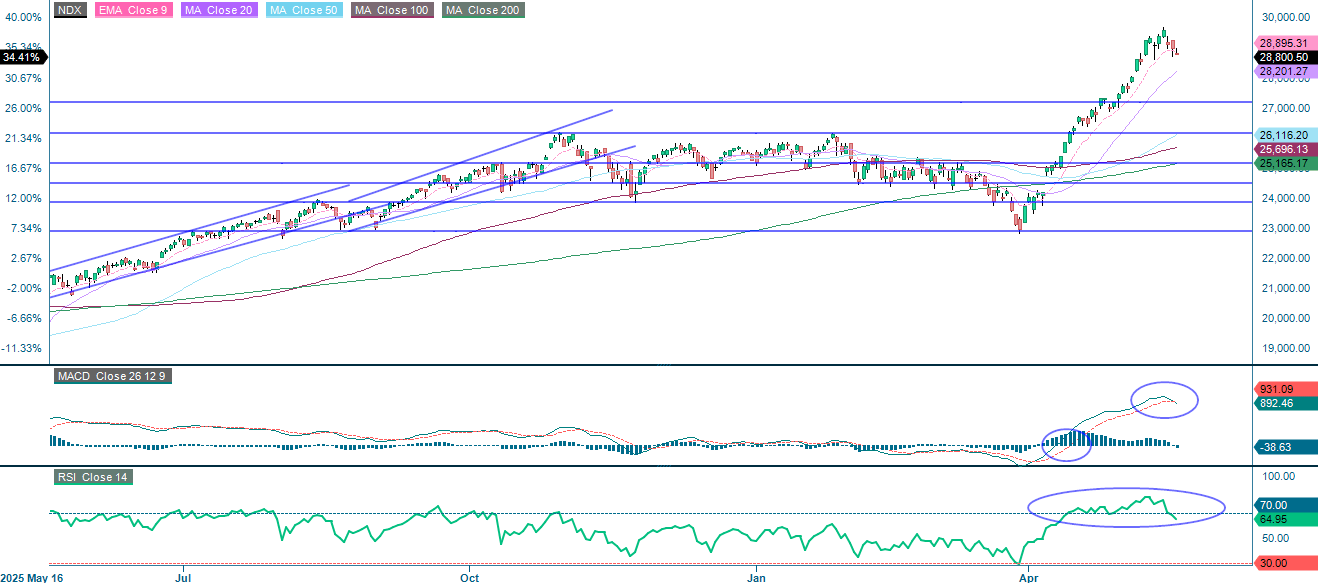
Like the S&P 500®, the NASDAQ-100 Index® is trading below its EMA9 with the MA20, which is currently at 28 201 and represents the next meaningful support level on the downside. Beyond that, 27 200 comes into focus. As always, the trajectory of U.S. yields will be a key driver of the tech-heavy index.
NASDAQ-100 Index® (in USD), one-year daily chart
Mini Futures auf den Nasdaq-100 Index®
In contrast, the German DAX® is trading erratically, with momentum close to neutral. Flash PMI data from the Eurozone and Germany, scheduled for release on May 21, could introduce short-term volatility to the index. This data could provide insight into whether the industrial slowdown is deepening or beginning to stabilize. A break above 24 660 would be encouraging and could pave the way to 25 300. On the downside, slipping below 24 000 would bring the MA50, currently at 23 746, into focus. The next meaningful support level is around 23 365.
DAX® (in EUR), one-year daily chart

DAX® (in EUR), five-year weekly chart

The full name for abbreviations used in the previous text:
EMA 9: 9-day exponential moving average
Fibonacci: There are several Fibonacci lines used in technical analysis. Fibonacci numbers are a sequence in which each successive number is the sum of the two previous numbers.
MA20: 20-day moving average
MA50: 50-day moving average
MA100: 100-day moving average
MA200: 200-day moving average
MACD: Moving average convergence/divergence
External author:
This information is the sole responsibility of the guest author and does not necessarily represent the opinion of Bank Vontobel AG or any other company of the Vontobel Group. The further development of the index or a company and its share price depends on a large number of company-, group- and sector-specific as well as economic factors. Every investor must take the risk of share price losses into account when making an investment decision. Please note that no current income can be achieved by investing in these products.
The products are not capital-protected; in the worst case, a total loss of the capital invested is possible. In the event of insolvency of the issuer and the guarantor, the investor bears the risk of a total loss of his investment. In any case, investors should note that past performance and/or analysts' opinions are not a sufficient indicator of future performance. The performance of the underlying assets depends on a variety of economic, corporate and political factors that should be taken into account when forming a market expectation.