How long will the conflict last?

This week, the question arises as to how long President Trump will continue the war against Iran. East Asian economies are more sensitive to high oil prices than those in Europe and the US. Therefore, a short war could probably benefit the Nikkei index the most.
Case of the week: According to Trump, there will soon be peace trade
On February 28, the United States and Israel launched a joint military offensive against Iran, during which the Supreme Leader, Ayatollah Ali Khamenei, was killed. Mojtaba Khamenei, the son of the slain Supreme Leader, was appointed as his father's successor. Iran's military and political leadership quickly swore allegiance to the new Supreme Leader. The hardliners took to the streets to demonstrate their power. Since then, Iran has launched its first wave of missile attacks under his command.
At the beginning of the conflict, President Donald Trump said the war would last four to five weeks. However, he has since stated that the US is "way ahead" of this estimated timeframe. Trump also said, "I think the war is pretty much over" and "They have no navy, no communications, no air force" Conversely, Iran has insisted that it is prepared for a prolonged conflict and sees no room for diplomacy.
Trump should ask himself if the U.S. military is prepared for a long war. During the presidential campaign, he promised his supporters that he would not involve the military in long wars abroad. Entering a long war would break that promise and increase the likelihood of the Republicans losing the US midterm elections in November 2026. After that, Trump would be a "lame duck" for the rest of his term.
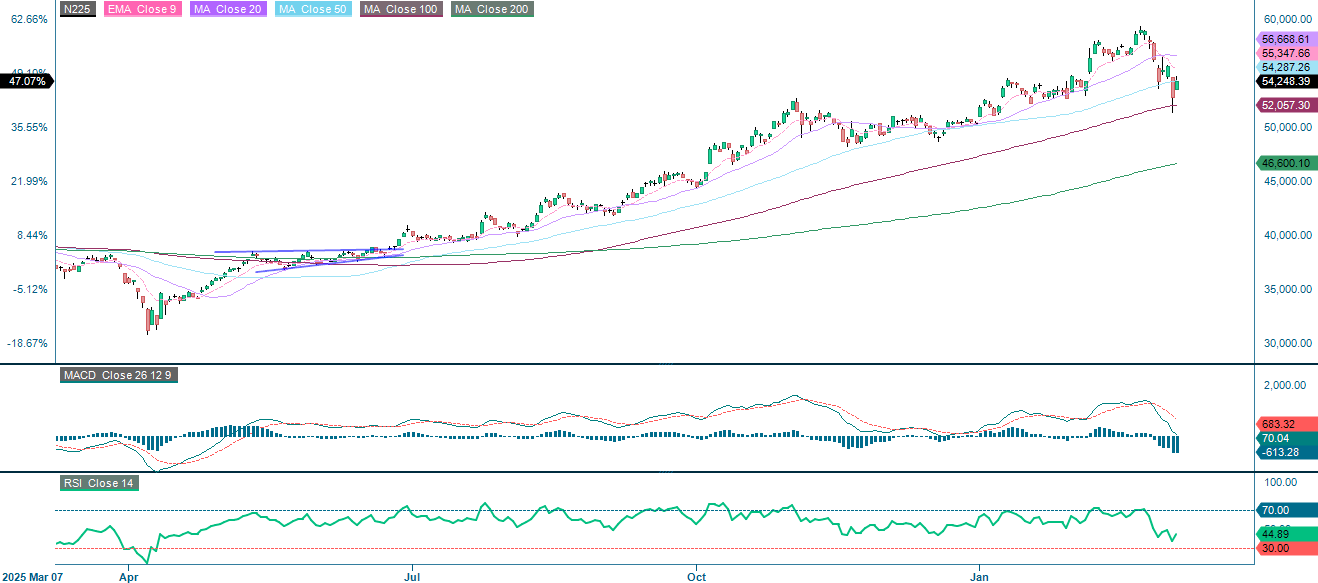
Since the outbreak of hostilities, oil prices have risen dramatically worldwide. Japan is the biggest loser of the war, as the country imports around 95% of its oil from the Middle East, of which around 70% flows through the Strait of Hormuz. Since February 27, the Nikkei 225 has fallen 8.1 percent, while the Dow Jones Industrial Average is down 2 percent. A ceasefire, the release of strategic oil reserves by the G7 (to be discussed this week) or intervention by the Bank of Japan to stabilize the markets could bring about a turnaround. If the war only lasted four to five weeks, the Nikkei would probably outperform other equity indices during the recovery phase. The potential reward is high, but the uncertainty and risk are also high.
Mini Futures on the Nikkei 225 Index
Nikkei 225 Index (in JPY), one-year daily chart
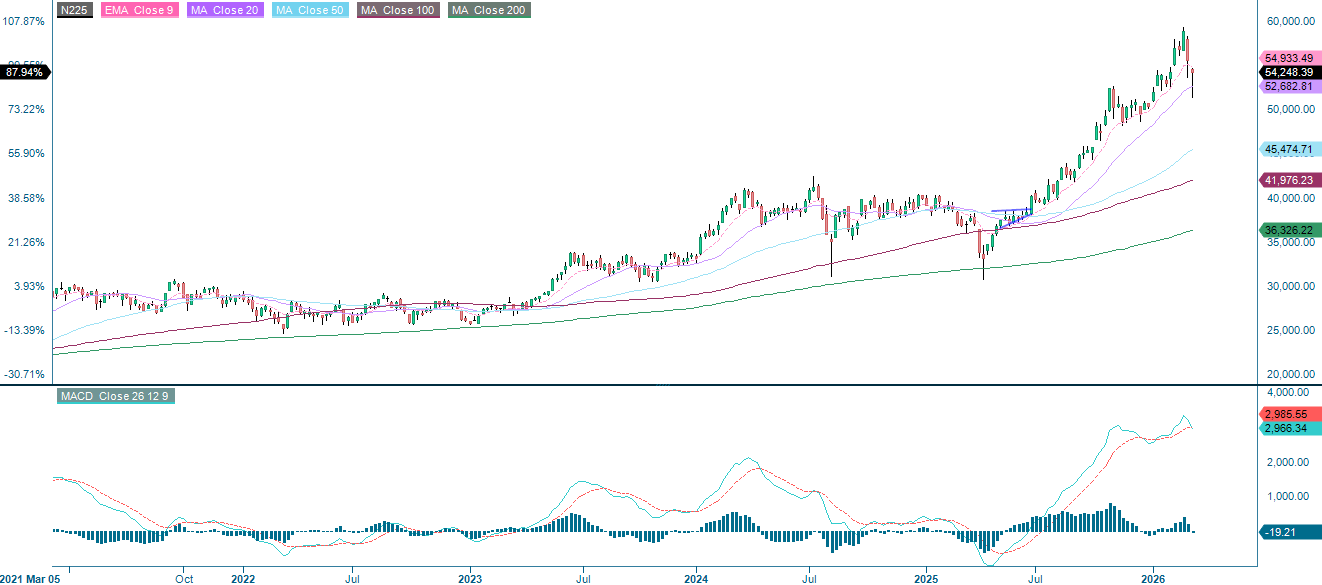
Nikkei 225 Index (in JPY), five-year daily chart
Macro comments
Stock markets around the world were very volatile last week, with rising oil prices causing investors the most concern. This concerns both the increased transportation costs for companies and the inflationary impulses that can drive up market interest rates. The US stock market indices were less affected, while the Asian and European indices were hit hard. This is because Asian and European countries are more sensitive to higher oil prices and disruptions in global trade.
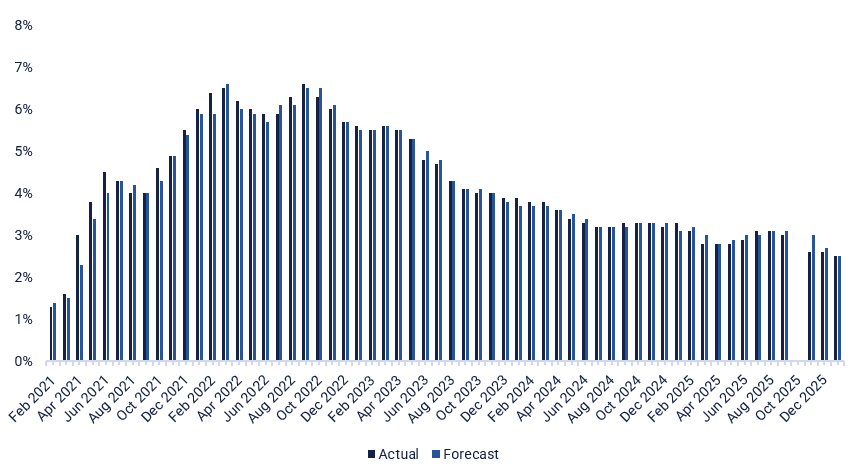
On Wednesday, March 11, interim reports from Clas Ohlson, Inditex, Klöckner and Rheinmetall are expected. Macro data will start with the Japanese producer price index for February. This will be followed by the consumer price indices for February in Germany and the USA (see chart below). The US Department of Energy will publish the weekly oil inventory statistics. OPEC will also publish a monthly oil report.
On Thursday, March 12, the interim reports of Danish company Bavarian Nordic, German companies BMW, Daimler Truck and Zalando as well as Deutsche Bank will be published. In terms of macroeconomic news, the Swedish consumer price index (CPI) for February will be published. The IEA will present a monthly oil report. From the US, data on housing starts and the goods trade balance in January will be published, as well as the weekly initial jobless claims.
On Friday, March 13, UK GDP and industrial production for January will be published first, followed by German wholesale prices for February. This will be followed by the CPI figures for France and Spain for February and the Eurozone industrial production for January. Finally, the US will publish macroeconomic data on personal consumption and inflation in January (PCE), durable goods orders and JOLTS jobs. The Michigan index for March will also be published.
US Core Consumer Price Index (Core CPI), five-year monthly chart
Hope for better times leads to greater gains for European indices
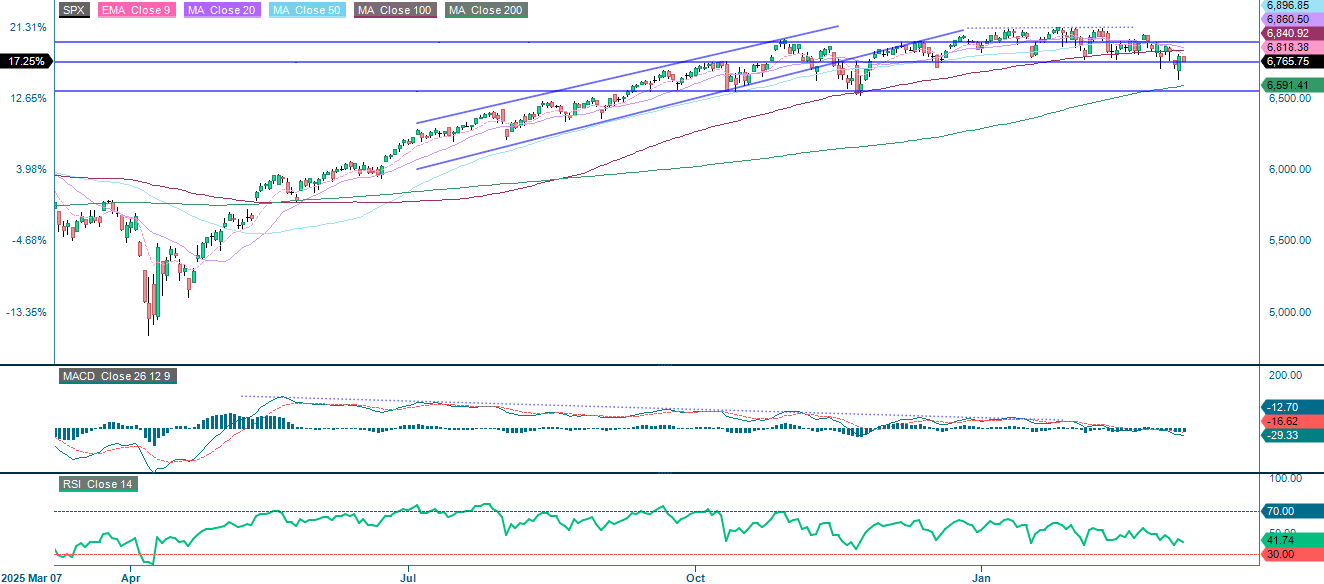
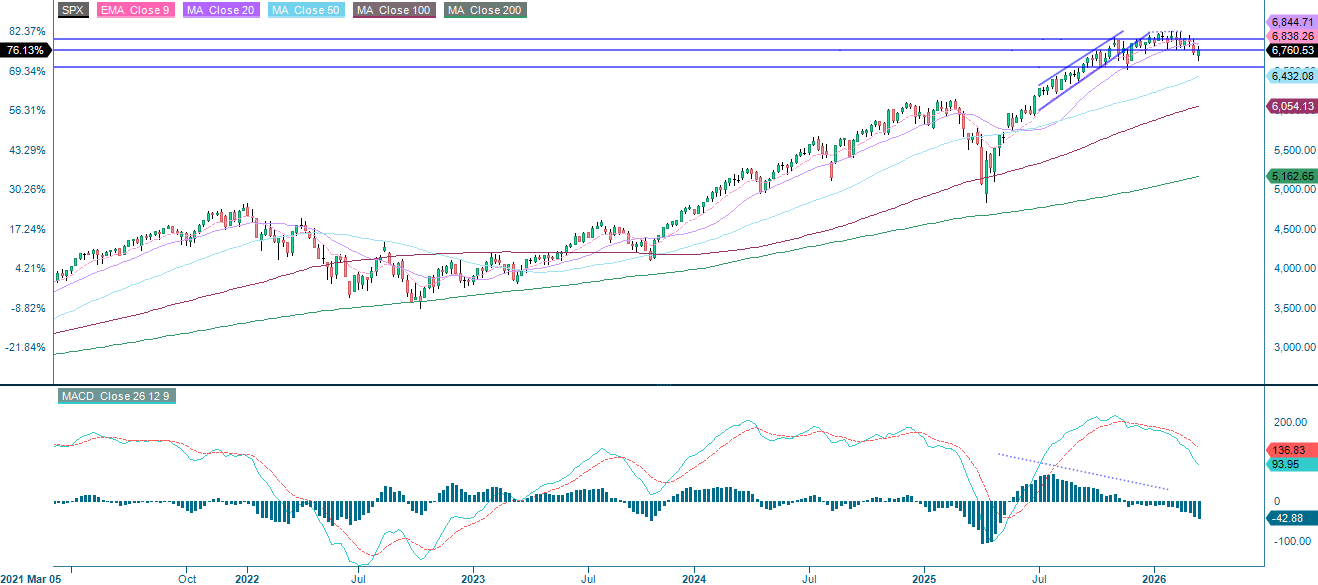
The US and Israeli military operation against Iran, which began around February 27, drove oil prices to over USD 110 per barrel by the middle of the week. This triggered widespread risk-off flows due to renewed inflation concerns. On Monday, March 9, Trump's comments triggered a sharp reversal within a day. As the chart below shows, the S&P 500® is currently trading below its EMA9 of 6181. The next resistance lies in the area between 6840 and 6861, followed by 6900. On the downside, a first support is in the area of 6760, followed by the MA200 at 6591. In the short term, headlines from the Middle East and signals from the G7 regarding a coordinated release of strategic oil reserves are likely to be the main catalysts for global equities.
Mini Futures on the S&P 500® Index
S&P 500® (in USD), one-year daily chart
S&P 500® (in USD), five-year weekly chart
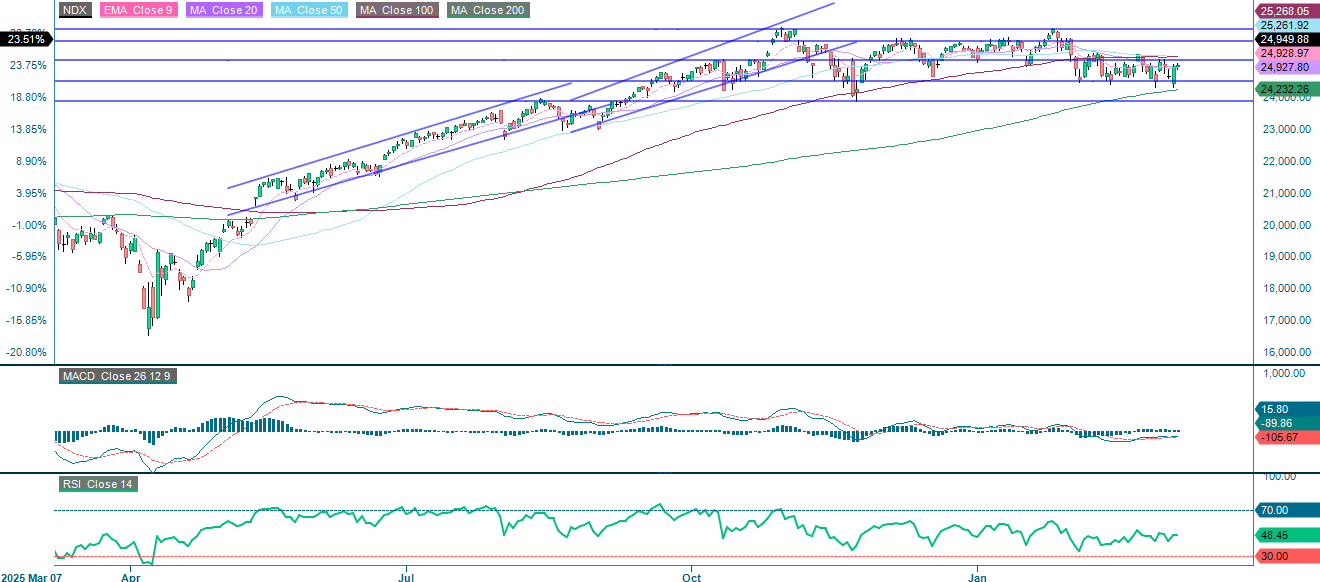
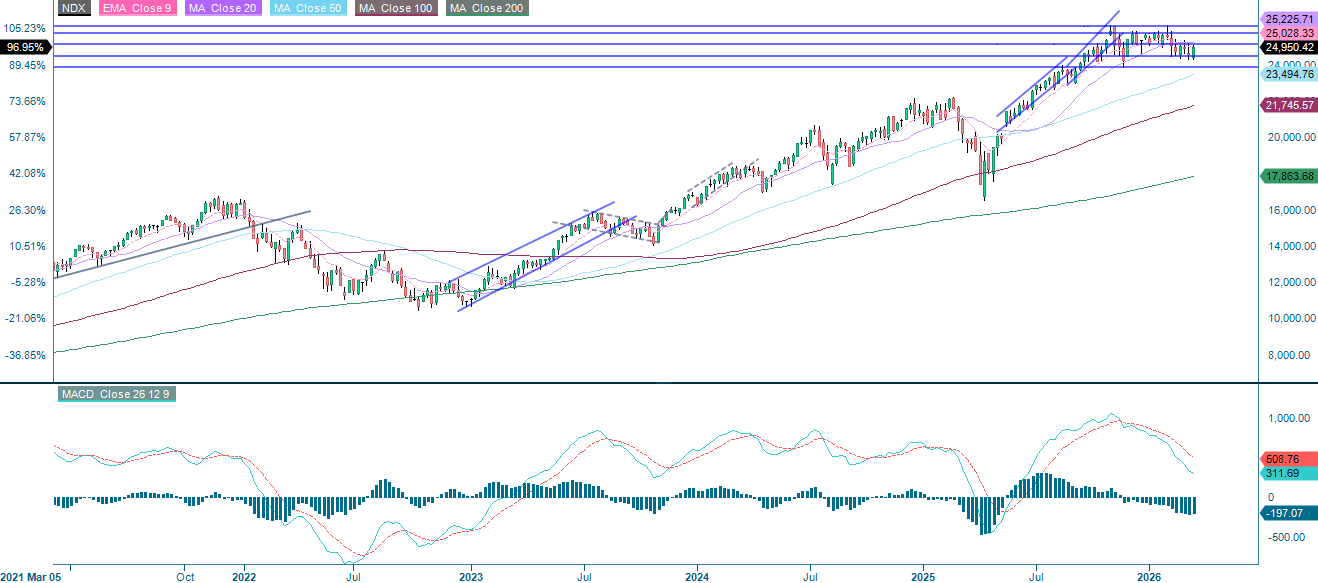
Large-cap technology stocks, which dominate the Nasdaq-100 Index®, were relatively unaffected by the Iran conflict as they have little direct exposure to the energy sector. The trading range of 24 500-25 150 remains intact. An upside breakout would target the MA50/MA100, followed by 25 745. A downside breakout would open the door to the MA200 at 24 232 and then to 23 865.
Mini Futures on the Nasdaq-100 Index®
Nasdaq-100 Index® (in USD), one-year daily chart
Nasdaq-100 Index® (in USD), five-year weekly chart
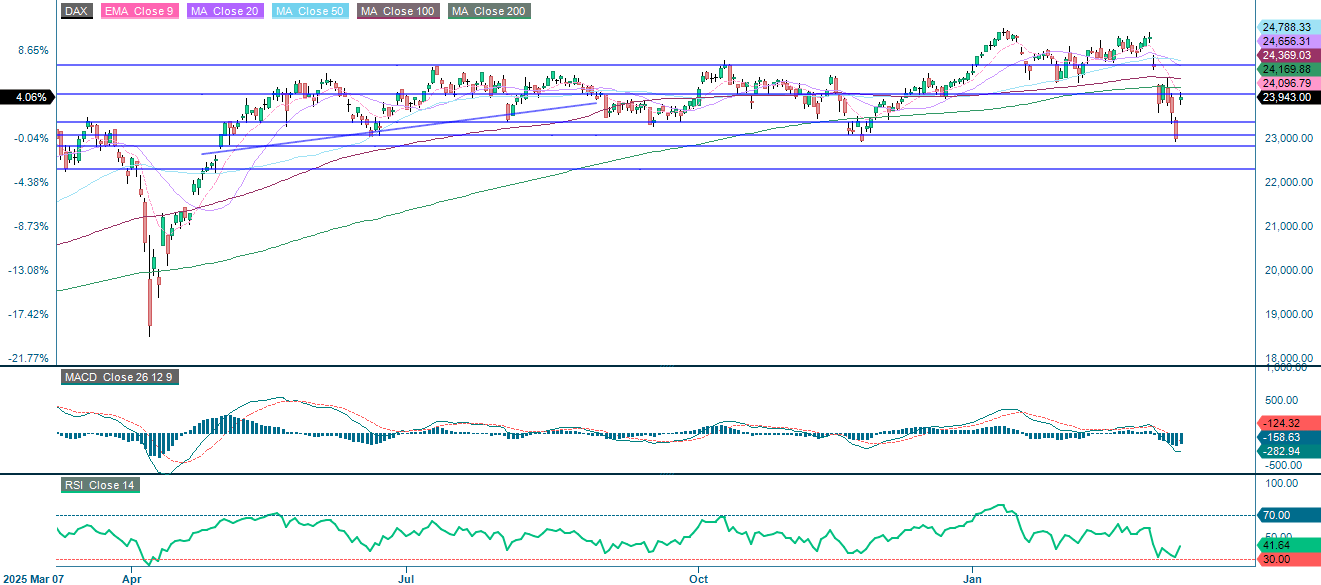
German industry has been hit harder than the Dow Jones Industrial Average due to its heavy dependence on energy costs. Nevertheless, the index has risen by 2.3% in response to the latest headlines on Iran and oil. This illustrates the higher beta of European indices to changes in oil prices and geopolitical sentiment.
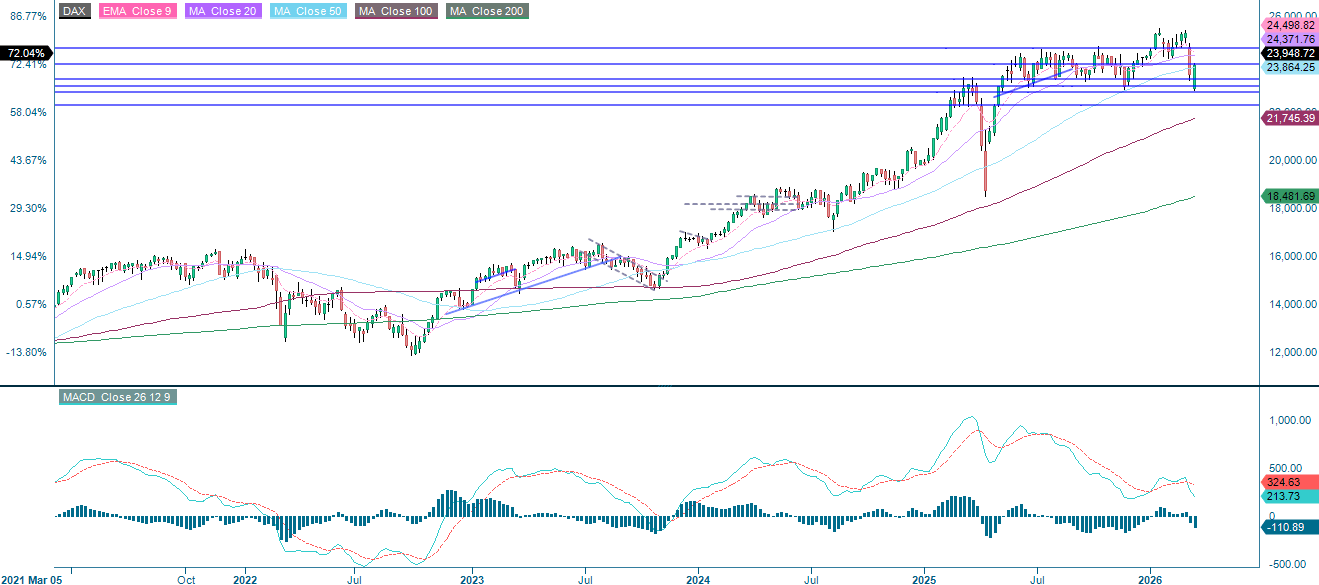
As the chart below shows, the DAX remains below the 24,000 resistance level. Above it, the next hurdles are the MA200, followed by the MA100 and 24,665. On the downside, there is reasonably solid support at 23,365 points.
DAX® (in EUR), one-year daily chart
DAX® (in EUR), five-year weekly chart
Mini futures on the DAX®
The full name for the abbreviations used in the previous text:
EMA 9: 9-day exponential moving average
Fibonacci: There are several Fibonacci lines used in technical analysis. The Fibonacci numbers are a sequence in which each subsequent number is the sum of the two previous numbers.
MA20: 20-day moving average
MA50: 50-day moving average
MA100: 100-day moving average
MA200: 200-day moving average
MACD: Convergence/divergence of the moving average
External author:
This information is the sole responsibility of the guest author and does not necessarily represent the opinion of Bank Vontobel AG or any other company of the Vontobel Group. The further development of the index or a company and its share price depends on a large number of company-, group- and sector-specific as well as economic factors. Every investor must take the risk of share price losses into account when making an investment decision. Please note that no current income can be achieved by investing in these products.
The products are not capital-protected; in the worst case, a total loss of the capital invested is possible. In the event of insolvency of the issuer and the guarantor, the investor bears the risk of a total loss of his investment. In any case, investors should note that past performance and/or analysts' opinions are not a sufficient indicator of future performance. The performance of the underlying assets depends on a variety of economic, corporate and political factors that should be taken into account when forming a market expectation.