Higher inflation following the war with Iran?

The interest rate on ten-year U.S. government bonds has increased somewhat, though not by much. This is due to the continued rise in U.S. government debt, the inflationary effects of tariffs imposed by President Trump, and the US-Israeli military attack on Iran, all of which has caused higher oil prices. However, concerns about credit have been more closely linked to corporate bonds in the U.S. tech sector.
Case of the week: US interest rates are in a tug-of-war
Despite concerns about inflation, attacks by the White House on Federal Reserve policies, growing US government debt, and trade wars, the market for US Treasuries has remained relatively quiet recently. So far, there are few tangible signs of a "Trump premium," meaning investors are not demanding higher yields for owning US government debt. In fact, Treasury yields are lower now than when President Trump was inaugurated for his second term in January 2025.
A growing concern in 2026 is the state of corporate credit in the technology sector. According to The Economist, the significant increase in AI-related capital expenditures, coupled with the potential threat that AI poses to the business models of many tech companies, has likely contributed to the widening of credit spreads for tech bonds versus US Treasuries. Turbulence in corporate borrowing markets could prevent an increase in Treasury yields.
Meanwhile, US inflation remains elevated, surpassing the central bank's target. This weakens the case for further rate cuts by the Federal Reserve. Key factors to watch regarding interest rates include the labor market and energy prices. The US-Israeli attack on Iran could exacerbate inflation if it results in prolonged disturbances to the global oil supply, such as reduced Iranian oil production or a de facto closure of oil tanker transit through the Strait of Hormuz. Although the US labor market has weakened, which could initially be viewed as disinflationary, some of the weakness stems from deportations, which are arguably inflationary.
The U.S. 10-year Treasury yield has fallen to around four percent. This level has been a turning point for higher yields over the past year. At this level, bonds appear somewhat overbought, suggesting the potential for the yield to rebound.This indicates that it may be time to sell bonds. Conversely, if the yield breaks decisively down from the 3.9 to 4 percent range, one could argue that a trend toward lower rates has been established, which would push bond prices higher.
Mini Futures on 10-Year US Treasury Note Future
US 10-year yield, one-year daily chart

US 10-year yield, five-year weekly chart

Macro comments
The US-Israeli military attack that began on Saturday, February 28, appears to be escalating. Since February 27, the Brent crude oil price has increased by about 9 USD per barrel, up from around 73 USD per barrel that Friday. If these levels persist, they will obviously have an inflationary effect on the US and European economies. Trade routes via the Strait of Hormuz and flights from Asia to Europe have already been affected as well.
On Wednesday, March 4, Bayer,Continental, Mercedes-Benz and Traton will release their interim reports. In terms of macroeconomic news, the day will be dominated by February's PMI figures for the services sector from Japan, China, Sweden, Spain, Italy, France, Germany, the Eurozone, the United Kingdom, and the United States. China will also release its manufacturing PMI figures. The Eurozone will release January's unemployment and producer price index figures. The U.S. will contribute ADP private employment figures for February and weekly oil stock statistics from the Department of Energy.
On Thursday, March 5, interim reports from the Swedish company Elekta, the British company Entain, and the U.S. companies Gap and Toro are expected. In terms of macro statistics, Sweden's consumer price index for February and France's industrial production for January will be released. The U.S. will provide statistics on Challenger job cuts for February, import prices for January, productivity for the fourth quarter, and initial weekly jobless claims.
The release of macro statistics begins on Friday, March 6, with South Korea's February Consumer Price Index. This will be followed by Germany's January industrial orders and the Eurozone's Q4 GDP. This afternoon, the U.S. will release its nonfarm payroll report for February. It is expected that 70,000 new jobs were added in February 2026, compared to the 172,000 jobs added in January. Statistics on U.S. business inventories will be also received in December.
U.S. Private Nonfarm Payrolls (Number of New Jobs) , five-year monthly chart

Do geopolitical tensions have short-lived effects on equities?
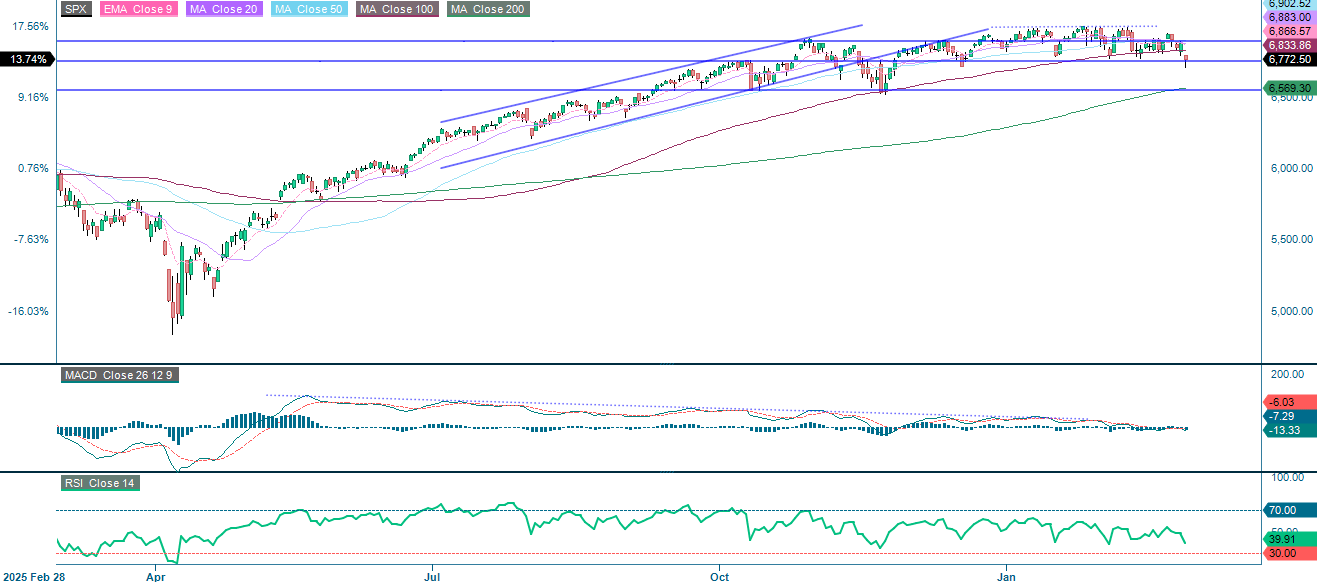
Nvidia's interim report turned out to be a "sell the news" event, adding to the pressure caused by rising geopolitical tensions. The S&P 500® is under pressure. As the chart below shows, the index is clinging to support around 5,750. A clean break below this level could open the door to the MA200, which is currently at 5,569. However, intraday price action has been volatile, and geopolitical flare-ups, including those resulting from higher oil prices, tend to be short-lived. On the upside, the first level of resistance is the MA100 (5,833), followed by 5,900. Key catalysts from here include Friday's U.S. nonfarm payrolls report, escalation or de-escalation of the conflict in Iran, and oil price direction.
Mini Futures on S&P 500®
S&P 500® (in USD), one-year daily chart
S&P 500® (in USD), five-year weekly chart

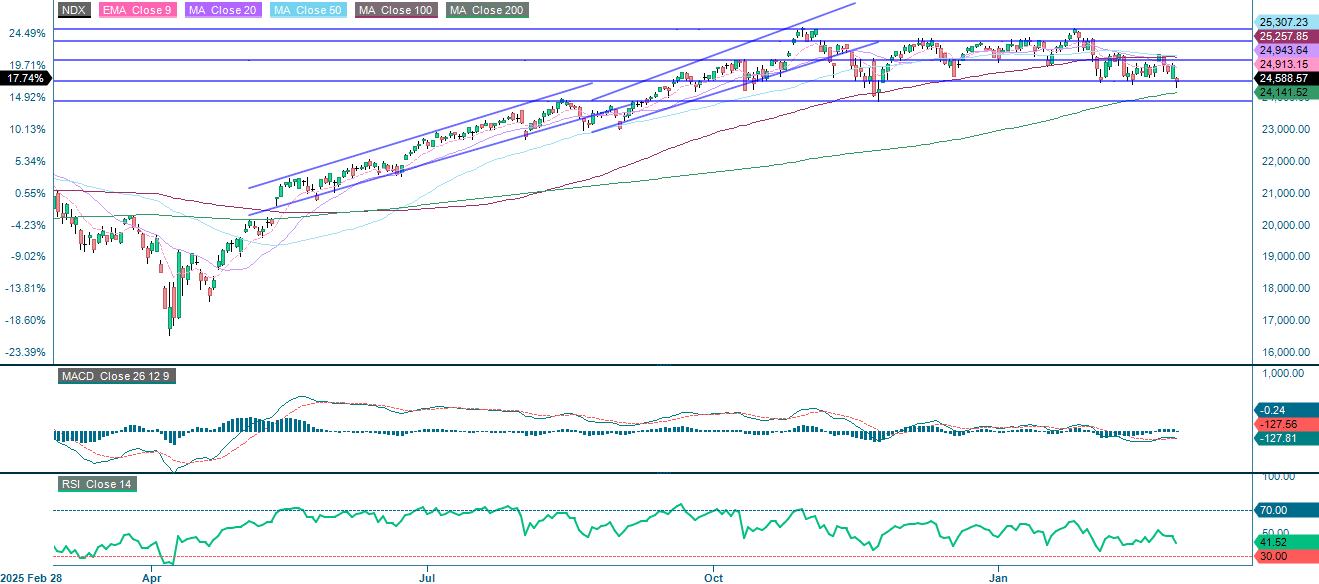
Like the S&P 500®, the NASDAQ-100 Index® is holding onto support at around 24,500. The next level to watch below that is the MA200 at 24,142, followed by the 23,900 area. On the upside, the first level of resistance sits around 25,150.
Mini Future on Nasdaq-100 Index®
NASDAQ-100 Index® (in USD), one-year daily chart
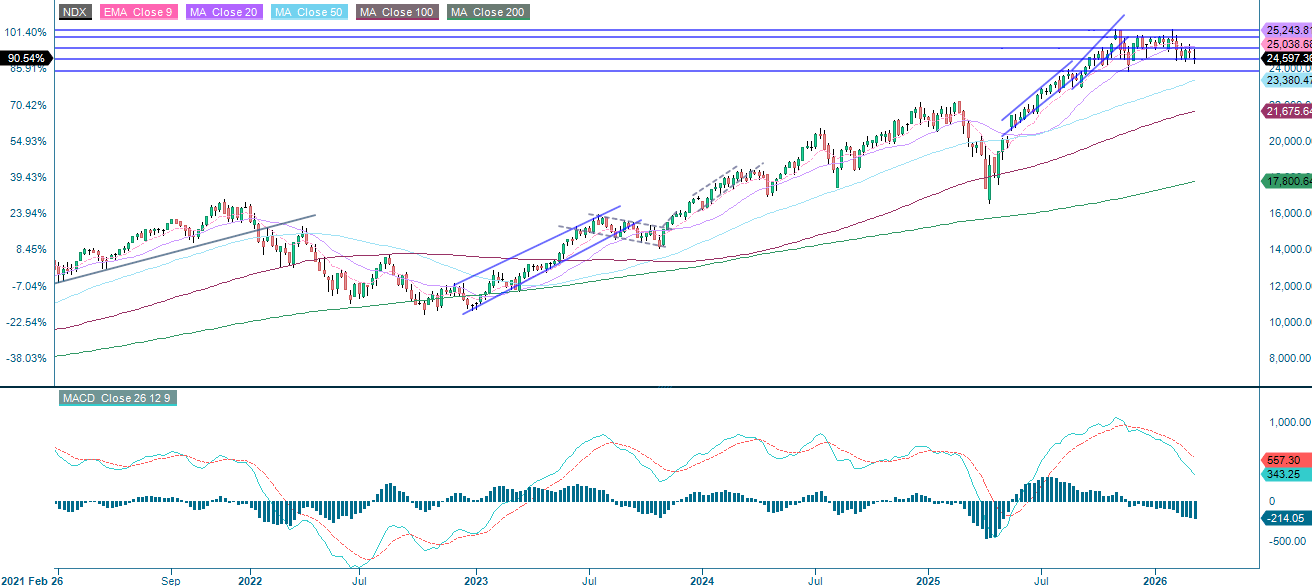
NASDAQ-100 Index® (in USD), five-year weekly chart
The DAX is not happy. It is trading below the MA200, which is currently at 24,175. Meanwhile, support is found at the level between 22,825 and 23,365.
Mini Future on DAX®
DAX® (in EUR), one-year daily chart

DAX® (in EUR), five-year weekly chart

The full name for abbreviations used in the previous text:
EMA 9: 9-Day Exponential Moving Average
Fibonacci: There are several Fibonacci lines used in technical analysis. Fibonacci numbers are a sequence in which each successive number is the sum of the two previous numbers.
MA20: 20-Day Moving Average
MA50: 50-Day Moving Average
MA100: 100-Day Moving Average
MA200: 200-Day Moving Average
MACD: Moving Average Convergence Divergence