Uncertainty about tariffs remains

The U.S. Supreme Court's rejection of President Trump's tariffs, followed by Trump's imposition of new, higher tariffs, has created ongoing uncertainty for companies and stock markets. Meanwhile, the Japanese Nikkei index has shown a strong trend over the past six months. Given the ruling Liberal Democratic Party's victory in the February parliamentary elections and the fact that its main export partners in Asia benefit from the most recent tariff decision the Japanese yen seems to strengthen against the U.S. dollar.
Case of the week: The sun rises in the east
On Friday, February 20, the U.S. Supreme Court invalidated the tariffs imposed by President Trump on other countries since April 2025, ruling that these tariffs were unconstitutional because they were imposed by presidential order without congressional approval. Following the U.S. Supreme Court's ruling, it seems that China, India, and Brazil seem to be the biggest winners in terms of tariffs and trade. This is because the U.S. previously imposed higher tariffs on these countries.
Trump's unpredictable changes to tariff decisions since April 2025 have prompted global investors to reduce their asset exposure to the United States and the U.S. dollar. This has also encouraged the European Union to enter into a trade agreement with India, which had the fourth-largest economy in 2026.
As the performance chart below of major stock indices below illustrates that the Nikkei index in Japan has performed well, while U.S. stock indices, except for the Russell 2000, have underperformed the Dow Jones World Index. The Nikkei index surged after the Liberal Democratic Party (LDP), led by Sanae Takaichi, won a landslide victory in Japan's parliamentary elections on February 8, 2026. Since its fouding in 1955, the LDP has led Japan almost constantly since then and increased its share of seats from 41 percent before the election to 68 percent after.
Year-to-date (YTD), six-months and five-year performance of world equity indices, ranked by six-month performance

Japan's economy is the fifth-largest in the world, and its domestic market is the fourth-largest consumer market. Historically, Japan's industrial sector had a significant export surplus, though its importance has declined in recent years. The Japanese economy faces several challenges, including an aging population and a substantial national debt. Japan's top export destinations are China (about 23% of total exports), the United States (about 18%), Association of Southeast Asian Nations (ASEAN) countries in Southeast Asia (about 14%), the EU (about 9%), Taiwan (about 7%), and South Korea (about 6%). Thus, just over half of Japan's exports go to Asia, a favorable trend given the current economic conditions. Historically, a weak USD (which has fallen 11% against the euro in the past year) has been favorable for economic growth in emerging countries.
The Japanese yen has been weak in recent years, particularly against the U.S. dollar. However, since mid-January 2026, the yen has strengthened somewhat against the dollar. Given that capital and trade flows are expected to favour Japan more than before, we believe there is a good chance the yen will continue to strengthen against the USD.
USD/JPY, one-year daily chart

USD/JPY, five-year weekly chart

Mini Futures on JPY per 1 USD
Macro comments
The likelihood of a U.S. attack on Iran is growing. It is estimated that 40 to 50 percent of the U.S. Air Force's global deployable capacity has been gathered in the Middle East. The U.S. has begun evacuating Americans from military bases in Bahrain and Qatar, both of which are near Iran. Brent Oil was up around 4 USD per barrel during the last week. About 25 percent of the global oil supply currently passes through the Strait of Hormuz, which Iran could block if the U.S. in the vent of a U.S. attack.
Brent Oil (USD per barrel), five-year monthly chart

Reports
Bayer, HSBC, and Nvidia are scheduled to release their interim reports on Wednesday, February 25. In macroeconomic news, Sweden's Producer Price Index for January will be released. This will be followed by Germany's consumer confidence index for March and its Q4 GDP. France will also publish a household confidence indicator for February. Additionally, the Eurozone will release its consumer price index figure for January. The US will release weekly oil inventory figures from the Department of Energy. Additionally, President Trump will also deliver his State of the Union address.
U.S. companies scheduled to publish their interim reports on Thursday, October 26, include Dell Technologies and Intuit. Thursday's macroeconomic news begins with the release of business climate barometers for February from Sweden and Germany. From the U.S., we will receive weekly jobless claims data and the Kansas City Fed index.
On Friday, February 27, International Airlines Group (IAG) will release an interim report. In macroeconomic news, Japan's January industrial production and retail sales will be released first. Next will be Sweden's January trade balance and Q4 GDP. France, Germany, and Spain will present their February CPI figures. We will also receive France's and India's Q4 GDP figures, as well as Germany's February unemployment figures. A Eurozone household survey on inflation expectations is also anticipated. Canada will present its Q4 GDP, and the U.S. will present its January producer price index, February Chicago Purchasing Managers' Index, and December construction spending figures.
Will Nvidia scare off the bears?
On Monday, the S&P 500 experienced significant volatility, driven by fears of AI disruption and tariff uncertainty, leading to a sharp sell-off. Nevertheless, the 100-day MA support remains intact. The setup skews to the downside, as illustrated by MACD, as momentum is negative and fading. However, RSI is in neutral territory. The next level of support is around 6700, followed by the MA200 at 6542. However, it is important to monitor Nvidia's Q4 report, scheduled for Wednesday after the US market closes, as this could alter the short-term outlook.. This could alter the short-term outlook.
Mini Futures on the S&P 500® Index
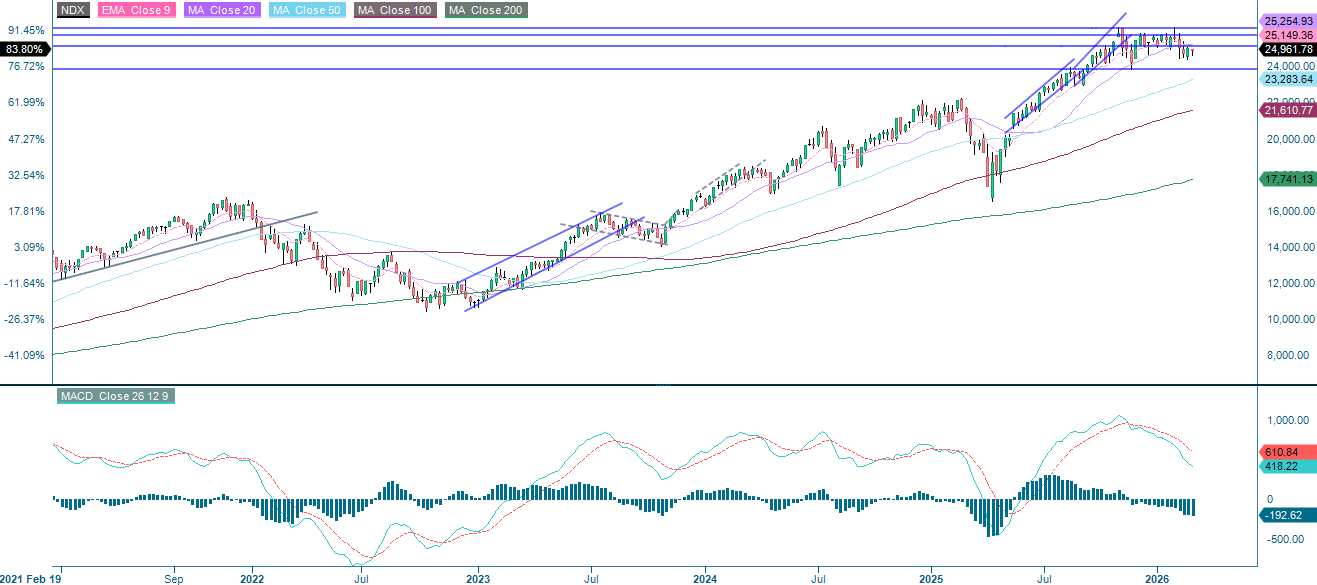
The AI disruption narrative is still very much in play. For now, the Nasdaq-100 Index® is holding above the 24 500 support level. If it falls below that level, the next obvious target will be the MA200 at 24 035 will become the next obvious target. As previously mentioned, Nvidia is the key name to watch here.
Nasdaq-100 Index® (in USD), one-year daily chart

Nasdaq-100 Index® (in USD), five-year weekly chart
Mini Future on the Nasdaq-100 Index®
The DAX® is moving back toward the MA20, which is the first level of support. Continued euro strength could make 24 665 an important level. Below that, a downward break opens the MA100 at 24 370 as the next downside target.
Mini Futures on DAX®
The full name for abbreviations used in the previous text:
EMA 9: 9-Day Exponential Moving Average
Fibonacci: There are several Fibonacci lines used in technical analysis. Fibonacci numbers are a sequence in which each successive number is the sum of the two previous numbers.
MA20: 20-Day Moving Average
MA50: 50-Day Moving Average
MA100: 100-Day Moving Average
MA200: 200-Day Moving Average
MACD: Moving Average Convergence/Divergence
External Author:
These information are the sole responsibility of the guest author and do not necessarily reflect the opinion of Bank Vontobel AG or any other company of the Vontobel Group. The future development of the index or a company, as well as its stock price, depends on a variety of company-, group-, and industry-specific factors, as well as economic conditions. Every investor must take the risk of price losses into account when making an investment decision. Please note that no ongoing income can be generated from investing in these products.
The products are not capital-protected, and in the worst case, a total loss of the invested capital is possible. In the event of the insolvency of the issuer and the guarantor, the investor bears the risk of a total loss of their investment. In any case, investors should note that past performance and/or analysts' opinions are not sufficient indicators of future performance. The performance of the underlying assets depends on a variety of economic, corporate, and political factors that should be considered when forming market expectations.