Investors’ Outlook: roaring times

The year begins with a bang: Geopolitical tensions in Venezuela, Iran, and the Arctic are making headlines, yet the markets remain surprisingly resilient. The S&P® 500 Index surpasses the 7,000-point mark, driven by the unrelenting boom in Artificial Intelligence (AI) and a strong earnings season. European stocks also reach new record highs before geopolitical uncertainties lead to slight pullbacks. Meanwhile, geopolitical conflicts are driving commodity prices higher, and bond markets are responding with rising yields due to global fiscal tensions. But how long can the AI boom continue to support the markets? As 2026 begins, questions about a potential overheating of the market come into focus.
Through the noise
January opened at full volume. A midnight raid in Caracas, unrest in Iran, and an icy stalemate in the Arctic dominated the headlines. Still, markets absorbed the geopolitical noise.
In the US, the S&P® 500 Index topped the 7,000-point level, buoyed by the ongoing AI boom and a strong start to the fourth-quarter earnings season. European stocks climbed to an all-time high mid-month as investors gained confidence that the region’s economy is on stable footing, retracing some of the gains after the threat of tariffs over Greenland. Commodities reacted more viscerally to the news flow. Tensions in Iran reignited oil prices, with Brent crude hitting USD 70 per barrel after last year’s 15 percent decline on oversupply concerns. Metals joined the chorus, with copper, gold, and silver all rising. Bond markets showed some strain. Yields on 10-year and 30-year US Treasuries moved higher as a sell-off in Japanese government bonds, driven by fiscal concerns, spilled over into global rates markets. The US dollar’s weakness reflected a mix of moderating US rate expectations, geopolitical risk, and a reassessment of Trump’s policies. The Multi Asset Boutique continues to believe there are more growth-oriented policies ahead, even if current headlines may suggest otherwise. History suggests US presidents tend to favor pro-growth policies in midterm election years. Liquidity conditions are also poised to improve, as the Fed has announced a return to balance-sheet expansion, which is supportive for both markets and the broader economy. Plus, the Multi Asset team doesn’t see significant inflation risks and expects more accommodative monetary policy, steady economic growth, and stable global supply chains. Elsewhere, inflation pressures look subdued, like in China and Switzerland. The latter is even grappling with deflation fears.
Could the AI euphoria run out of memory?
Investing in artificial intelligence (AI)-related stocks has been a successful strategy in recent years. Ever since OpenAI’s ChatGPT took the world by storm on November 30, 2022, hyperscalers –companies that provide massive, highly scalable cloud computing services and enable businesses to dynamically adjust resources for things like social media, AI, or online marketplaces – have been on an extraordinary upward trajectory. From late November 2022 to the end of 2025, US hyperscalers Alphabet, Amazon, Meta, Microsoft, and Oracle delivered triple- digit returns, ranging from over 100 percent to more than 500 percent. This performance was only surpassed by Nvidia, which, while not a hyperscaler, also rode the wave of the AI frenzy and achieved an eye-catching gain of more than 1,000 percent over the same period.
As we enter 2026, one could argue that the stakes for investors, and for the US economy, have rarely been higher. What is meant by that? First, the rally has pushed US equity valuations to levels not seen since the dotcom bubble burst in the late 1990s. The S&P® 500 Index’s Shiller Price-to-Earnings (P/E) ratio, widely regarded as the gold standard of equity valuation metrics, currently stands at approximately 39, just shy of its all-time high of 44 recorded in December 1999. To put things into perspective: the ratio’s long-term average is around 18.

Third, the AI spending spree has become increasingly important to US economic growth. In the first half of 2025, AI-related capital expenditures (capex) contributed
1.1 percent to the country’s gross domestic product (GDP) growth—more than consumer spending. This is an astounding feat for an economy historically driven by consumption.
Investors may therefore want to closely monitor the AI rally and remain vigilant for signs of a market bubble. To that end, the Multi Asset Boutique has developed a checklist to assess whether the rally may have run its course.
Note that not all signals need to be present to indicate a peak in the AI boom. In extreme cases, just two or three signals may be sufficient.
The first two warning signals relate directly to AI models: slowing progress and declining adoption rates. Progress in AI models is crucial for investors because it directly impacts the value, growth potential, and competitive edge of companies leveraging AI. This requires constant refinement, scalability, and adaptability. Sustained or rising adoption rates are equally important, as they reflect the relevance and value of a technology.
The 2025 Stanford AI Index Report suggests that the scale of AI models is advancing at a rapid pace. Training compute doubles every five months, datasets every eight months, and power usage every year. That said, performance gaps appear to be narrowing: the score difference between the top-ranked and 10th-ranked models fell from 11.9 percent to 5.4 percent within a year, and the top two are now separated by just 0.7 percent. In other words: the field appears to be turning both more competitive and more crowded.
Slower adoption
Adoption rates are still trending upward, though they vary by sector and company size. Data from the US Census Bureau’s Business Trends and Outlook Survey points to signs of a temporary slowdown or stabilization in 2025, particularly among large, established firms.
Another red flag to watch for is a potential pause in the growth of companies’ capex guidance. So far, each major hyperscaler has raised its capex guidance for 2026.
The consensus estimate among Wall Street analysts for hyperscaler spending in 2026 now stands at USD 527 billion, up from USD 465 billion at the start of the third-quarter earnings season. Most expect expenditures to continue growing until they eventually peak in 2028.
That said, capex that’s too high can itself become a red flag. But determining the point at which high capex transitions from being reasonable to unsustainable is tricky. Bears might argue that current levels of tech investment are on the verge of surpassing the heights of the dotcom bubble, while bulls contend that today’s investments not only begin from a higher base but are also advancing at a less aggressive pace than in the late 1990s.

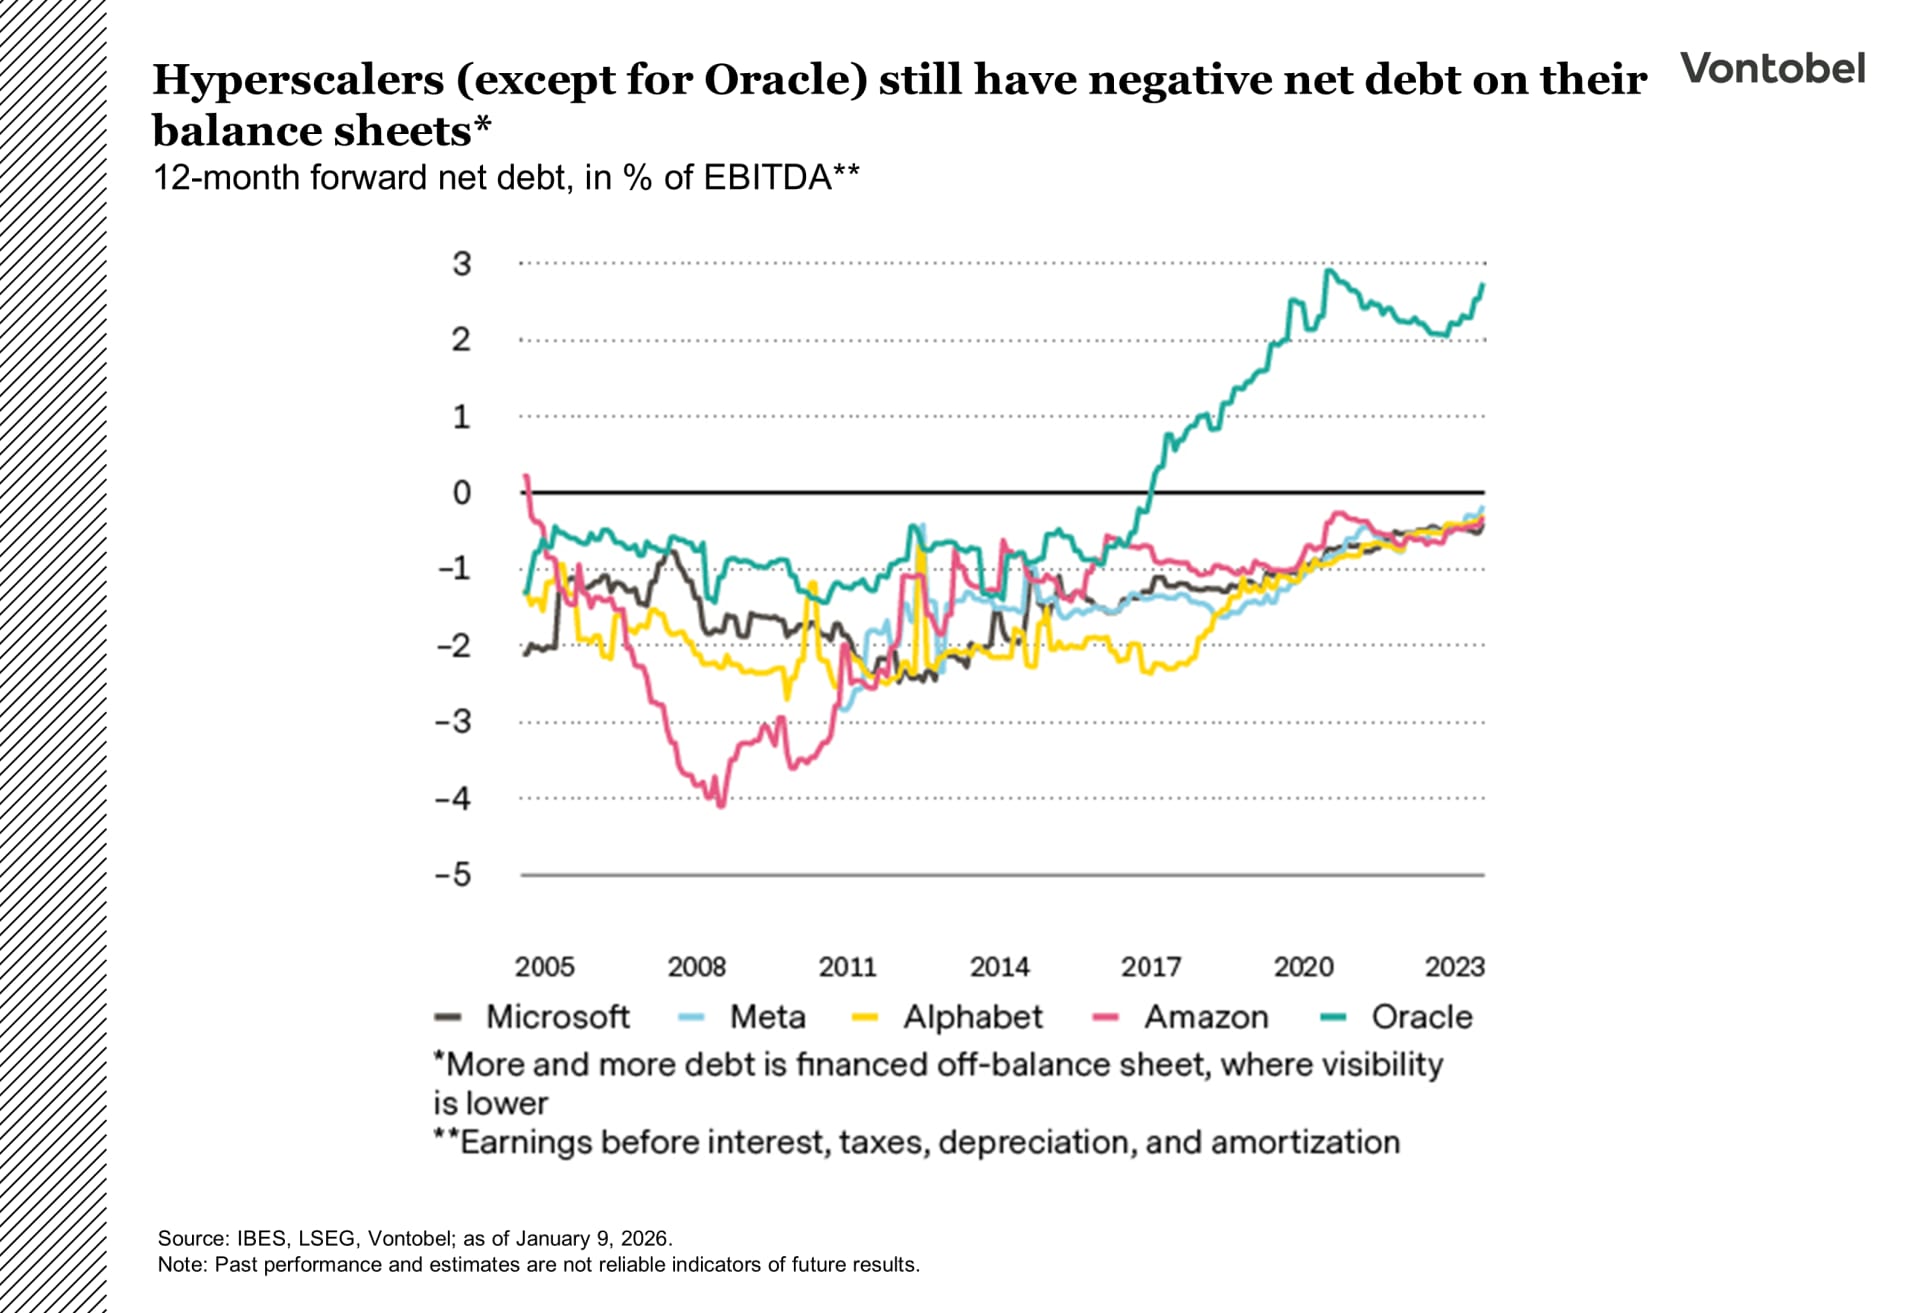
On the profitability front, investors may want to pay close attention to free cash flow (FCF) developments. FCF measures the cash a company generates after accounting for capex needed to maintain or expand its asset base. In essence, it reflects the cash available for distribution to investors or reinvestment in the business. Positive FCF indicates that a company is generating more cash than it requires to cover operating expenses and capital investments, which is a sign of financial strength. Negative FCF could point to financial challenges or significant investments in growth. Due to the recent capex spree, the cash flows of many hyperscalers are indeed declining but have not yet turned negative. One notable exception is Oracle, whose free cash flow is already negative. Investors may also want to stay alert to signs of deteriorating profitability, as they can indicate potential challenges ahead. Analysts use a wide range of profitability metrics to evaluate stocks. It is probably particularly important to focus on measures like return on assets (ROA) and return on equity (ROE), which provide insights into how efficiently a company utilizes its resources and generates returns for shareholders. For now, hyperscalers’ 12-month forward ROA remains near an all-time high (at over 16 percent), while their 12-month forward ROE has declined slightly but remains elevated (at above 27 percent).
An eye on hyperscalers
Another potential warning sign would be if hyperscalers were to take on excessive debt, which can be problematic for several reasons. It often results in higher interest payments, which can strain cash flow and limit funds available for other investments. Additionally, it may negatively impact credit ratings, making future borrowing more expensive or challenging. In a worst-case scenario, if debt obligations exceed a company’s ability to generate sufficient income or cash flow, it can lead to insolvency. As of now, most hyperscalers continue to maintain negative net debt on their balance sheets.
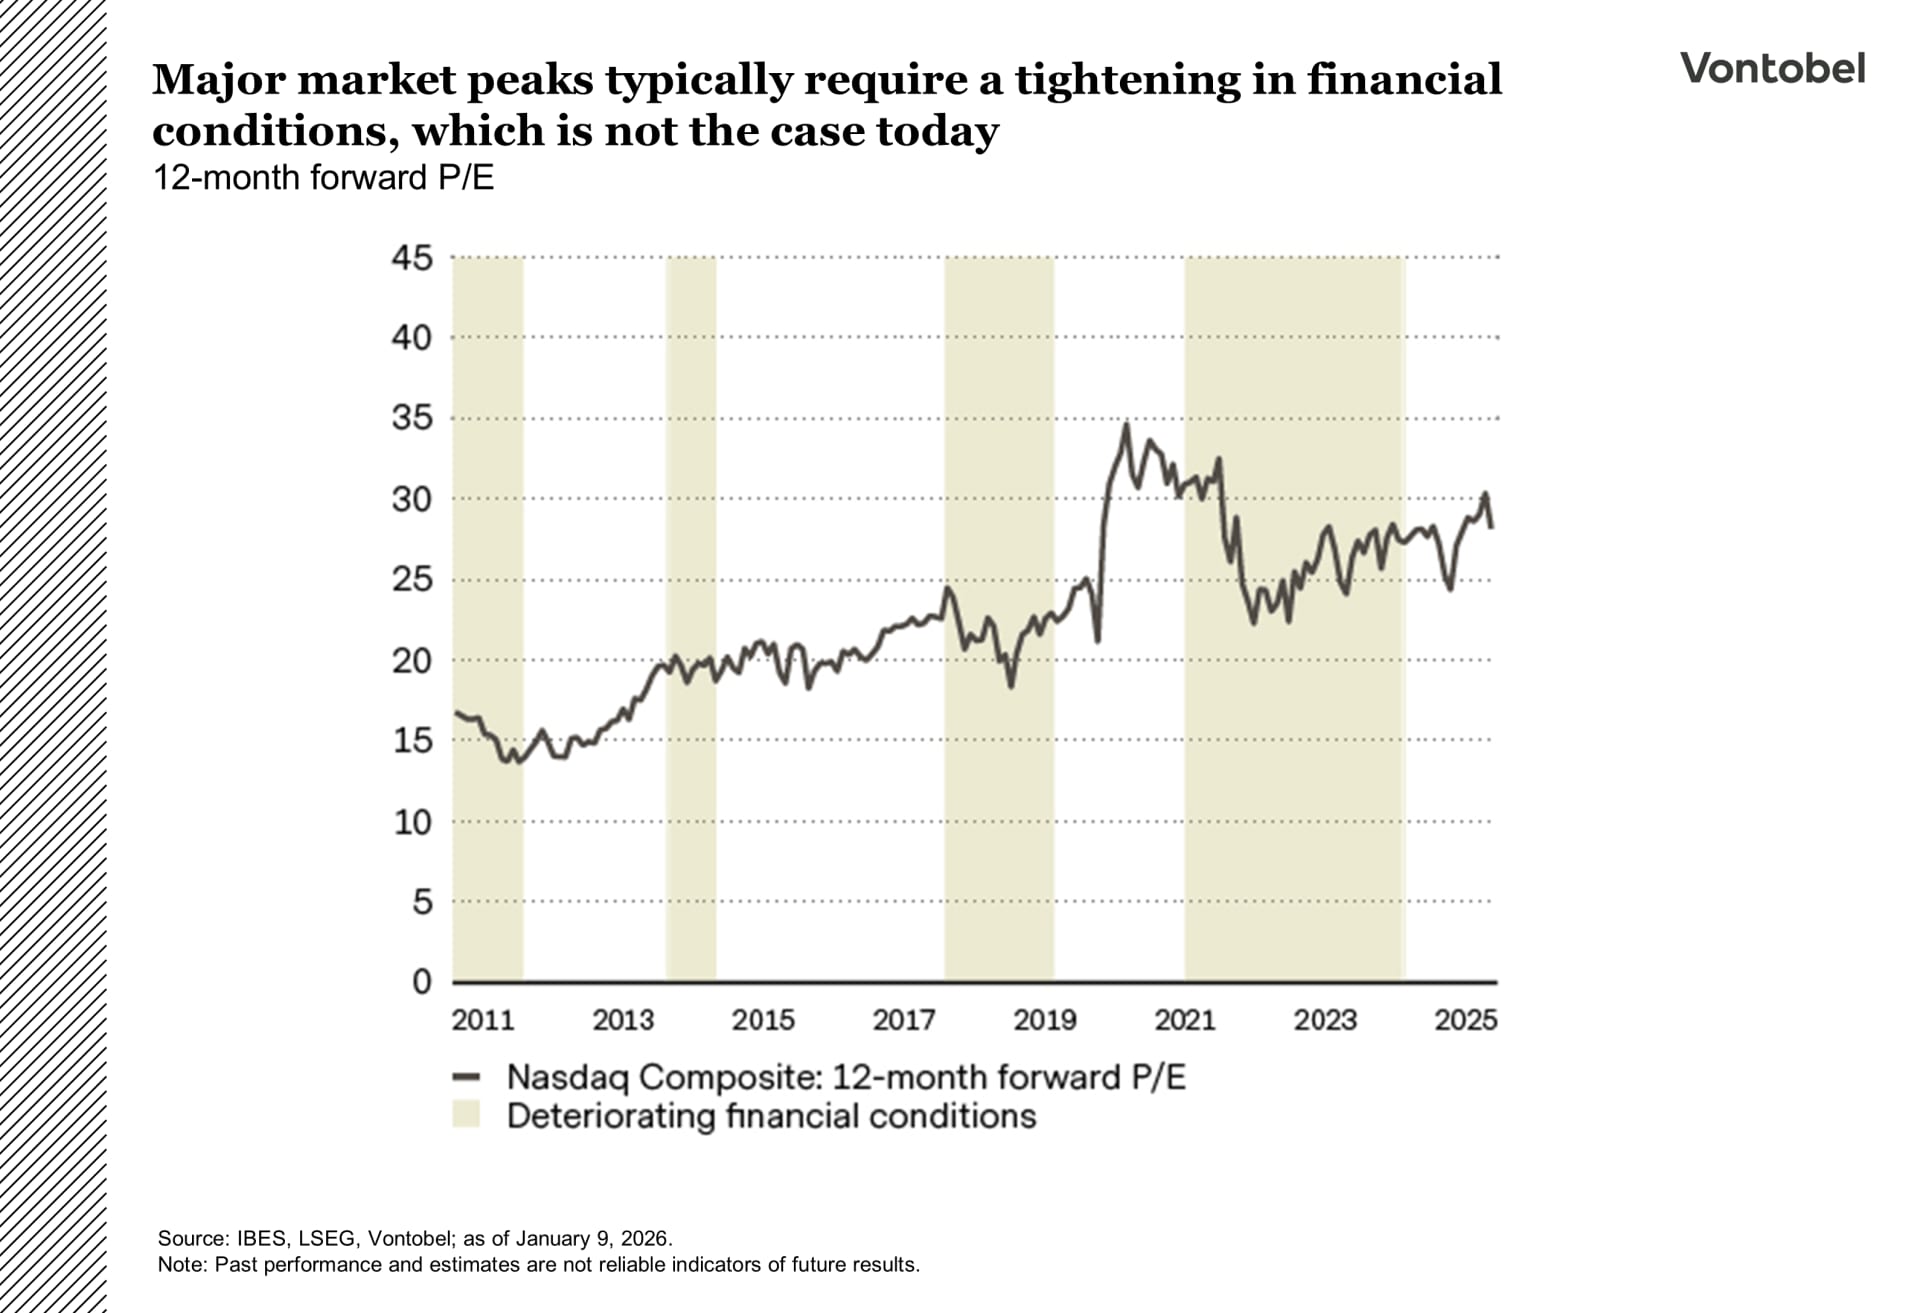
On the sentiment side, it is crucial that financial conditions do not tighten significantly.
What does this mean? For a bubble to burst, there is typically a “needle” that pricks the bubble, acting as a trigger. In the three most recent major episodes – the dot-com bubble of the late 1990s to early 2000s, the subprime crisis of 2007, and the regional banking stress of 2023 – that needle was a tightening of financial conditions driven by interest-rate hikes by the Fed. The Multi Asset Boutique currently sees little justification for the Fed to raise interest rates. While inflation remains above target, the weakening labor market argues in favor of lower interest rates. We also believe that the next Fed chair, following the end of Jerome Powell’s term in May, will likely adopt a more dovish policy stance.
Insider share sales H3
One could also be cautious if insiders (e. g., tech executives, founders) begin selling large volumes of shares. While insider sales can occur for personal reasons, a significant, consistent pattern of insider selling could imply concerns about a company’s future growth prospects.
A similar pattern was observed between September 1999 and July 2000, when insiders at dot-com companies sold shares totaling USD 43 billion, twice the rate recorded in 1997 and 1998. At present, there are no clear signs of excessive insider selling. One potential example (of many) is the possibility of an initial public offering by OpenAI, which could raise some questions.
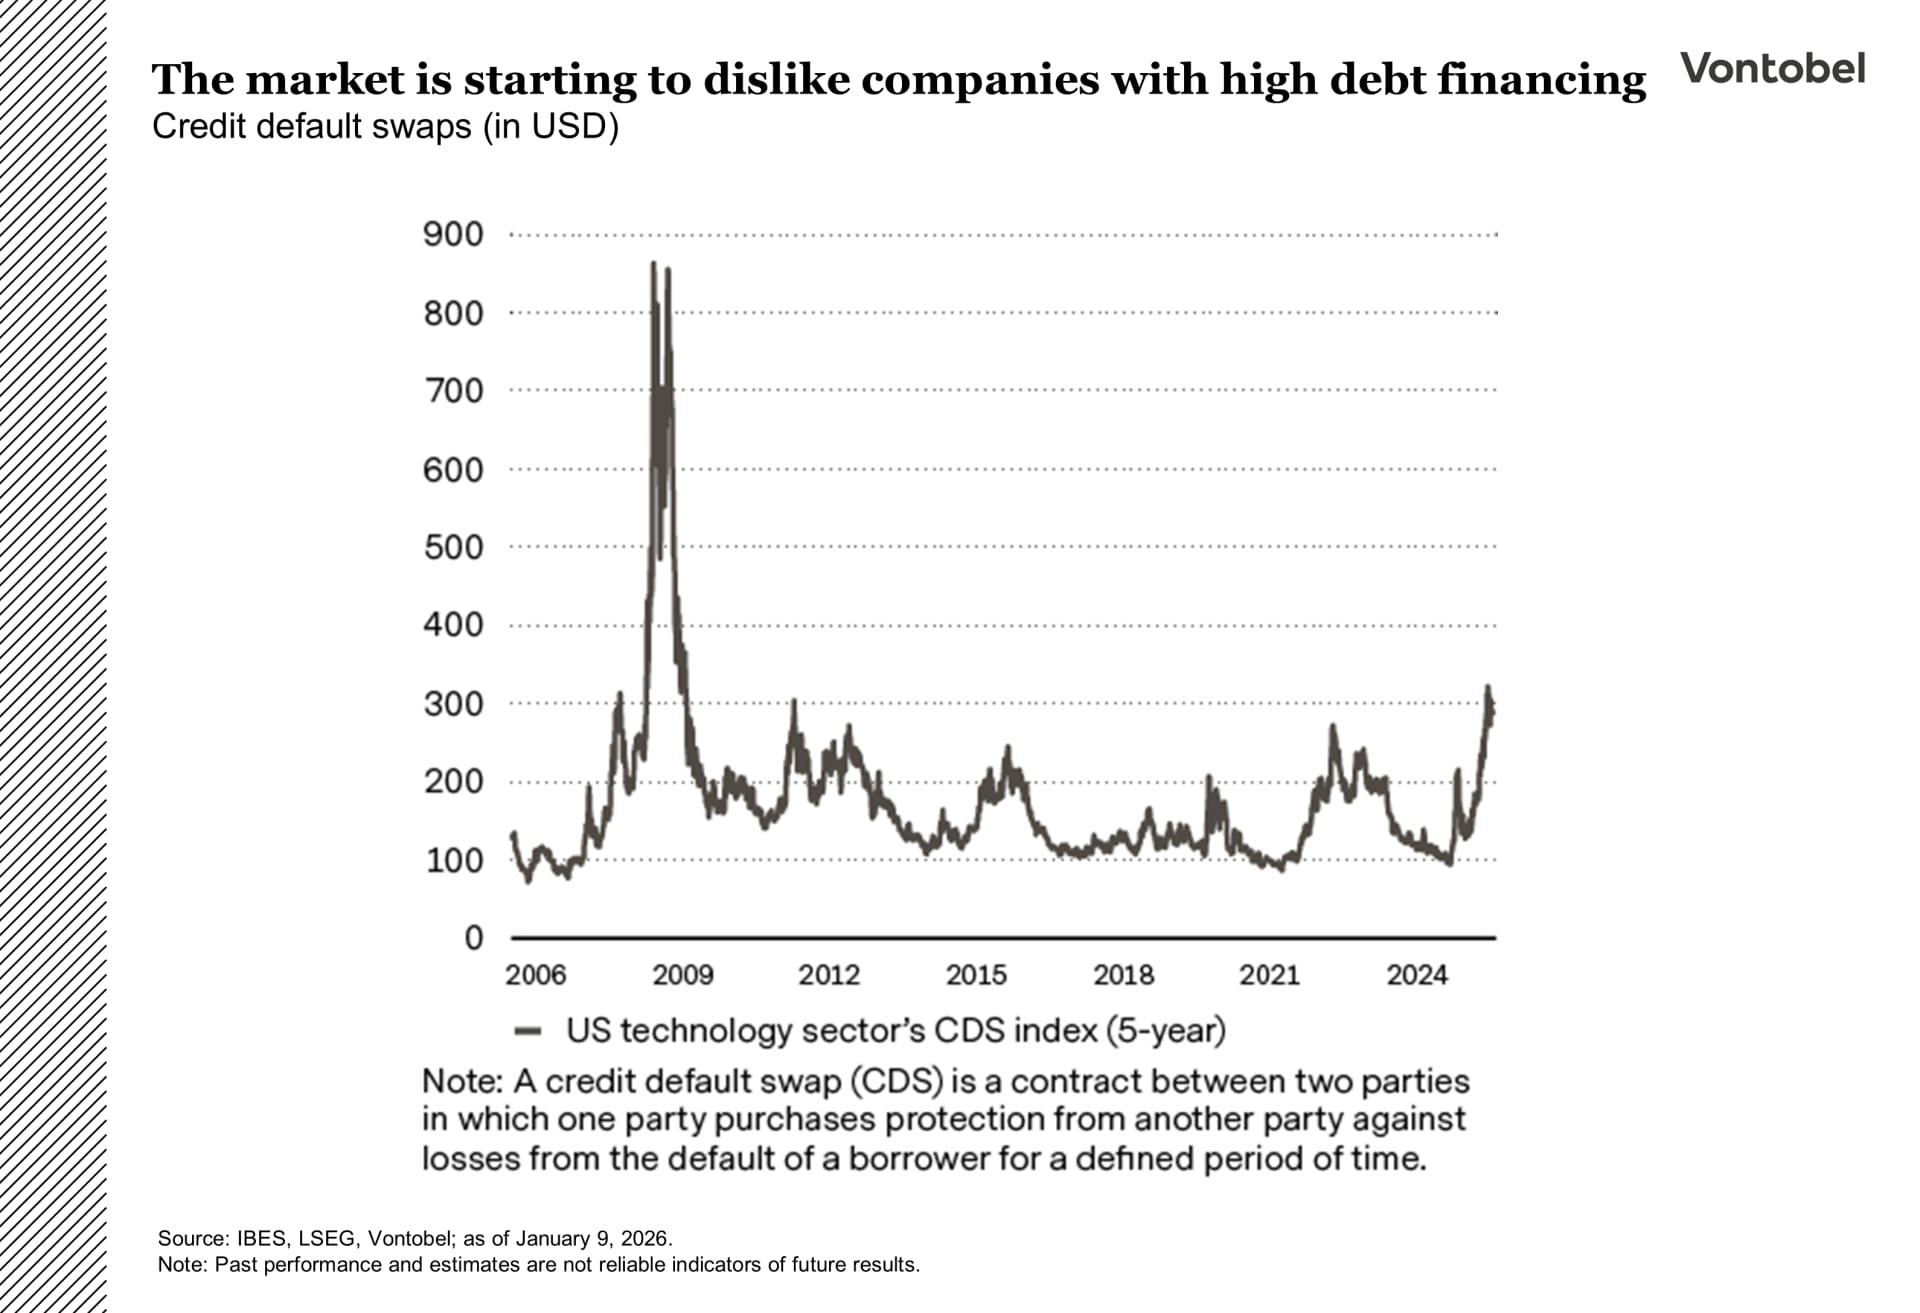
To conclude, most of these indicators do not yet suggest that the AI rally has run “out of memory.” The only signal that has already materialized is the fact that markets have indeed grown cautious about hyperscalers’ leverage. Credit default swap (CDS). spreads for US tech firms are widening, mostly due to Oracle. This reflects growing investor concerns about the increasing debt these companies are taking on to fund massive projects, such as AI infrastructure.
Patience after the cut
The Fed left rates unchanged at its January meeting, the first hold since July 2025, and Chair Jerome Powell signaled there’s no urgency to continue cutting, brushing off Trump’s push for much lower borrowing costs.
The pause matters because it comes right after the Fed had been easing steadily. At its December meeting, the Fed lowered the fed funds target range by 25bps, its third consecutive cut. The overall message still leaned dovish, but with a clear “don’t get carried away” undertone. The dovish element was the macro backdrop: a stronger growth outlook and lower inflation projections, suggesting increased confidence in a soft-landing path. The hawkish element was the reaction function. The statement, and Powell’s comments, pointed to a preference to sit tight for a while and let the data guide decisions, rather than keep cutting mechanically. For 2026, the dots imply just one 25bps cut, while markets are pricing in closer to two.

Two 25bps cuts by year-end still look most plausible. Inflation is proving sticky, but the Fed has an incentive to move in small steps to avoid an unnecessary tightening in financial conditions.
Under that outcome, front-end yields are poised to grind lower, while the long end stays range-bound but with a slight downward bias. In a bullish rates scenario, fundamentals deteriorate enough to pull the Fed into faster easing, driving a bigger front-end rally and dragging longer-dated yields lower too. In the bearish scenario, stubborn inflation keeps the Fed on hold for longer. In that case, the front end remains anchored by policy, while the long end is more likely to back up as inflation expectations and term premium rebuild.
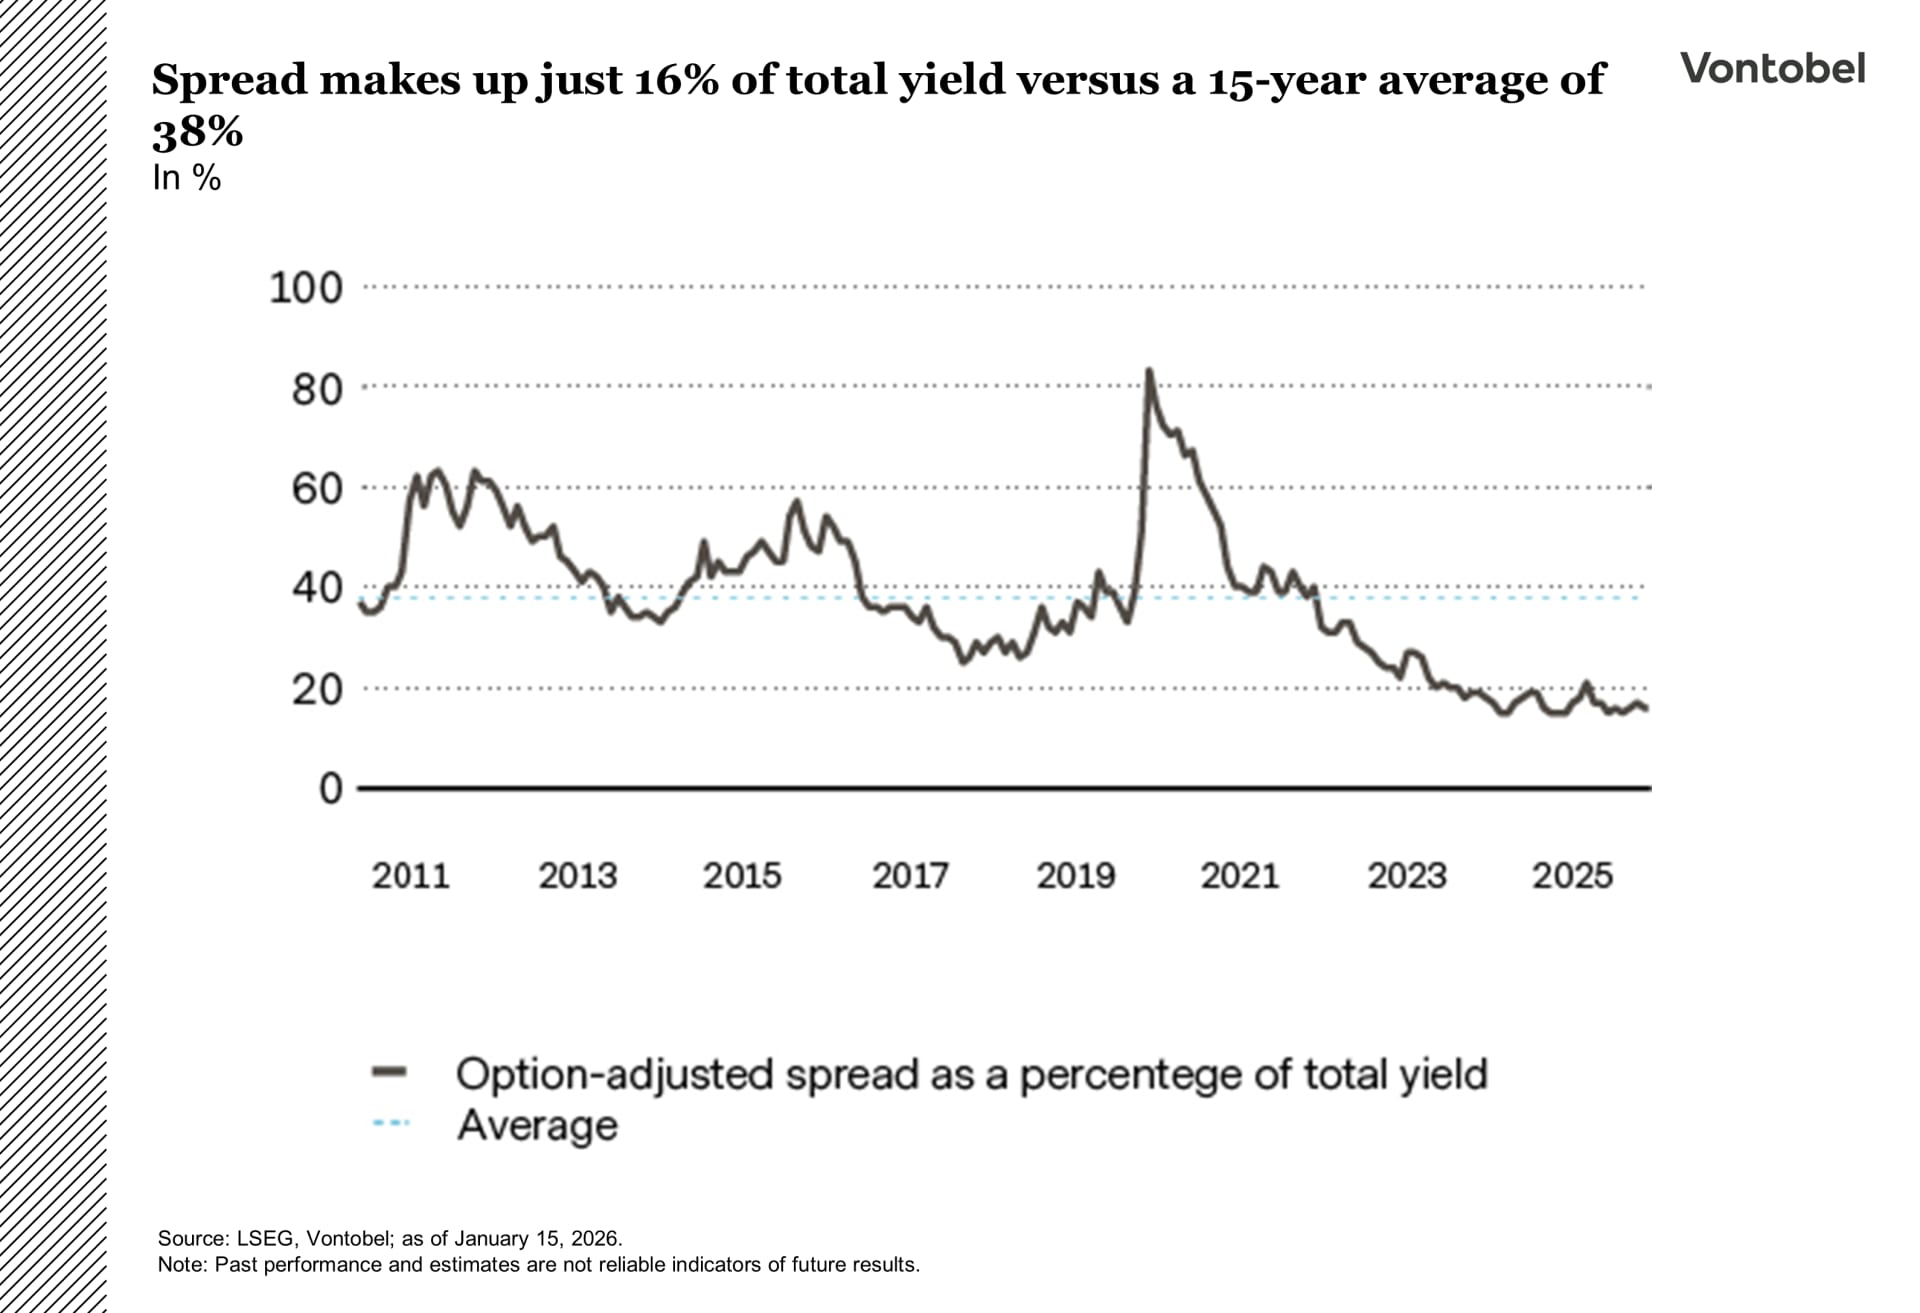
One big question is how much new debt the tech sector will issue, especially from hyperscalers and AI-linked borrowers. Late last year already signaled the direction, when several hyperscalers printed huge benchmark deals, and the core group (Amazon, Alphabet, Meta, Microsoft, Oracle) raised a record amount once both plain-vanilla IG bonds and structures like joint ventures and special purpose vehicles are included. The issue is funding choice, not funding need. These companies can self-fund a large portion of capex, but recent behavior suggests bonds will remain part of the mix as AI infrastructure spending ramps up. More supply should mean more concession around busy issuance windows. Demand for high-quality, liquid tech credit offsets this, but on balance the heavier AI pipeline points to wider spreads. This matters because the market is in a rate-led zone: spreads make up only about 16 percent of yield today, versus roughly 38 percent over the past 15 years, so the credit cushion is thin and makes returns more sensitive to any widening.
How 2025 set the tone for more market breadth in 2026
From AI leadership to broader markets: A look at 2025 sector lessons and why 2026 may be poised to favor diversification, Europe, and emerging-market (EM) equities. Despite a volatile start, global equity markets ended 2025 in positive territory, showing off a strong ability to absorb macroeconomic, geopolitical, and monetary policy shocks. Global sector attribution for the year highlights the main investment themes.
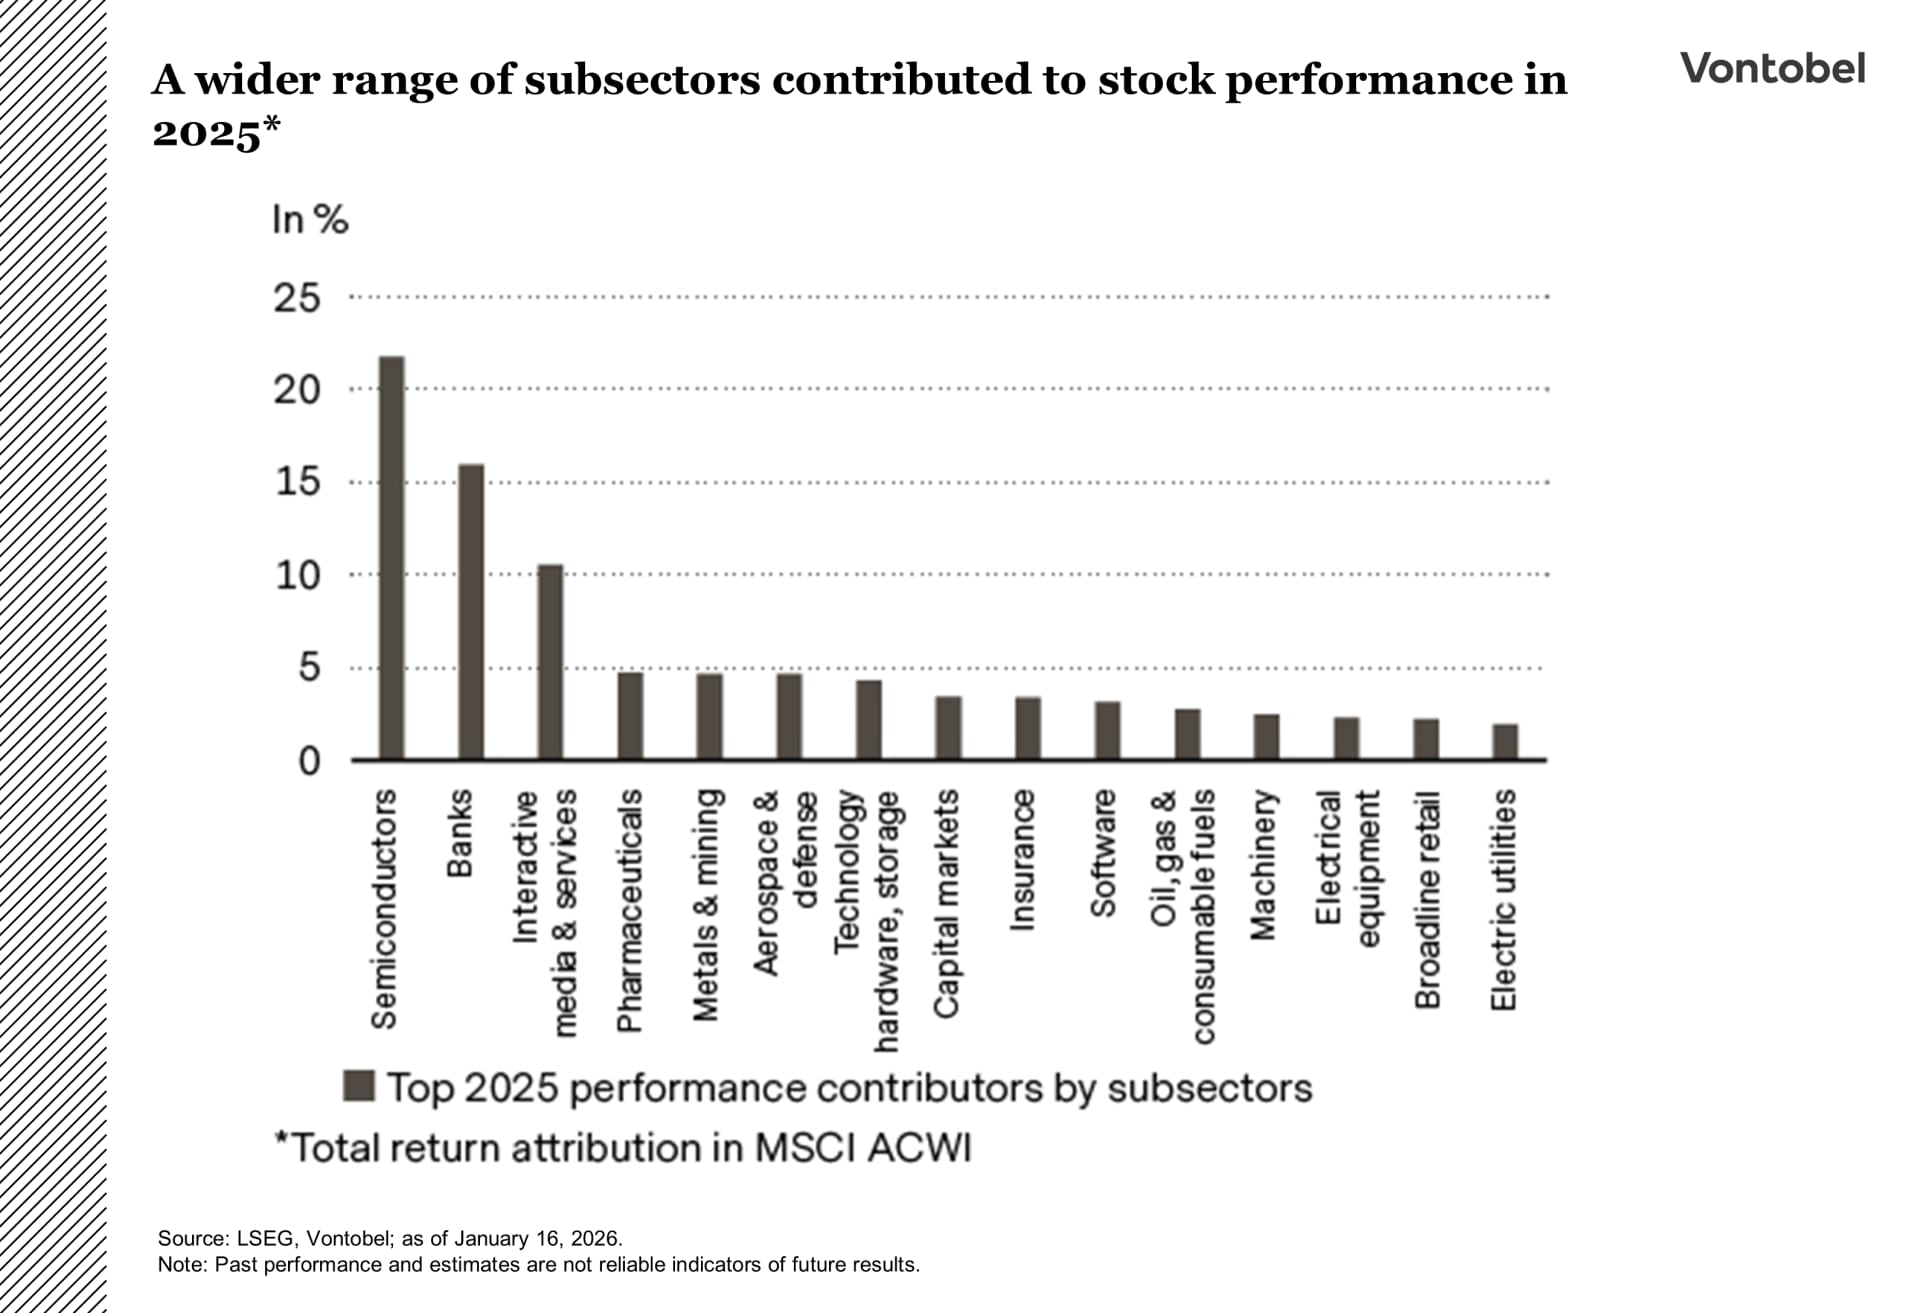
First and foremost was the AI-driven capex complex. While semiconductors remained the natural starting point, performance drivers extended across the value chain. Rising energy requirements linked to AI supported electrical equipment and select industrial niches. Defense also stood out as a meaningful contributor, particularly in Europe, amid a more complex geopolitical backdrop and improved visibility on public spending. Financials followed as a solid second-tier contributor, with banks benefiting from still-elevated margins and asset quality that proved more resilient than expected. Pharmaceuticals rounded out the top five, gaining traction toward the end of the year.
That’s when investors revisited questions around the “circular economy” of AI, including rising leverage, limited visibility on monetization, and the acceleration in capex spending in the final months of the year. Alphabet’s Gemini 313 breakthrough and the emergence of alternatives to Nvidia’s graphics processing units contributed to a shift in leadership within the AI complex and Magnificent 7, while markets entered a derisking phase, rotating toward more defensive sectors and supporting a broadening of market participation.
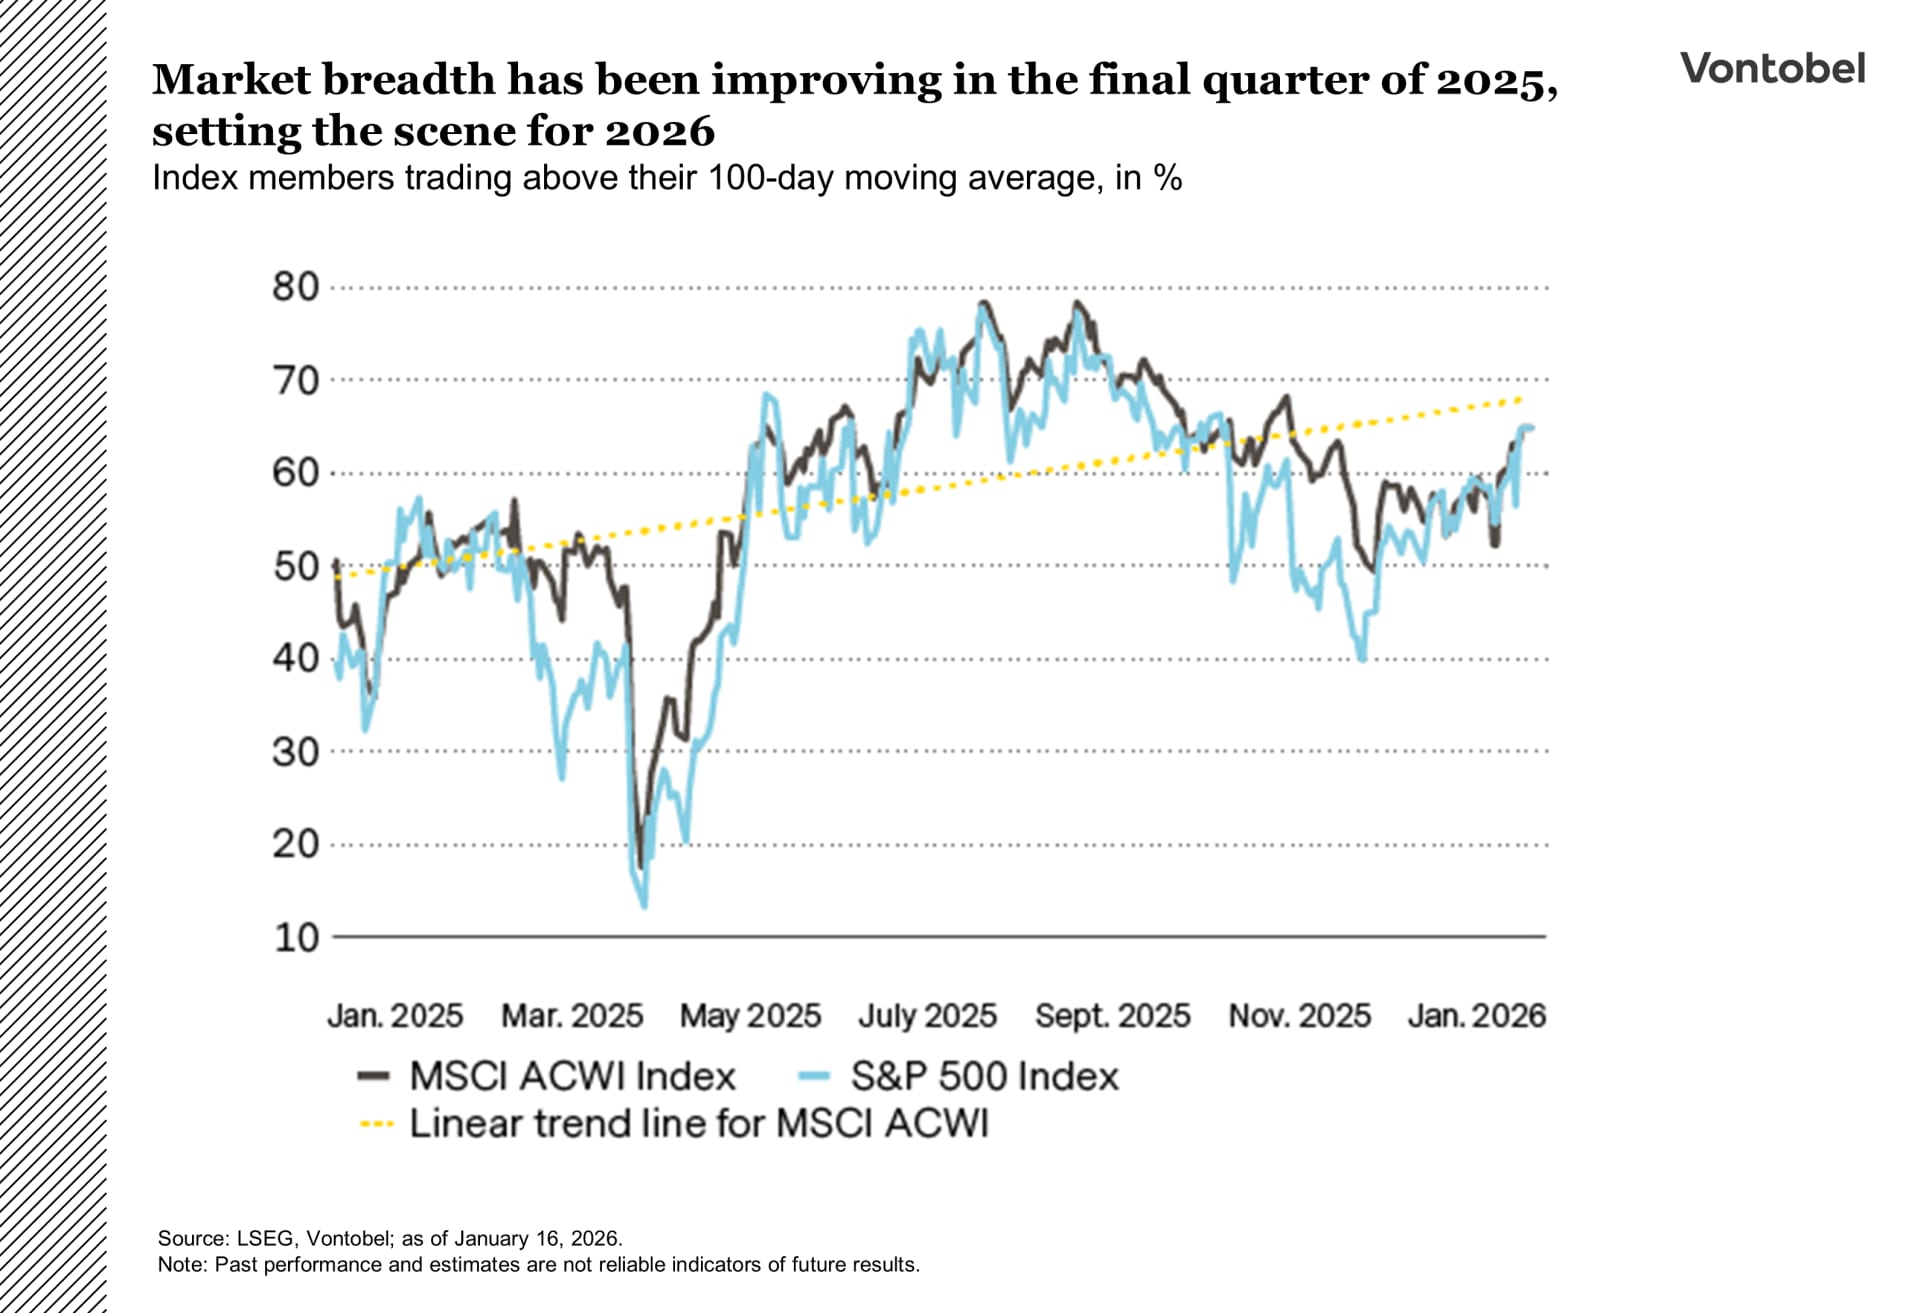
2026 is shaping up to be a structurally supportive year for equities amid a combination of macroeconomic, political, and industrial forces that are likely to translate into a more constructive environment for growth and corporate earnings. While the Multi Asset Boutique reiterates its view that concerns about a potential technology bubble are overstated, speculation around it is unlikely to fade. At the same time, the dynamics investors encountered in the final months of 2025 should continue to support further broadening in market performance.
Basking in the golden glow
If commodity markets held their own version of the Grammy Awards, gold would have walked away with a handful of accolades in 2025. The yellow metal gained 65 percent last year and turned up the music even more in early 2026.
Sustained central bank buying, along with growing concerns about currency debasement and rising debt levels, made gold a compelling asset to own in 2025. In January 2026, concerns over Fed independence resurfaced following Donald Trump’s attempt to indict Chair Jerome Powell. Combined with geopolitical noise out of Venezuela, Iran, and even the Arctic, these developments drove the safe haven above USD 5,500 per ounce. Traditional valuation metrics now appear to be less helpful, making it more difficult to determine a “fair value” for gold.
The Multi Asset Boutique believes gold’s most likely path is higher, but any future gains are unlikely to be linear (read: volatile). On the one hand, central banks continue to have an incentive to diversify their reserves away from the US dollar. While their recent buying spree has raised official gold holdings to a bit less than 20 percent of total reserves, this remains well below historic levels. Emerging markets in particular, such as China, may still have catch-up potential. China’s official gold reserves account for about 8 percent of total reserves

To put this into perspective, countries like Germany hold over 70 percent. Overall, this relatively inelastic cen- -tral bank demand is likely to put a floor under prices.
While central banks may temporarily balk at elevated prices, their long-term objectives should help prevent gold from falling below USD 4,000 per ounce.
Cooling ETF demand
On the other hand, demand is less inelastic elsewhere. ETF flows, which were a key driver in 2025, cooled toward year-end. This was likely due to a combination of profit-taking and fears about a more hawkish Fed. While the Fed cut rates three times in the second half of 2025, some officials signaled that the easing cycle may soon pause or come to an end. This would be negative for a non-yielding asset like gold, which benefits from lower rates.
In addition, demand destruction has taken hold in the jewelry sector, with consumption down 23 percent year-on-year in Q3 2025. Some shoppers are now opting for platinum over gold, while others are gravitating toward 14-karat gold as an alternative to the traditional 18-karat, or, in the case of key buyer China, 22-to 24-karat gold.

A long hold in Switzerland and fading US dollar support
US dollar bears can lean on a simple story: rate expectations across G-10 economies are diverging, and the pattern isn’t supportive for the dollar. Markets still see the Fed as having the most room to cut. For years, the dollar has benefited from the view that US rates would sit above the pack. If the US is the one easing while others mostly wait, that advantage starts to erode. Zooming out, G-10 is expected to stay on hold in the near term, but with a mild hiking bias further out. That mix, a steady “no change” stance across much of G-10 in the near term, plus some tightening risk further out, is another way the rate backdrop can tilt away from the dollar at the margin.

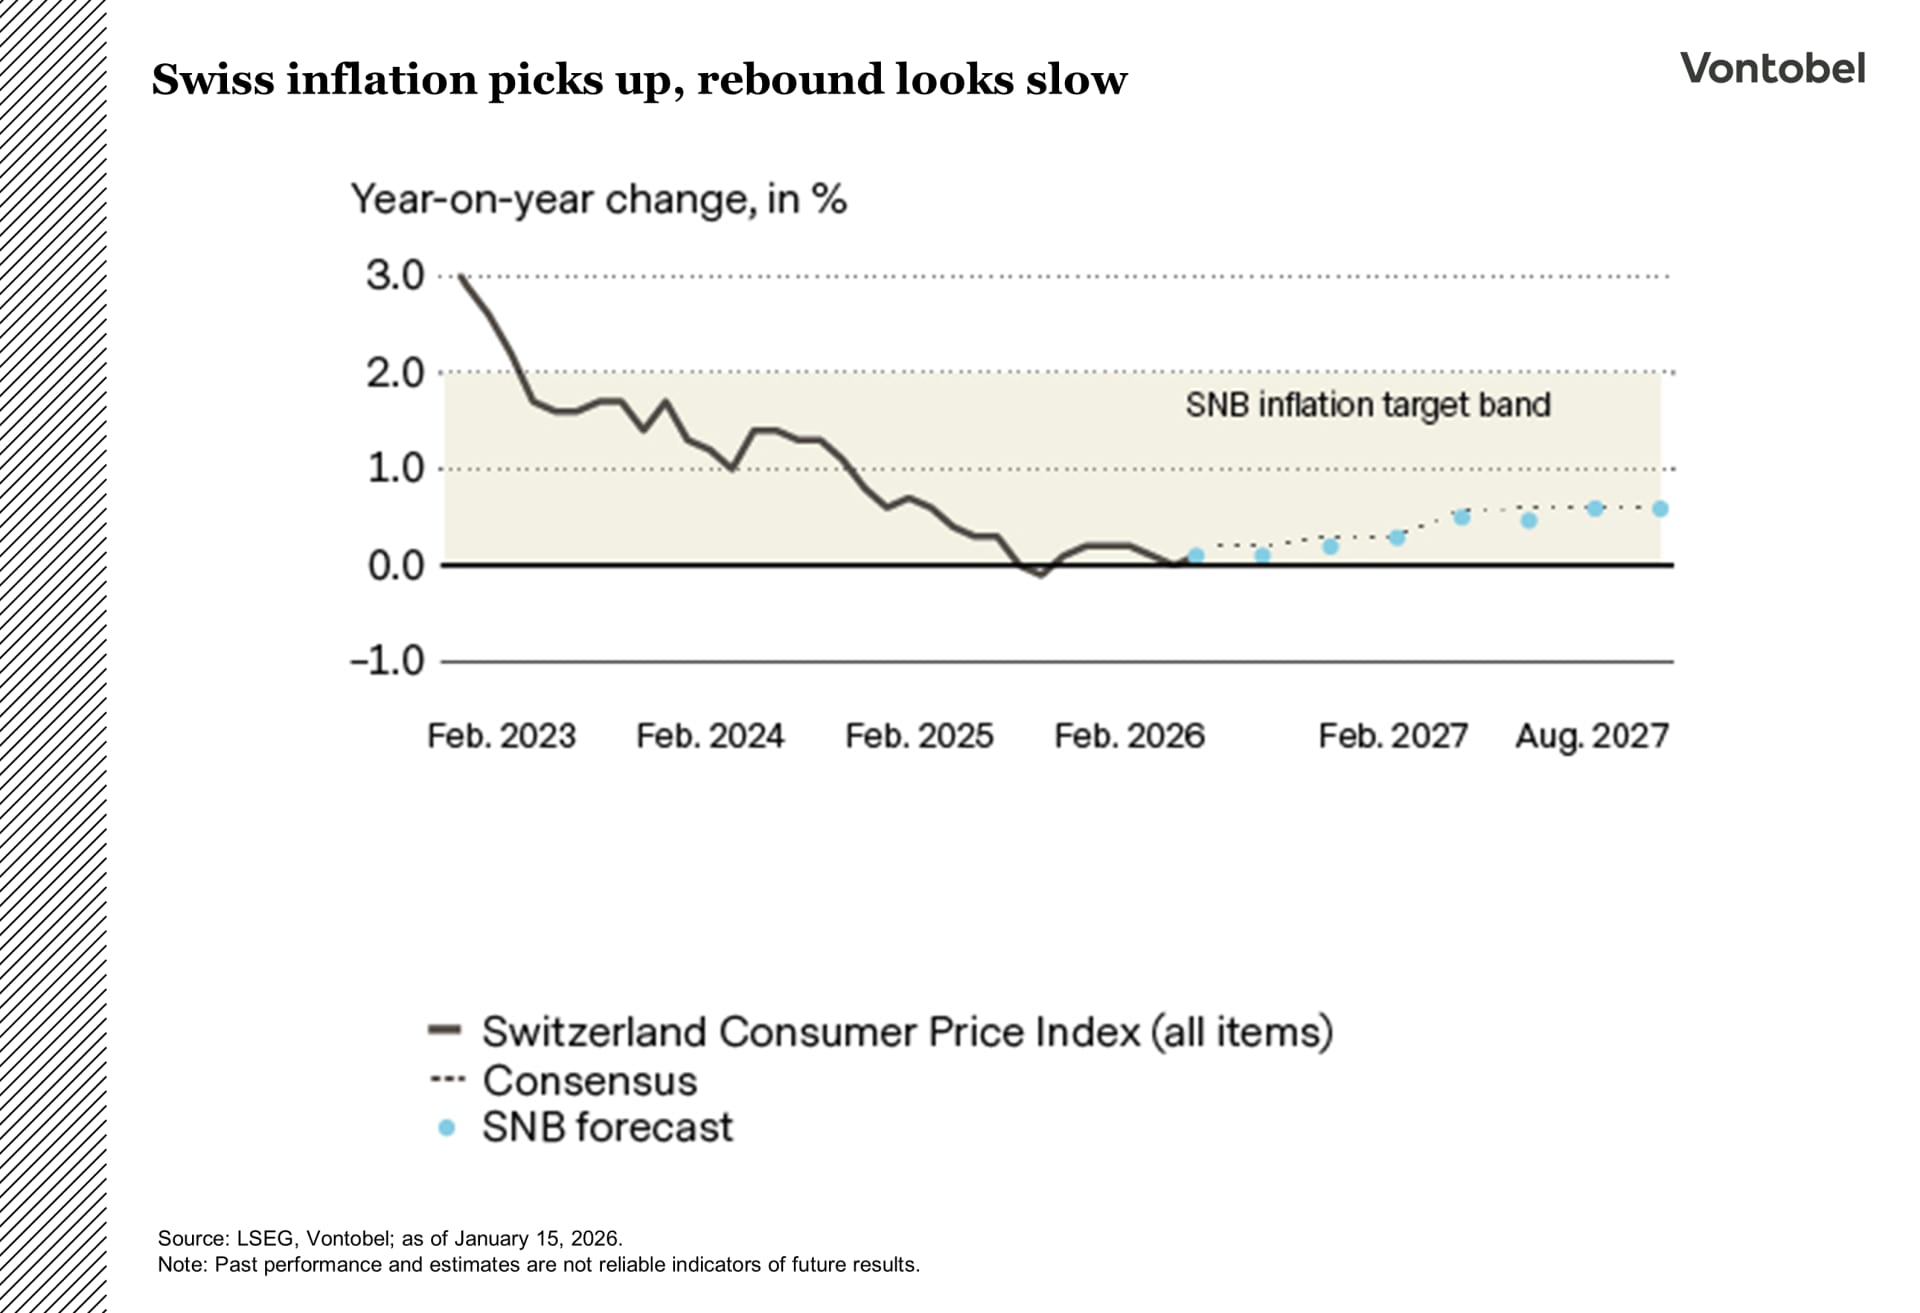
In Switzerland, inflation looks like it has found a floor. December marked a small uptick in both headline and core inflation. The firmer tone came mainly from services, with price increases most visible in areas like restaurants and hotels. At the same time, imported inflation stayed very weak, helped by the franc’s earlier strength pulling foreign prices lower.
If the franc stops appreciating as aggressively, the disinflation impulse from cheaper imports will likely fade. Combined with more stable energy effects, this points to inflation staying very low in the near term, then slowly moving higher as the year progresses. The direction is upward, but the balance of risks is still skewed to the downside.
Minutes from the Swiss National Bank (SNB) fit that picture. December was a clear “on hold” decision, but the discussion was more two-sided than in September, and that’s the nuance. The SNB is not in a rush to act and keeps a high bar for moving below zero, given the potential costs to the financial system. The SNB also sounds a bit less worried about a global risk-off shock that would turbocharge safe-haven demand for the franc, and it notes the franc has eased slightly since summer as rate differentials have moved against it.
So, the base case is a long hold phase. The SNB can live with low, subdued inflation as long as it remains within the target band and is expected to drift higher over time. The next shift is more likely to be about rebuilding policy space once the outlook is clearly stable, so the next move looks like a later story rather than something imminent.
The Swiss franc is likely to stay firm. With the SNB on hold for now and hikes only further out on the horizon, support comes mainly from defensive demand, which means consolidation in calm markets and quick strength in risk-off episodes.