Tuloskausi käynnistyy

Tuloskausi on käynnistymässä, ja Yhdysvaltain pankki- ja finanssisektori aloittaa raportoinnin tällä viikolla. Tuloksensa julkistaa muun muassa JP Morgan, Bank Of America, Morgan Stanley ja Goldman Sachs. Suurpankkien tulokset voivat luovat pohjan markkinoiden odotuksille, mutta samalla ne nostavat usein esiin makrotalouden epävarmuustekijöitä.
Finanssisektorin tulokset ensimmäisinä
Finanssisektorin raportointi on perinteisesti tarjonnut kaudelle vankan alun, ja tulokset ovat olleet usein odotusten mukaisia tai hieman ylittäneet ne Sektori kuitenkin korostaa usein taloudellisen epävarmuuden tekijöitä, kuten geopoliittisia jännitteitä ja makrodataa. Tämän sektorin uutiset, kuten viime vuoden puolella esiin noussut JP Morgan Chasen suuri Security and Resiliency Initiative -ohjelma, alleviivaavat sen roolia laajemmassa taloudellisessa kontekstissa.
Finanssisektori performoinut vahvasti
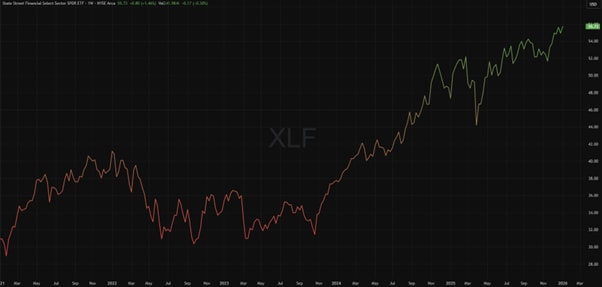
Finanssisektori on osoittanut vahvaa suoriutumista vuoden 2025 loppupuolella sekä tämän vuoden alkupuolella. Tämä näkyy myös sektoria seuraavan XLF-rahaston kurssikehityksessä. XLF:n kurssikehitys tarjoaa hyvän viitekehyksen siitä, kuinka paljon finanssisektorin odotukset ovat jo mahdollisesti hinnoiteltuina ennen tuloskauden alkua.
XLF, 5 vuoden graafi
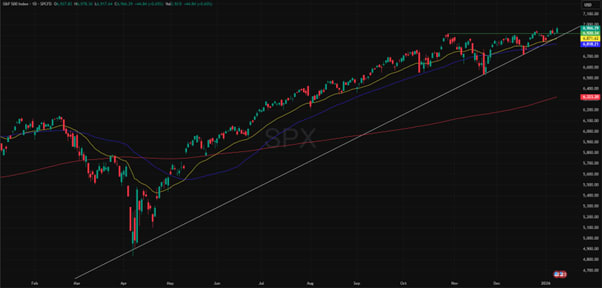
S&P 500, 1 vuoden graafi
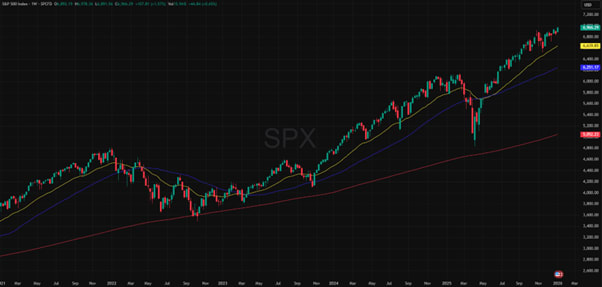
S&P 500, 5 vuoden graafi
Liittyvät tuotteet
S&P 500 indeksi on viime vuoden lopulla ja tämän vuoden alussa performoinut positiivisesti. Vuoden 2025 lopulla indeksi pääsi tekemään uudet ATH-lukemat (All Time High) hintatasossa $6 945, jota voidaan pitää positiivisena koko markkinoiden kannalta. Tämä asetti indeksin teknistä kuvaa myös entistä positiivisemmaksi tähän vuoteen siirryttäessä. Nousu on jatkunut tämän vuoden alussa, ja indeksi on päässyt jo tekemään uudet ATH-lukemat (All Time High) ensimmäisellä kokonaisella pörssiviikolla.
Hinta on graafilla näkyvien liukuvien keskiarvojen yläpuolella (EMA25, SMA50, SMA200), sekä näiden järjestys graafilla kertoo myös selkeästä nousutrendistä. 1 vuoden graafille on piirrettynä vaakaviiva (vihreä) vuoden 2025 lokakuun huipuista, jota voidaan pitää teknisestä näkökulmasta tärkeänä tasona. Näkyvissä on myös pohjien kautta piirretty nouseva trendilinja (valkoinen), joka antaa lisänäkemystä indeksin tekniseen kuvaan. Mahdollisessa korjausliikkeessä alaspäin, kyseiset tasot sekä graafilla näkyvät liukuvat keskiarvot voivat toimia mahdollisina tukialueina. Hinnan laskiessa graafille piirrettyjen tasojen tai liukuvien keskiarvojen alapuolelle, heikkenisi indeksin tekninen kuva nykytilanteeseen verrattuna.
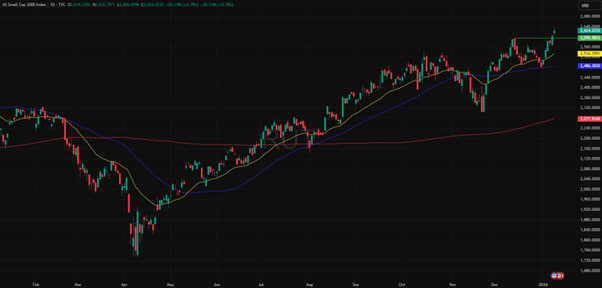
Russell 2000, 1 vuoden graafi
Russell 2000, 5 vuoden graafi
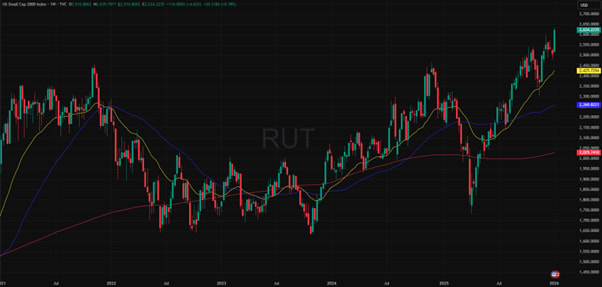
Alkava tuloskausi ja finanssisektorin raportointi voi näkyä vahvasti myös Russell 2000 indeksissä, jossa finanssisektorin osuus on merkittävässä painossa. Finanssisektorin tulokset voivat aiheuttaa merkittäviäkin hintaliikkeitä kyseisen indeksin kohdalla. Tuloskauteen mentäessä, Russell 2000 indeksin tekninen kuva on positiivinen. Joulukuun 2025 alkupuolella indeksi pääsi tekemään uudet ATH-lukemat (All Time High) hintatasossa $2 595, mutta vuoden 2025 loppua kohden indeksissä nähtiin laskuliikettä. Heti tämän vuoden alusta, indeksi on kuitenkin performoinut positiivisesti ja päässyt tekemään uudet ATH-lukemat (All Time High).
Artikkelin kirjoitushetkellä nousua tämän vuoden alusta on reilu 5%. Hinta on graafilla näkyvien liukuvien keskiarvojen yläpuolella (EMA25, SMA50, SMA200), sekä näiden järjestys graafilla on nousutrendin mukainen. 1 vuoden graafille on piirrettynä myös vaakaviiva (vihreä) vuoden 2025 huipuista, joka antaa lisätietoa indeksin tekniseen kuvaan. Hinnan pysyessä kyseisen tason yläpuolella, pysyisi indeksin tekninen kuva positiivisempana. Jos indeksissä nähdään korjausliikettä, ja hinta valuu kyseisen tason tai graafilla näkyvien liukuvien keskiarvojen alapuolelle, heikkenisi indeksin tekninen kuva.
Yhteenveto
Tuloskausi on alkamassa finanssisektorin raportoinnilla, mikä antaa ensimmäiset tiedot alkavasta tuloskaudesta. Finanssisektorin vahva kehitys ennen tuloskautta voi antaa positiivista näkemystä, mutta toisaalta se asettaa myös riskiä mahdollisesti liian korkeille odotuksille.
Graafeilla näkyvät indikaattorit:
● SMA200: 200 päivän liukuva keskiarvo, punainen.
● SMA50: 50 päivän liukuva keskiarvo, sininen.
● EMA25: 25 päivän eksponentiaalinen liukuva keskiarvo, keltainen.
Riskit
Credit risk of the issuer:
Investors in the products are exposed to the risk that the Issuer or the Guarantor may not be able to meet its obligations under the products. A total loss of the invested capital is possible. The products are not subject to any deposit protection.
Currency risk:
If the product currency differs from the currency of the underlying asset, the value of a product will also depend on the exchange rate between the respective currencies. As a result, the value of a product can fluctuate significantly.
Market risk:
The value of the products can fall significantly below the purchase price due to changes in market factors, especially if the value of the underlying asset falls. The products are not capital-protected
Product costs:
Product and possible financing costs reduce the value of the products.
Risk with leverage products:
Due to the leverage effect, there is an increased risk of loss (risk of total loss) with leverage products, e.g. Bull & Bear Certificates, Warrants and Mini Futures.
External author:
This information is in the sole responsibility of the guest author and does not necessarily represent the opinion of Bank Vontobel Europe AG or any other company of the Vontobel Group. The further development of the index or a company as well as its share price depends on a large number of company-, group- and sector-specific as well as economic factors. When forming his investment decision, each investor must take into account the risk of price losses. Please note that investing in these products will not generate ongoing income.
The products are not capital protected, in the worst case a total loss of the invested capital is possible. In the event of insolvency of the issuer and the guarantor, the investor bears the risk of a total loss of his investment. In any case, investors should note that past performance and / or analysts' opinions are no adequate indicator of future performance. The performance of the underlyings depends on a variety of economic, entrepreneurial and political factors that should be taken into account in the formation of a market expectation.
Disclaimer:
This information is neither an investment advice nor an investment or investment strategy recommendation, but advertisement. The complete information on the trading products (securities) mentioned herein, in particular the structure and risks associated with an investment, are described in the base prospectus, together with any supplements, as well as the final terms. The base prospectus and final terms constitute the solely binding sales documents for the securities and are available under the product links. It is recommended that potential investors read these documents before making any investment decision. The documents and the key information document are published on the website of the issuer, Vontobel Financial Products GmbH, Bockenheimer Landstrasse 24, 60323 Frankfurt am Main, Germany, on prospectus.vontobel.com and are available from the issuer free of charge. The approval of the prospectus should not be understood as an endorsement of the securities. The securities are products that are not simple and may be difficult to understand. This information includes or relates to figures of past performance. Past performance is not a reliable indicator of future performance.
© Bank Vontobel Europe AG and/or its affiliates. All rights reserved.