A look at Nvidia's earnings this week

This week, many investors will be watching Nvidia, which is still considered the center of AI infrastructure. The company's earnings report is scheduled for release on Wednesday after the US market closes, and is expected to provide important direction for the market, answering the question of whether Nvidia can beat expectations again - and on what terms.
Expectations and key numbers
Analysts have clearly raised their expectations for Nvidia.
● Revenue for Q3 is expected to be approximately USD 54.8 billion.
● Earnings per share (EPS) is estimated to be approximately USD 1.25 per share.
● The data center business is expected to continue to grow strongly, up to around 60%.
Additionally, analysts point out that capital expenditures (capex)s in AI infrastructure by large hyperscalers such as Microsoft, Amazon, and others could support Nvidia. The demand for AI computing power hasn’t shown signs of slowing down.
Why is Nvidia's report so important?
Nvidia is not “just” a technology giant. Due to general market sentiment and issues related to artificial intelligence, the company’s role has become central.
● The company is a major player in the AI hardware delivery, and its product lines such as the Blackwell architecture are raising expectations.
● Nvidia's results can serve as an indicator for the entire AI and semiconductor sectors.
● There are significant expectations associated with the company and this risk carries weight: if the company's report is weak or expectations are not met, it can quickly be reflected in general market sentiment and cause significant price movements.
Risks and uncertainties
Although the company's growth rate appears strong, it is also important to consider potential risk factors.
● Export restrictions to China are creating uncertainty for certain AI chip products and may impact future quarters.
● High expectations for results and company development may lead to disappointment if they are not met. The market may still demand positive surprises. Simply meeting expectations may not be enough.
● Also taking the broader market context into account, including interest rates, inflation and geopolitical factors can affect investors' risk appetite and, consequently, the pricing of technology stocks.
Outlook for investors and the market
The report’s results can have several effects:
● If Nvidia beats expectations and guidance is strong, this could support the entire AI and semiconductor sector. This could generate broad positive momentum and strengthen sentiment in both large- and mid-cap semiconductor companies.
● If expectations are not met or guidance is cautious, however, it could in turn trigger a broader negative reaction – not only in Nvidia stock, but also in other stocks and sectors tied to AI and semiconductors.
In addition to the numbers, investors should also follow management's comments on investments, the demand outlooks, and supply chain situation.
Technical analysis
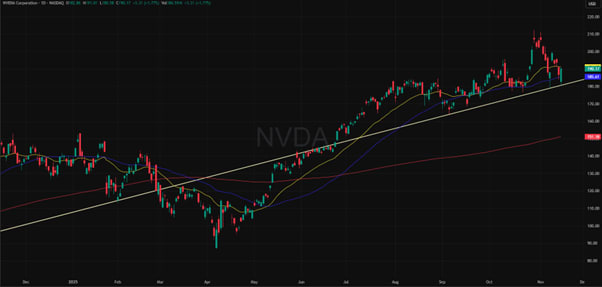
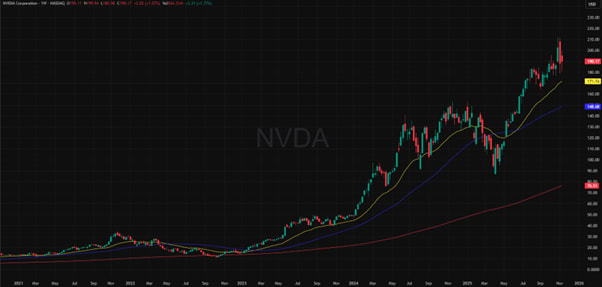
Nvidia's stock price has been performing very well in recent years. Since the beginning of this year, it has risen by around 40%, and even more since the 2025 lows. The price reaction to the previous result was initially slightly negative, but the price soon continued to rise, reaching a new ATH (All Time High) readings of $212.19 in October. At the time of writing, the share price is around $190.
From a technical perspective, it can be highlighted that the price broke the 25-Day Exponential Moving Average (EMA25) (yellow) and 50-Day Simple Moving Average (SMA50) (blue) moving averages visible on the daily chart downwards in early November. The price has remained in the vicinity of these and is below the EMA25 moving average at the time of writing. If the decline continues, and the SMA50 moving average is also broken downwards, the technical picture will weaken, especially when viewing the shorter time frame. However, the price is above all the moving averages visible looking at the weekly chart and is still clearly above the 200-Day Simple Moving Average (SMA200) (red) moving average on the daily chart. On the daily chart, a trend line can be seen, which has acted as a clear support level in previous months. A downward break of this trend line would also weaken the technical picture. A slightly weakened technical picture could also create uncertainty among investors, unless significant changes occur in it before the published result.
NVDA (USD), one-year chart
NVDA (USD), five-year chart
Related Products
Summary
Nvidia's earnings release this week is one of the most significant events of the earnings season. While expectations are strong, delivering a positive surprise can be a challenge, also considering the strong comparative periods.
Risks
Credit risk of the issuer:
Investors in the products are exposed to the risk that the Issuer or the Guarantor may not be able to meet its obligations under the products. A total loss of the invested capital is possible. The products are not subject to any deposit protection.
Currency risk:
If the product currency differs from the currency of the underlying asset, the value of a product will also depend on the exchange rate between the respective currencies. As a result, the value of a product can fluctuate significantly.
Market risk:
The value of the products can fall significantly below the purchase price due to changes in market factors, especially if the value of the underlying asset falls. The products are not capital-protected
Product costs:
Product and possible financing costs reduce the value of the products.
Risk with leverage products:
Due to the leverage effect, there is an increased risk of loss (risk of total loss) with leverage products, e.g. Bull & Bear Certificates, Warrants and Mini Futures.
External author:
This information is in the sole responsibility of the guest author and does not necessarily represent the opinion of Bank Vontobel Europe AG or any other company of the Vontobel Group. This information is sponsored by Bank Vontobel Europe AG, which may be a counterparty to transactions involving the financial instruments discussed in this information. The further development of the index or a company as well as its share price depends on a large number of company-, group- and sector-specific as well as economic factors. When forming his investment decision, each investor must take into account the risk of price losses. Please note that investing in these products will not generate ongoing income.
The products are not capital protected, in the worst case a total loss of the invested capital is possible. In the event of insolvency of the issuer and the guarantor, the investor bears the risk of a total loss of his investment. In any case, investors should note that past performance and / or analysts' opinions are no adequate indicator of future performance. The performance of the underlyings depends on a variety of economic, entrepreneurial and political factors that should be taken into account in the formation of a market expectation.
Disclaimer:
This information is neither an investment advice nor an investment or investment strategy recommendation, but advertisement. The complete information on the products (securities) mentioned herein, in particular the structure and risks associated with an investment, are described in the base prospectus, together with any supplements, as well as the final terms relating to the securities. The base prospectus and final terms constitute the solely binding sales documents for the products mentioned herein. It is recommended that potential investors read these documents before making any investment decision. The documents and the key information document are published on the website of the issuer, Vontobel Financial Products GmbH, Bockenheimer Landstrasse 24, 60323 Frankfurt am Main, Germany, on https://prospectus.vontobel.com and are available from the issuer free of charge. The approval of the prospectus should not be understood as an endorsement of the securities. The securities are products that are not simple and may be difficult to understand. This information includes or relates to figures of past performance. Past performance is not a reliable indicator of future performance. This information may only be distributed or published in countries where such distribution or publication is permitted by applicable law. As stated in the relevant base prospectus, the distribution of the securities mentioned in this information is subject to restrictions in certain jurisdictions. This advertisement may not be reproduced or redistributed without prior permission by Vontobel.
© Bank Vontobel Europe AG and / or affiliated companies. All rights reserved.