Nasdaq may rebound on short-term lower interest rates

Monday’s downward rebound in US Treasury rates could trigger the Nasdaq index, linked to its higher valuation based on more anticipated future profits. Nasdaq is technically also traded around a support level.
Rising bond yields continue to put pressure on world stock markets. Meanwhile, it is interesting to note that both the Bank of England and China's central bank have started to stimulate their economies with, among other things, government bond buybacks. The decisive moment in the market will be when the Fed changes foot, but we are not there yet. Rising bond yields and falling risk appetite for low-rated bonds are also raising concerns about major credit defaults, with Credit Suisse being the latest.
The world's major stock market indices have declined by between five and eight per cent in the past month, with the Japanese Nikkei being the only positive exception.
Significant stock indices performance in one week, one month and this year

Source: www.di.se, www.cnbc.com
However, despite the described long-term sentiment, we may have entered into a short-time rebound phase for the US and European stock markets. The USD/SEK has weakened slightly, and, above all, the US 2-year and 10-year Treasury yields recoiled by 9 and 14 bps on Monday, 3 October. The stock market is starting to price in a recession. In our view, the 2-year US Treasury rate is a better leading indicator of inflation expectations compared to the 10-year rate. Today’s exceptionally high inflation rate is expected to decline sooner or later. We have seen a few signs of lower raw material and transportation costs lately. After all, how should consumers afford all these increasing prices? They must adopt and decrease their spending and consumption accordingly.
US 2 Year Treasury yield (in %), a daily one-year price chart
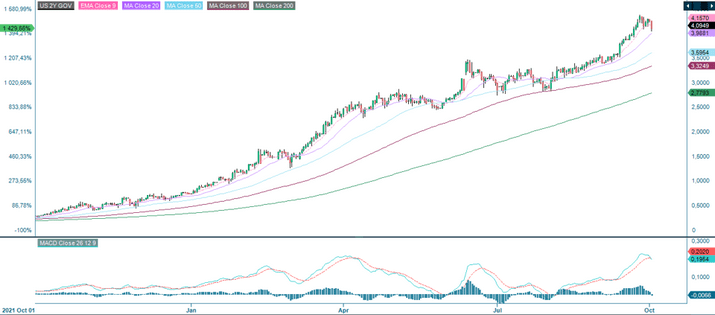
Source: Infront. Note: Past performance is not a reliable indicator of future results.
The USD has also fallen back slightly, about 3% against the SEK, in the past week. A rising USD usually means a falling stock market and vice versa.
So how should you position yourself if you believe in a short-term interest rate cooling? Sector-wise, it's about property companies rather than banks. But we think the Nasdaq index also looks heavily oversold. This is where higher Price/Earnings (P/E)- multiples come into play, as a more significant proportion of technology companies' profits are expected to materialise further down the line. Lower interest rates= lower return requirements and higher p/e ratios, all else equal. This means that the Nasdaq should do better than the Dow Jones in particular, but also to some extent than the S&P500 index (considering that the latter contains some 25% of FANG stocks).
Nasdaq Index (in USD), a daily one-year share price chart

Source: Infront and Carlsquare. Note: Past performance is not a reliable indicator of future results.
Technically, the Nasdaq has rebounded to 10,740 at the time of writing, some 0.9% higher than the low of 10,646 reached on 16 June. Today's level is thus close to support (albeit it looks very fragile). The closest the Nasdaq was to today’s price levels was in October-November 2020, after a quick rebound from the Covid pandemic bottom in March 2020.
Nasdaq Index (in USD), a weekly five-year share price chart

Source: Infront and Carlsquare. Note: Past performance is not a reliable indicator of future results.
The full name for abbreviations used in the previous text:
EMA 9: 9-day exponential moving average
Fibonacci: There are several Fibonacci lines used in technical analysis. Fibonacci numbers are a sequence of numbers in which each successive number is the sum of the two previous numbers.
MA20: 20-day moving average
MA50: 50-day moving average
MA100: 100-day moving average
MA200: 200-day moving average
MACD: Moving average convergence divergence
Risiko
Ekstern forfatter:
Denne informasjonen er utelukkende på gjesteforfatterens ansvar og representerer ikke nødvendigvis oppfatningen til Bank Vontobel Europe AG eller noe annet selskap i Vontobel Group. Den videre utviklingen av indeksen eller et selskap samt aksjekursen avhenger av en lang rekke selskaps-, gruppe- og sektorspesifikke samt økonomiske faktorer. Hver investor må ta hensyn til risikoen for kurstap i investeringsbeslutningen. Vær oppmerksom på at investering i disse produktene ikke vil generere løpende inntekter.
Produktene er ikke kapitalbeskyttet, i verste fall er et totalt tap av investert kapital mulig. Ved insolvens av utstederen og garantisten, bærer investoren risikoen for totaltap av sin investering. I alle fall bør investorer merke seg at tidligere resultater og/eller analytikeres meninger ikke er en tilstrekkelig indikator på fremtidig ytelse. Ytelsen til de underliggende elementene avhenger av en rekke økonomiske, entreprenørielle og politiske faktorer som bør tas i betraktning i dannelsen av en markedsforventning.
Disclaimer:
Denne informasjonen er verken et investeringsråd eller en investerings- eller investeringsstrategianbefaling, men en annonse. Den fullstendige informasjonen om handelsproduktene (verdipapirene) nevnt her, spesielt strukturen og risikoene knyttet til en investering, er beskrevet i basisprospektet, sammen med eventuelle tillegg, samt de endelige vilkårene. Grunnprospektet og de endelige vilkårene utgjør de eneste bindende salgsdokumentene for verdipapirene og er tilgjengelige under produktlenkene. Det anbefales at potensielle investorer leser disse dokumentene før de tar noen investeringsbeslutning. Dokumentene og nøkkelinformasjonsdokumentet er publisert på nettsiden til utstederen, Vontobel Financial Products GmbH, Bockenheimer Landstrasse 24, 60323 Frankfurt am Main, Tyskland, på prospectus.vontobel.com og er gratis tilgjengelig fra utstederen. Godkjenningen av prospektet skal ikke forstås som en godkjenning av verdipapirene. Verdipapirene er produkter som ikke er enkle og kan være vanskelige å forstå. Denne informasjonen inkluderer eller er relatert til tall for tidligere resultater. Tidligere resultater er ikke en pålitelig indikator på fremtidig ytelse.