Bottom fishing for oil in murky waters


The parabolic rise in US interest rates and the US dollar is taking its toll on international financial markets. Below we show the correlation between S&P500 (SPX) and the USD.
U.S Dollar Index (DXY), over five years

Source: Stockcharts and Carlsquare. Note: Past performance is not a reliable indicator of future results.
The oil price is no exception and Brent Futures are down some seven per cent this month. Hence, the downtrend since the end of June continues. However, there have been some upward moves of around ten per cent each along the way, notably in July and August.
Brent Futures are now trading close to the floor of the trend channel and in recent days seem to have bounced off this support. Is it the beginning of another substantial countertrend move like those we have seen previously?
Brent Crude Oil (in USD), daily 12-month price chart
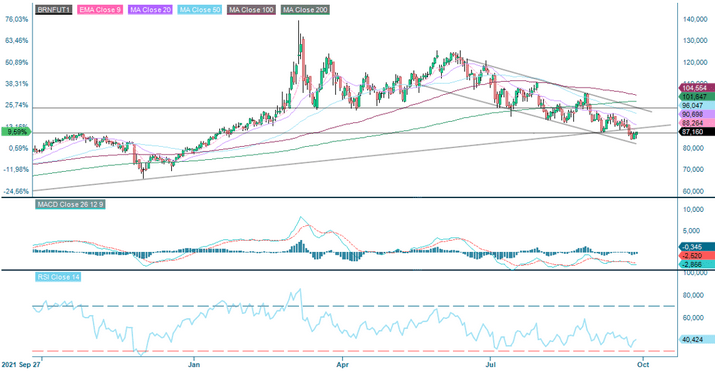
Source: Infront and Carlsquare. Note: Past performance is not a reliable indicator of future results.
For this to happen the dollar is a major factor as illustrated above. At some point dollar appreciation will come to a pause, perhaps following central bank action or “Plaza accord,” however timing is hard to predict. When it happens, equity markets, but also oil, should rally.
Regardless, oil has a relative “advantage” to, e.g., equities as current geopolitical concerns should help underpin the price. There are no signs of a conclusion to the war in Ukraine yet, quite the opposite. The energy crisis in Europe continues and the supply of natural gas is constrained, to say the least. In relative terms, oil looks rather cheap.
From a technical perspective, the oil price is still in a negative trend below MA 200. We believe the level of around USD 85 is quite important as it represents the high of last year. Further below the weekly MA100 of USD 81 is a first target in a negative scenario. In a bull scenario, we see a bear market rally to USD 96 as feasible.
Brent Crude Oil (in USD), five-year chart from September 2017 to September 2022

Source: Infront and Carlsquare. Note: Past performance is not a reliable indicator of future results.
The full name for abbreviations used in the previous text:
EMA 9: 9-day exponential moving average
Fibonacci: There are several Fibonacci lines used in technical analysis. Fibonacci numbers are a sequence of numbers in which each successive number is the sum of the two previous numbers.
MA20: 20-day moving average
MA50: 50-day moving average
MA100: 100-day moving average
MA200: 200-day moving average
MACD: Moving average convergence divergence
Risiko
Ekstern forfatter:
Denne informasjonen er utelukkende på gjesteforfatterens ansvar og representerer ikke nødvendigvis oppfatningen til Bank Vontobel Europe AG eller noe annet selskap i Vontobel Group. Den videre utviklingen av indeksen eller et selskap samt aksjekursen avhenger av en lang rekke selskaps-, gruppe- og sektorspesifikke samt økonomiske faktorer. Hver investor må ta hensyn til risikoen for kurstap i investeringsbeslutningen. Vær oppmerksom på at investering i disse produktene ikke vil generere løpende inntekter.
Produktene er ikke kapitalbeskyttet, i verste fall er et totalt tap av investert kapital mulig. Ved insolvens av utstederen og garantisten, bærer investoren risikoen for totaltap av sin investering. I alle fall bør investorer merke seg at tidligere resultater og/eller analytikeres meninger ikke er en tilstrekkelig indikator på fremtidig ytelse. Ytelsen til de underliggende elementene avhenger av en rekke økonomiske, entreprenørielle og politiske faktorer som bør tas i betraktning i dannelsen av en markedsforventning.
Disclaimer:
Denne informasjonen er verken et investeringsråd eller en investerings- eller investeringsstrategianbefaling, men en annonse. Den fullstendige informasjonen om handelsproduktene (verdipapirene) nevnt her, spesielt strukturen og risikoene knyttet til en investering, er beskrevet i basisprospektet, sammen med eventuelle tillegg, samt de endelige vilkårene. Grunnprospektet og de endelige vilkårene utgjør de eneste bindende salgsdokumentene for verdipapirene og er tilgjengelige under produktlenkene. Det anbefales at potensielle investorer leser disse dokumentene før de tar noen investeringsbeslutning. Dokumentene og nøkkelinformasjonsdokumentet er publisert på nettsiden til utstederen, Vontobel Financial Products GmbH, Bockenheimer Landstrasse 24, 60323 Frankfurt am Main, Tyskland, på prospectus.vontobel.com og er gratis tilgjengelig fra utstederen. Godkjenningen av prospektet skal ikke forstås som en godkjenning av verdipapirene. Verdipapirene er produkter som ikke er enkle og kan være vanskelige å forstå. Denne informasjonen inkluderer eller er relatert til tall for tidligere resultater. Tidligere resultater er ikke en pålitelig indikator på fremtidig ytelse.