Bellwether Apple could be the next shoe dropping

The Apple share has been relatively resilient despite the turbulent equity markets in 2022.
The Apple share has been relatively resilient despite the turbulent equity markets in 2022. It also led the way in the recent bear market rally while other important FAANG stocks such as Alphabet and Meta lagged on concerns of slowing revenue growth. In fact, during the summer, the shares traded close to all-time highs.
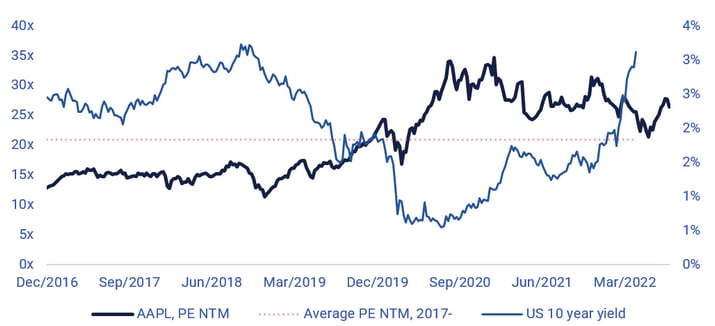
While Apple is a formidable business, consumers worldwide are under severe pressure from rising inflation and interest rates. Hence, we see a risk of Apple running into growth headwinds just like its’ Big Tech peers. In contrast to, e.g., Meta and Alphabet, the valuation is also still quite high from a historical perspective, especially considering the rise in interest rates. In 2018, when the ten-year US Treasury rate was also above three per cent, the Price/earnings (PE) ratio was around 15x, well below the current ratio of some 25x.
Apple PE NTM (Next Twelve Months) versus US 10-year Treasury yield, all in USD
From a technical perspective, the Apple share recently broke below the rising support line of the upward move that started at the end of June. It is now once again trading below MA200. We would not rule out a short-term positive bounce at this point after the recent share price weakness. However, if this long-term support is not regained soon, there is likely further volatility ahead. An ominous sign is that Nasdaq also is breaking down below its technical support.
Next week on September 7, Apple will be hosting a release event, which we would expect to revolve around iPhone 14, and there are rumours of, e.g., satellite phone functionality. However, share price reactions to similar release events in recent years have been mostly negative, according to Bloomberg, so we would not bet on a strong rebound from release-related news flow.
Apple share (in USD), daily 12-month price chart
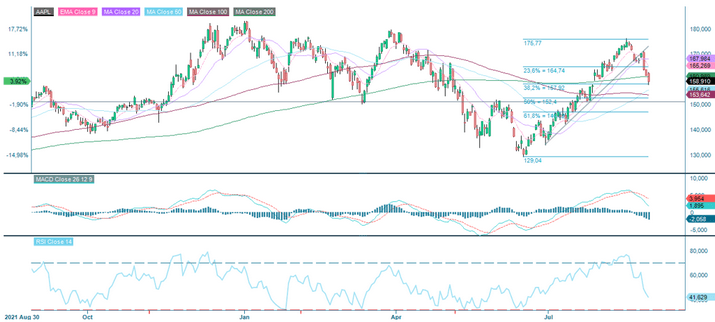
We believe the ~USD 150 level could be the first possible target as this represents March lows and June highs as well as the Fibonacci 50 level of the recent rally.
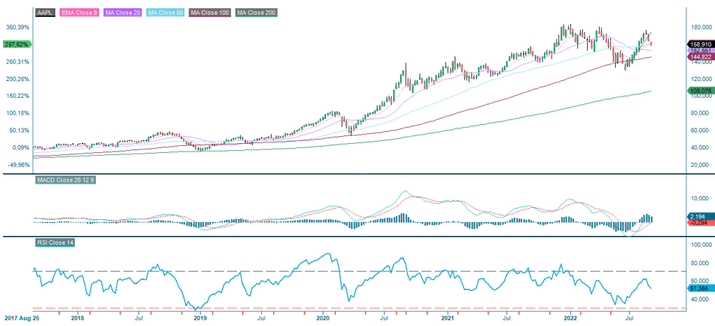
Apple (in USD), August 2017 to August 2022
Relaterte produkter
The full name for abbreviations used in the previous text:
EMA 9: 9-day exponential moving average
Fibonacci: There are several Fibonacci lines used in technical analysis. Fibonacci numbers are a sequence of numbers in which each successive number is the sum of the two previous numbers.
MA20: 20-day moving average
MA50: 50-day moving average
MA100: 100-day moving average
MA200: 200-day moving average
MACD: Moving average convergence divergence
Risiko
Ekstern forfatter:
Denne informasjonen er utelukkende på gjesteforfatterens ansvar og representerer ikke nødvendigvis oppfatningen til Bank Vontobel Europe AG eller noe annet selskap i Vontobel Group. Den videre utviklingen av indeksen eller et selskap samt aksjekursen avhenger av en lang rekke selskaps-, gruppe- og sektorspesifikke samt økonomiske faktorer. Hver investor må ta hensyn til risikoen for kurstap i investeringsbeslutningen. Vær oppmerksom på at investering i disse produktene ikke vil generere løpende inntekter.
Produktene er ikke kapitalbeskyttet, i verste fall er et totalt tap av investert kapital mulig. Ved insolvens av utstederen og garantisten, bærer investoren risikoen for totaltap av sin investering. I alle fall bør investorer merke seg at tidligere resultater og/eller analytikeres meninger ikke er en tilstrekkelig indikator på fremtidig ytelse. Ytelsen til de underliggende elementene avhenger av en rekke økonomiske, entreprenørielle og politiske faktorer som bør tas i betraktning i dannelsen av en markedsforventning.
Disclaimer:
Denne informasjonen er verken et investeringsråd eller en investerings- eller investeringsstrategianbefaling, men en annonse. Den fullstendige informasjonen om handelsproduktene (verdipapirene) nevnt her, spesielt strukturen og risikoene knyttet til en investering, er beskrevet i basisprospektet, sammen med eventuelle tillegg, samt de endelige vilkårene. Grunnprospektet og de endelige vilkårene utgjør de eneste bindende salgsdokumentene for verdipapirene og er tilgjengelige under produktlenkene. Det anbefales at potensielle investorer leser disse dokumentene før de tar noen investeringsbeslutning. Dokumentene og nøkkelinformasjonsdokumentet er publisert på nettsiden til utstederen, Vontobel Financial Products GmbH, Bockenheimer Landstrasse 24, 60323 Frankfurt am Main, Tyskland, på prospectus.vontobel.com og er gratis tilgjengelig fra utstederen. Godkjenningen av prospektet skal ikke forstås som en godkjenning av verdipapirene. Verdipapirene er produkter som ikke er enkle og kan være vanskelige å forstå. Denne informasjonen inkluderer eller er relatert til tall for tidligere resultater. Tidligere resultater er ikke en pålitelig indikator på fremtidig ytelse.