Gold could benefit from higher inflation

Fed chairman Jerome Powell lowered investors' hopes on Friday, August 26th, by saying the central bank will have to raise policy rates to curb inflation.
Fed chairman Jerome Powell lowered investors' hopes on Friday, August 26th, by saying the central bank will have to raise policy rates to curb inflation. The yield on a two-year US Treasury bond rose to 3.38%, higher than the equivalent 10-year rate (3.11%), indicating that the bond market is pricing in a recession in the US. This is in line with Powell's observation that a weaker economy and labour market are needed to bring down the rate of inflation and that this could be painful for some households.
The fall in stock prices has erased some of the earlier gains in July in the stock markets, especially in Europe (save the FTSE index in London). Technically, the chart for the leading S&P500 index in New York looks ugly now, with a continued decline looking more likely than vice versa. Buyers need to come into the market and prove otherwise, and it didn't happen on Monday, August 29th.
The HYG ETF, which reflects investors' risk appetite for US junk bonds, is, like equity markets, still in a downtrend.
US HYG ETF (in USD), a daily one-year price chart

On Thursday, 1 September, the August Purchasing Managers' Index will be released from the US, but also from Japan, China, the UK, Germany, France, Italy, Spain, etc. The Purchasing Managers' Index should be above 50 to indicate continued growth in the economy. In the case of the United States (ISM for manufacturing), expectations are 52.0.
This will be followed on Friday, 2 September, by the US employment report for August and an unemployment figure. Last time (in July), the US labour market over-performed. This time, the forecast for Non-Farm Payrolls is for 285K new jobs, which would be just over half of the 528K new jobs posted in July. Expectations have come down, and there may be a chance for a positive surprise again. At the same time, there is a risk that a strong labour market could trigger further increases in interest rates.
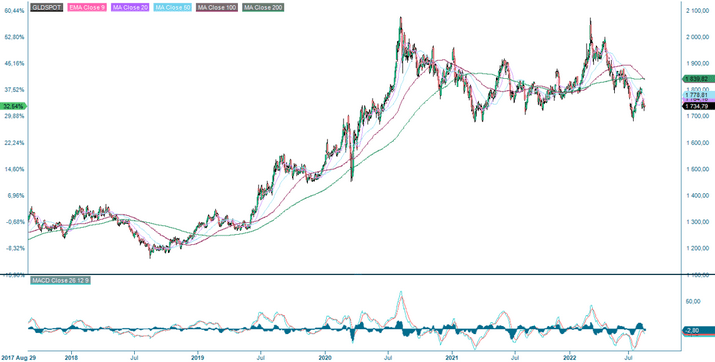
Hence, it can be challenging to see the stock market turning from Bear to Bull in the short term. Rising interest rates seem to be preventing that. Therefore, an investment in gold, could be a classic hedge in times of high inflation. Notably, the gold price performed very strongly in the early 1970s in the context of the oil crisis linked to the Yom Kippur War and the high inflation that followed, which given low GDP growth during the same period, became stagflation.
GOLD Spot (in USD per troy ounce), a weekly five-year price chart

Technically, the USD 1700 level looks like a floor for the gold price. The rising USD has also depressed the price of USD-denominated commodities (including Gold), all else equal.
GOLD Spot (in USD per troy ounce), a weekly five-year price chart
The full name for abbreviations used in the previous text:
EMA 9: 9-day exponential moving average
Fibonacci: There are several Fibonacci lines used in technical analysis. Fibonacci numbers are a sequence of numbers in which each successive number is the sum of the two previous numbers.
MA20: 20-day moving average
MA50: 50-day moving average
MA100: 100-day moving average
MA200: 200-day moving average
MACD: Moving average convergence divergence
Risiko
Ekstern forfatter:
Denne informasjonen er utelukkende på gjesteforfatterens ansvar og representerer ikke nødvendigvis oppfatningen til Bank Vontobel Europe AG eller noe annet selskap i Vontobel Group. Den videre utviklingen av indeksen eller et selskap samt aksjekursen avhenger av en lang rekke selskaps-, gruppe- og sektorspesifikke samt økonomiske faktorer. Hver investor må ta hensyn til risikoen for kurstap i investeringsbeslutningen. Vær oppmerksom på at investering i disse produktene ikke vil generere løpende inntekter.
Produktene er ikke kapitalbeskyttet, i verste fall er et totalt tap av investert kapital mulig. Ved insolvens av utstederen og garantisten, bærer investoren risikoen for totaltap av sin investering. I alle fall bør investorer merke seg at tidligere resultater og/eller analytikeres meninger ikke er en tilstrekkelig indikator på fremtidig ytelse. Ytelsen til de underliggende elementene avhenger av en rekke økonomiske, entreprenørielle og politiske faktorer som bør tas i betraktning i dannelsen av en markedsforventning.
Disclaimer:
Denne informasjonen er verken et investeringsråd eller en investerings- eller investeringsstrategianbefaling, men en annonse. Den fullstendige informasjonen om handelsproduktene (verdipapirene) nevnt her, spesielt strukturen og risikoene knyttet til en investering, er beskrevet i basisprospektet, sammen med eventuelle tillegg, samt de endelige vilkårene. Grunnprospektet og de endelige vilkårene utgjør de eneste bindende salgsdokumentene for verdipapirene og er tilgjengelige under produktlenkene. Det anbefales at potensielle investorer leser disse dokumentene før de tar noen investeringsbeslutning. Dokumentene og nøkkelinformasjonsdokumentet er publisert på nettsiden til utstederen, Vontobel Financial Products GmbH, Bockenheimer Landstrasse 24, 60323 Frankfurt am Main, Tyskland, på prospectus.vontobel.com og er gratis tilgjengelig fra utstederen. Godkjenningen av prospektet skal ikke forstås som en godkjenning av verdipapirene. Verdipapirene er produkter som ikke er enkle og kan være vanskelige å forstå. Denne informasjonen inkluderer eller er relatert til tall for tidligere resultater. Tidligere resultater er ikke en pålitelig indikator på fremtidig ytelse.