Set up for a rebound in the VIX soon

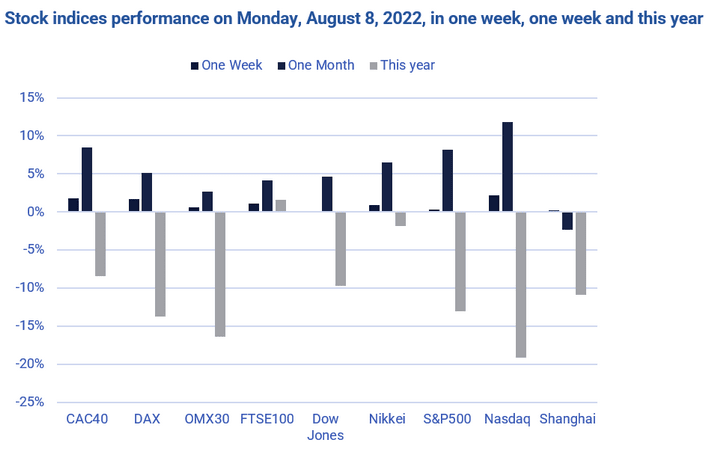
We have seen a summer relief rally in the US and European stock markets. The rise in prices has been highest on the Nasdaq, where information technology companies have delivered solid Q2 reports compared to expectations.
Source: www.di.se,www.cnbc.com
More encouragingly, the price increase in equity markets has been supported by a simultaneous price increase for HYG (a US high credit risk corporate bond ETF). Buying junk bonds at current low levels is mainly a bet on relatively few anticipated bankruptcies going forward, we believe. Financial crises (most recently the Lehman crash of 2008) tend to be associated with prolonged periods of stock market decline.
Five- and ten-year US Treasury yields are broadly at the same levels as at the beginning of July. This follows a strong US report on Friday 5 August with 528,000 additional jobs created in July and only a 3.5% unemployment rate. Meanwhile, we have seen a downward price trend in commodities recently, which on the contrary should trigger lower interest rates.
The VIX index, which measures market volatility in the US, has come down sharply during July to what looks like a position with a strong possibility of a turn to the upside again. Autumns through October usually bring some weak and turbulent periods for the stock market.
Ukraine is preparing a counter-offensive against the port city of Kherson. The war with Russia cannot expected to be over until the turn of the year at the earliest. In the meantime, Europe (the EU and allied Western countries) should reduce its heavy dependence on Russian gas and oil. Russia, on the other hand, may try to provoke a recession in the EU countries by, for example, restricting access to Russian gas and oil ahead of the upcoming winter. Add to that the risk that Wall Street and European equity analysts may have to lower their corporate earnings forecasts for the second half of 2022, all of which would likely send the VIX index higher from its current low levels.

Source: Infront and Carlsquare. Note: Past performance is not a reliable indicator of future results. Left: Procentage. Right:VIX Index
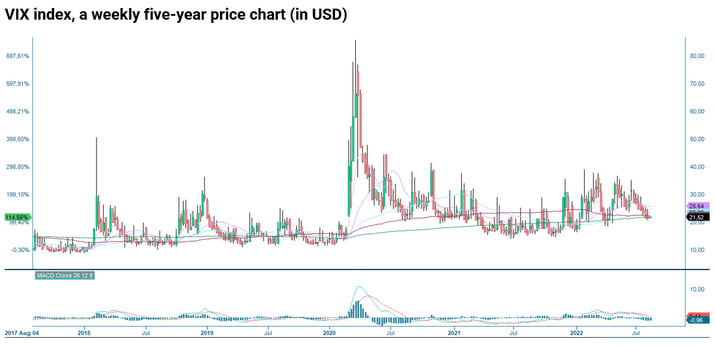
Source: Infront and Carlsquare. Note: Past performance is not a reliable indicator of future results. Left: Procentage. Rights: VIX Index
The full name for abbreviations used in the previous text:
EMA 9: 9-day exponential moving average
Fibonacci: There are several Fibonacci lines used in technical analysis. Fibonacci numbers are a sequence of numbers in which each successive number is the sum of the two previous numbers.
MA20: 20-day moving average
MA50: 50-day moving average
MA100: 100-day moving average
MA200: 200-day moving average
MACD: Moving average convergence divergence
Risiko
Ekstern forfatter:
Denne informasjonen er utelukkende på gjesteforfatterens ansvar og representerer ikke nødvendigvis oppfatningen til Bank Vontobel Europe AG eller noe annet selskap i Vontobel Group. Den videre utviklingen av indeksen eller et selskap samt aksjekursen avhenger av en lang rekke selskaps-, gruppe- og sektorspesifikke samt økonomiske faktorer. Hver investor må ta hensyn til risikoen for kurstap i investeringsbeslutningen. Vær oppmerksom på at investering i disse produktene ikke vil generere løpende inntekter.
Produktene er ikke kapitalbeskyttet, i verste fall er et totalt tap av investert kapital mulig. Ved insolvens av utstederen og garantisten, bærer investoren risikoen for totaltap av sin investering. I alle fall bør investorer merke seg at tidligere resultater og/eller analytikeres meninger ikke er en tilstrekkelig indikator på fremtidig ytelse. Ytelsen til de underliggende elementene avhenger av en rekke økonomiske, entreprenørielle og politiske faktorer som bør tas i betraktning i dannelsen av en markedsforventning.
Disclaimer:
Denne informasjonen er verken et investeringsråd eller en investerings- eller investeringsstrategianbefaling, men en annonse. Den fullstendige informasjonen om handelsproduktene (verdipapirene) nevnt her, spesielt strukturen og risikoene knyttet til en investering, er beskrevet i basisprospektet, sammen med eventuelle tillegg, samt de endelige vilkårene. Grunnprospektet og de endelige vilkårene utgjør de eneste bindende salgsdokumentene for verdipapirene og er tilgjengelige under produktlenkene. Det anbefales at potensielle investorer leser disse dokumentene før de tar noen investeringsbeslutning. Dokumentene og nøkkelinformasjonsdokumentet er publisert på nettsiden til utstederen, Vontobel Financial Products GmbH, Bockenheimer Landstrasse 24, 60323 Frankfurt am Main, Tyskland, på prospectus.vontobel.com og er gratis tilgjengelig fra utstederen. Godkjenningen av prospektet skal ikke forstås som en godkjenning av verdipapirene. Verdipapirene er produkter som ikke er enkle og kan være vanskelige å forstå. Denne informasjonen inkluderer eller er relatert til tall for tidligere resultater. Tidligere resultater er ikke en pålitelig indikator på fremtidig ytelse.