Poorer harvests could impact corn prices

The market has discounted a corn supply surplus following the ongoing harvests in the US, Brazil, and China. However, the harvest could be worse than expected, and Russia continues to disrupt Ukrainian exports. Equity markets are awaiting the release of US Nonfarm Payrolls on Friday 6th October.
Case of the week: Corn
Last Friday's USDA grain stocks report sent corn prices lower as grain stocks were almost unchanged from a year ago, falling just 1%. The commodity is in a price-sensitive phase, with Brazil beating the US regarding Chinese exports.
The largest corn producer in the US released a wealth of data last Friday, 29 September, in the form of the US Grain Stocks report. According to the "World Agricultural Supply and Demand Estimates" (WASDE) report, expectation for the 22/23 ending stocks was 1.44 billion bushels, ranging from 1.32 to 1.51 billion bushels. Grain stocks reported on Friday were at the low end of estimates at 1.36 billion bushels, with on-farm stocks at 605 million bushels, down 1% for the former and up 19% for the latter year-on-year. Despite total corn stocks being broadly unchanged from a year ago, corn futures saw a slight sell-off, much in line with the other grain stocks in the report.
We are in the middle of the US corn harvest season, with Brazil's second crop just finishing and China's summer and northeast spring harvests beginning. Regarding demand from the latter, a major corn importer, Brazil has outperformed the US regarding exports. In addition, the Chinese harvest is expected to be a record 285 million tons. Thanks mainly to favourable weather in the northeast, production is expected to be 2.9% higher than last year's harvest.
The balance of supply and demand led traders to increase their net short position in CBOT corn from 144,815 contracts to 168,606 contracts week-on-week in the week ending 26 September. The short position is the largest since August 2020 and is close to the 2016 record for the most bearish outlook.
Corn prices were pressured by easing demand and rising supplies from Brazil and expected supplies from China. The US grain stocks report showed little change in domestic supply, but prices slid lower along with the other grains covered. Bearish traders are pressuring the price as they add to their short position. The outlook is bearish, near record levels. However, when everyone is most cautious, there is also an opportunity to go long. Further Russian disruptions to Ukrainian corn exports, bad weather in China or rising Brazilian prices could push the price higher.
Relaterte produkter
Corn (USD/BU), one-year daily chart

Corn (USD/BU), five-year weekly chart

Macro comments
Late Saturday, 30 September, the US Senate passed a stopgap budget to continue funding federal operations for 45 days. This gives politicians additional time to agree on a longer-term US budget.
In China, the official industrial PMI rose to 50.2 in September from 49.7 in August. The service PMI rose to 51.7 from 51.0. However, Caixin's PMI- data fell to 50.6 from 51.0, and the services PMI fell to 50.2 from 51.8. Given the ongoing domestic property crisis, the Chinese PMI figures look suspiciously strong since it should cause consumer confidence and solvency to plummet.
There were mixed results from Japan from the Tankan data. The report showed improvements in Q3 2023, while the industry PMI fell to 48.5 in September from 49.6.
According to preliminary data, eurozone inflation fell to 4.3% in September from 5.2% in August. This was well below market expectations of 4.5%. Core inflation fell to 4.5% from 5.3%, well below consensus expectations of 4.8%. During the late summer and early autumn of this year, the oil price has risen by around 25%, which is why these prices will likely contribute to rising inflation in early 2024. However, the ECB focuses on core inflation (HICP excluding energy and food prices).
We are approaching the Q3 earnings season. It will largely kick off on 13 October 2023 with Q3 reports from JP Morgan Chase, United Health Group, BlackRock, Citigroup, and Wells Fargo. Next week, on 16 October, there will be a Q3 report from Charles Schwab, followed on 17 October by Q3 reports from Bank of America, Johnson & Johnson, Lockheed Martin, Prologis, and Goldman Sachs and by Q3 reports from Netflix, Tesla, IBM, Procter Gamble, Abbott Laboratories and Morgan Stanley on 18 October. Wall Street analysts forecast that earnings for the S&P500 companies should decline by 0.1% in Q3 2023 and increase by 8.3% in Q4 2023.
Wednesday, 4 October, service Purchasing Managers' Indices (PMIs) from Japan, Sweden, Spain, Italy, France, Germany, the UK, and the USA are due. From Germany, there will also be VDMA Machinery Orders for August. From the US, ADP (National Emplozment Report) private employment for September, industrial orders for August and weekly oil inventories (DOE) are due.
On Thursday, 5 October, Germany reports its trade balance, while France announces industrial production for August. From the US, the Challenger employment termination statistics for September, the trade balance for August, and initial jobless weekly claims are due.
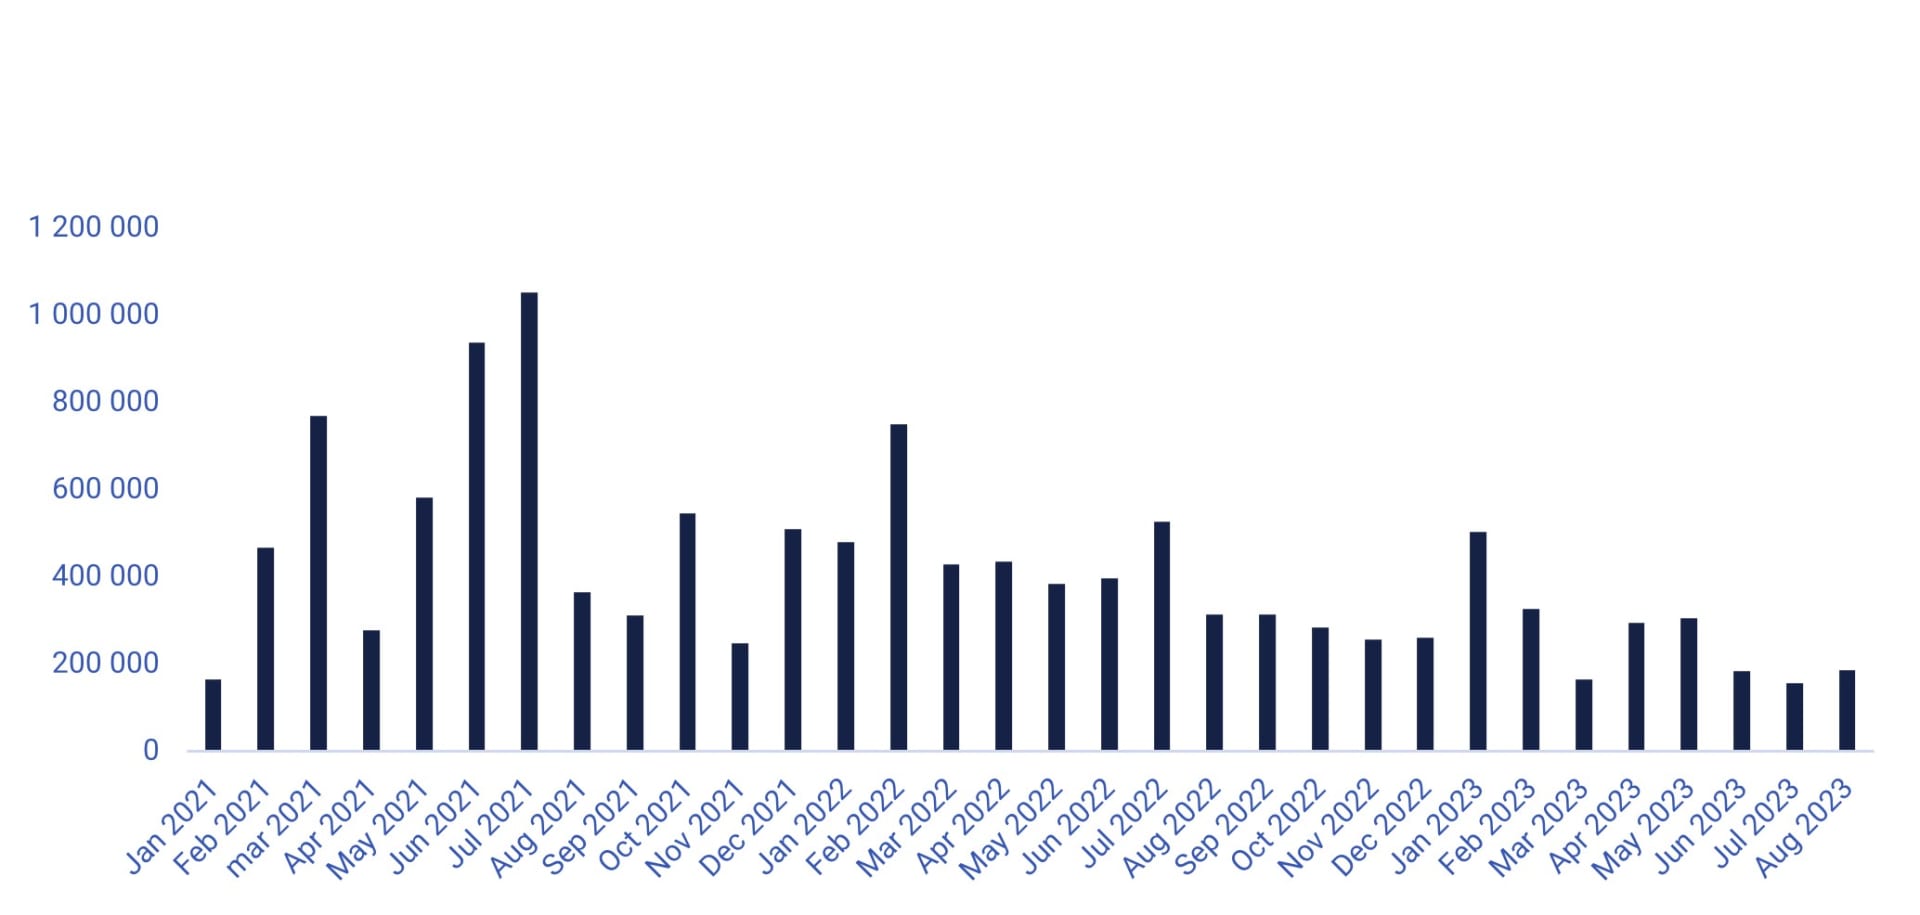
On Friday, the 6th of October, the number of new jobs created in the US in September is expected to have been 163,000, down from 187,000 in August. The market will also be looking at the rate of wage growth, which is expected to have been 0.3% in September and 4.3% annually.
US Non-farm payrolls (new jobs), January 2021 to August 2023
Consolidation ahead of Friday’s US job figures
S&P 500 is consolidating just above support made up by MA200, currently at 4,220. Interest rates are ticking up, but the RSI is close to oversold. However, that is not a sell signal stand-alone. The market seems to need more information to digest to find its direction. Friday’s US job figures are always important and could be new information. Also, note US initial jobless claims on Thursday, 5 October.
S&P 500 (in USD), one-year daily chart

S&P 500 (in USD), weekly five-year chart

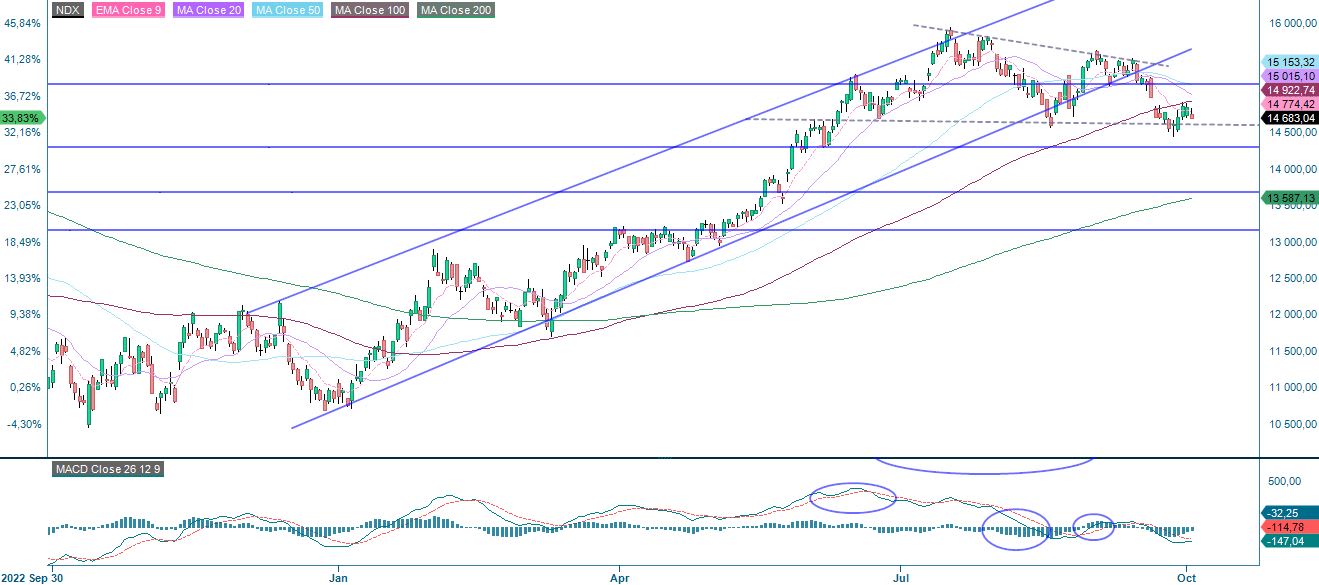
Interestingly, The Nasdaq 100 is holding up well despite the substantial increase in the 10-year US Treasury yield. The Index tried to retake MA100 but failed. Any large moves ahead of the US job figures are not expected.
Relaterte produkter
Nasdaq 100 (in USD), one-year daily chart
Nasdaq 100 (in USD), weekly five-year chart

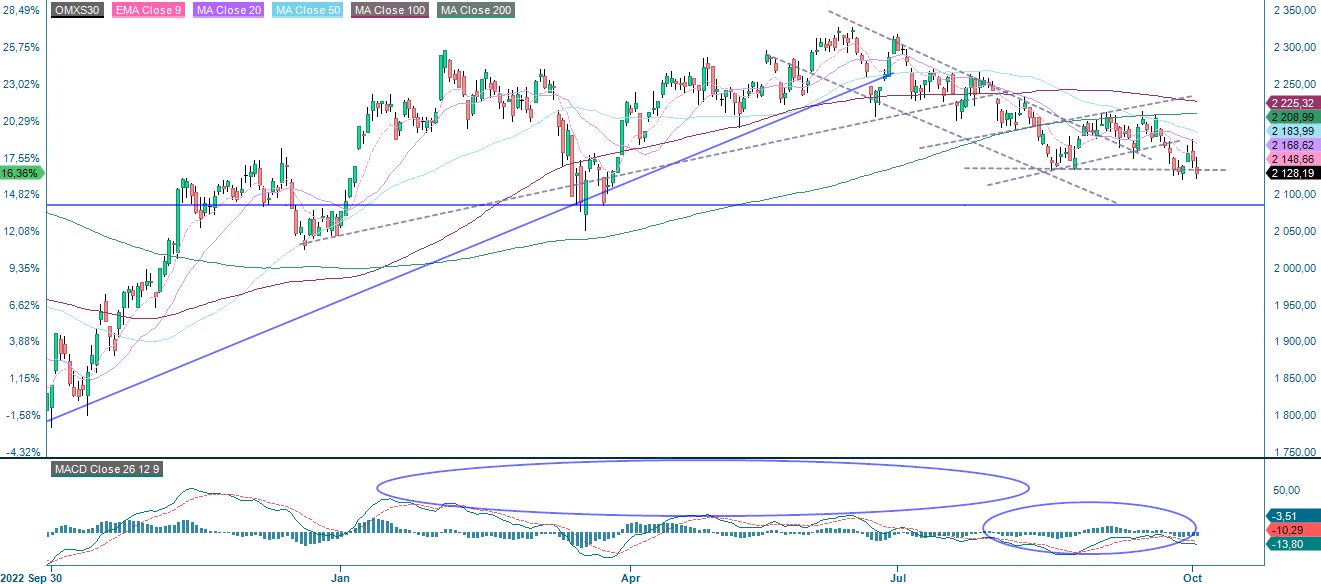
In Sweden, OMXS30 attempted to retake MA20 but is not back at support of around 2,130. US job figures are also likely to affect the Swedish stock market. Thus, we do not foresee any larger move ahead of Friday, 6 October.
OMXS30 (in SEK), one-year daily chart
OMXS30 (in SEK), weekly five-year chart

DAX is not looking so fresh. It may continue to go towards the even 15,000-level ahead of the US job figures.
DAX (in EUR), one-year daily chart

DAX (in EUR), weekly five-year chart

Were the currency interventions from the Swedish central bank sufficient?
Swedish Riksbanken was trying to strengthen the SEK by selling its foreign currency reserves. This did indeed strengthen the SEK, as shown in the chart below. Were the interventions enough to continue to strengthen the SEK? If so, the strong support at 11.5 is the first to be broken on the downside, followed by levels just north of 11.0.
The underlying of the instruments below is SEK per 1 EUR.
EUR/SEK, one-year daily chart

EUR/SEK, weekly five-year chart

The full name for abbreviations used in the previous text:
EMA 9: 9-day exponential moving average
Fibonacci: There are several Fibonacci lines used in technical analysis. Fibonacci numbers are a sequence in which each successive number is the sum of the two previous numbers.
MA20: 20-day moving average
MA50: 50-day moving average
MA100: 100-day moving average
MA200: 200-day moving average
MACD: Moving average convergence divergence
Risiko
Disclaimer:
Denne informasjonen er verken et investeringsråd eller en investerings- eller investeringsstrategianbefaling, men en annonse. Den fullstendige informasjonen om handelsproduktene (verdipapirene) nevnt her, spesielt strukturen og risikoene knyttet til en investering, er beskrevet i basisprospektet, sammen med eventuelle tillegg, samt de endelige vilkårene. Grunnprospektet og de endelige vilkårene utgjør de eneste bindende salgsdokumentene for verdipapirene og er tilgjengelige under produktlenkene. Det anbefales at potensielle investorer leser disse dokumentene før de tar noen investeringsbeslutning. Dokumentene og nøkkelinformasjonsdokumentet er publisert på nettsiden til utstederen, Vontobel Financial Products GmbH, Bockenheimer Landstrasse 24, 60323 Frankfurt am Main, Tyskland, på prospectus.vontobel.com og er gratis tilgjengelig fra utstederen. Godkjenningen av prospektet skal ikke forstås som en godkjenning av verdipapirene. Verdipapirene er produkter som ikke er enkle og kan være vanskelige å forstå. Denne informasjonen inkluderer eller er relatert til tall for tidligere resultater. Tidligere resultater er ikke en pålitelig indikator på fremtidig ytelse.
Ekstern forfatter:
Denne informasjonen er utelukkende på gjesteforfatterens ansvar og representerer ikke nødvendigvis oppfatningen til Bank Vontobel Europe AG eller noe annet selskap i Vontobel Group. Den videre utviklingen av indeksen eller et selskap samt aksjekursen avhenger av en lang rekke selskaps-, gruppe- og sektorspesifikke samt økonomiske faktorer. Hver investor må ta hensyn til risikoen for kurstap i investeringsbeslutningen. Vær oppmerksom på at investering i disse produktene ikke vil generere løpende inntekter.
Produktene er ikke kapitalbeskyttet, i verste fall er et totalt tap av investert kapital mulig. Ved insolvens av utstederen og garantisten, bærer investoren risikoen for totaltap av sin investering. I alle fall bør investorer merke seg at tidligere resultater og/eller analytikeres meninger ikke er en tilstrekkelig indikator på fremtidig ytelse. Ytelsen til de underliggende elementene avhenger av en rekke økonomiske, entreprenørielle og politiske faktorer som bør tas i betraktning i dannelsen av en markedsforventning.