US dollar benefits from higher oil price

A strong US economy and, more recently, a higher oil price explain much of the US dollar's strength in 2023. After 2020, the inverse relationship between the US Dollar Index and crude oil prices gradually turned positive. The Fed's interest rate decision later today and September Purchasing Managers Index (PMI) figures from France, Germany, the UK and the US on Friday could move markets this week.
Case of the week: A strong US economy and rising oil prices have supported the USD
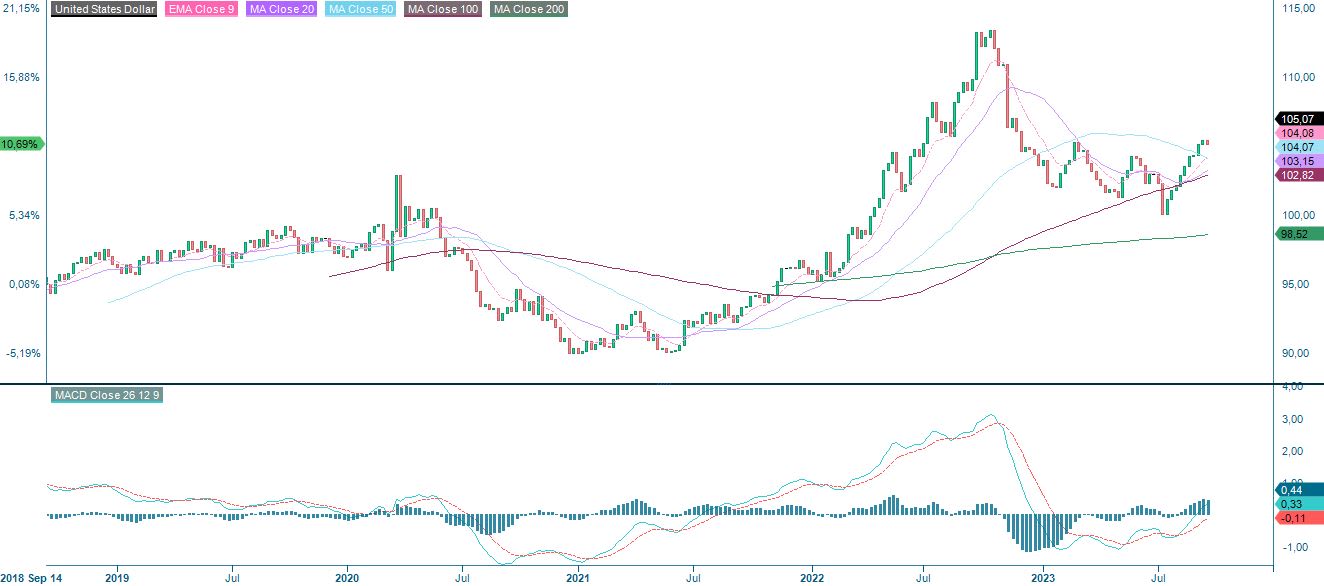
At the beginning of the year, Wall Street consensus belief was that the main line of the foreign exchange market in 2023 would be a "bearish US-dollar", but now it is caught off guard by the strong dollar. The USD fell back briefly this year but then unexpectedly rose, from falling below 100 to surging above 105. On September 8, the US-dollar index broke a rare eight-week winning streak, its longest since 2014.
USD-index (DXY), five-year weekly chart
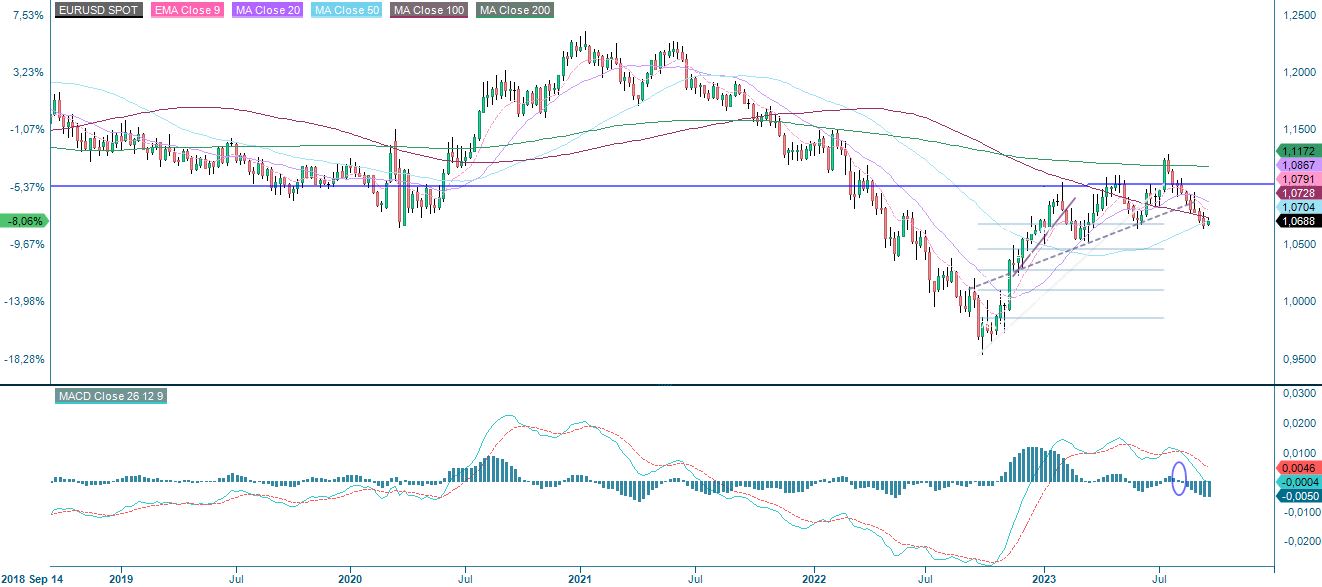
With the dollar's rise, non-US currencies are generally "suffering". Over the past month, the world's major currencies have all fallen against the US dollar, with the euro down more than 5.4% since its July peak. The yen broke through 147 to a 10-month high against the US dollar, and the Chinese yuan and Indian rupee also depreciated to a new cycle low.
Meanwhile, the US domestic economy is under relative pressure. At the same time, Russia's extension of crude oil production cuts increased inflation variables. If U.S. inflation rebounds more than expected, the Federal Reserve could reconsider policy direction, and the U.S. dollar's rally could last longer.
The dollar is stronger than expected because of the resilience of the US economy. After a string of positive economic data in the US in recent weeks, recession bets have plummeted, and the chances of a so-called soft landing for the economy are increasingly likely.
Last week, the US ISM non-manufacturing PMI rebounded sharply to 54.5, and new orders employment is also improving. It has a much smaller impact on GDP than the ISM manufacturing index. However, suppose the indicator is higher than expected. In that case, the US dollar should be considered solid/bullish, while the US dollar should be considered weak/bearish if the indicator turns out lower than expected. Unemployment Insurance Weekly Claims at 220,000 versus expectations of 225,000 suggested that the pace of cooling in the US labour market remains limited and may take longer to reach the Fed's target. The favourable macro data could increase the probability of the Federal Reserve raising interest rates again in Q4 2023, delay the Fed rate cut, and increase the probability of a soft landing of the US economy.
In contrast, it is difficult to be optimistic about the economic situation in Asia and Europe. Eurozone GDP growth was revised from 0.3% to 0.1% in the second quarter of 2023, inflation remained stubborn, and the risk of "stagflation" increased.
Higher oil prices are also supporting a stronger US dollar. A coordinated production cut by Saudi Arabia and Russia earlier this year has contributed to oil prices soaring above $90 per barrel for the first time since November 2022. Soaring oil prices have triggered inflation fears, boosting treasury yields and strengthening the US dollar. Further, the dollar will benefit more when energy costs rise since the United States is a net exporter of oil products.
WTI Oil Price (USD per barrel), five-year weekly chart
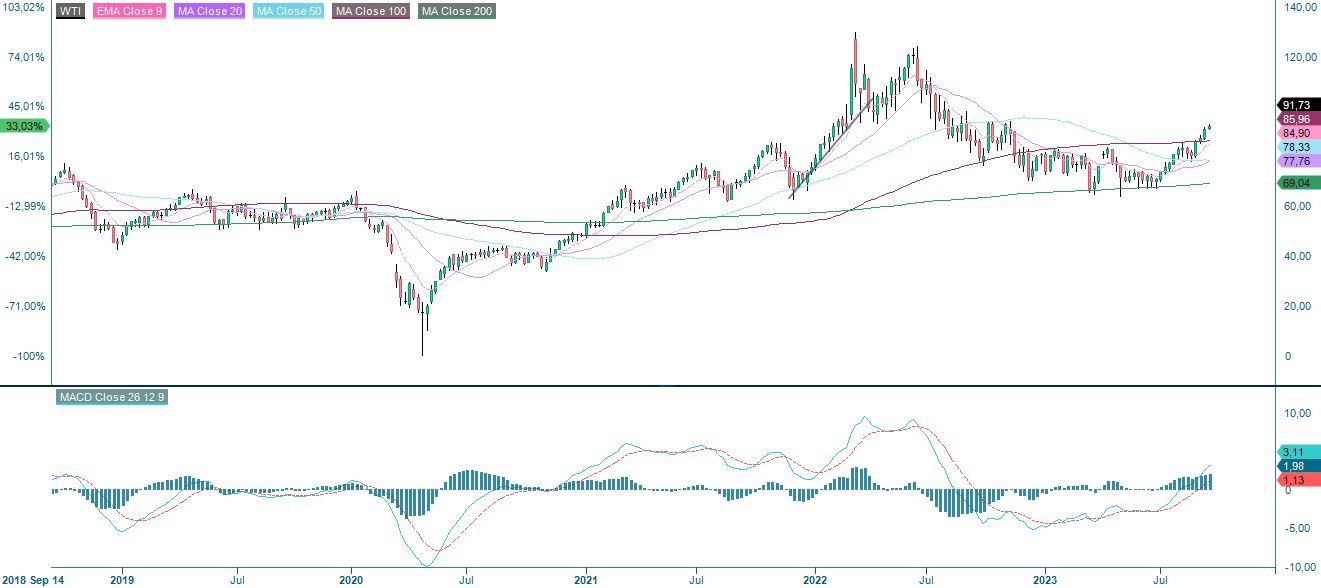
After 2020, the inverse relationship between the US dollar index and crude oil prices has gradually become positive. In other words, the higher the oil price, the stronger the US dollar index. The dollar index can continue strengthening if global oil prices still have room to rise. OPEC's latest forecast suggests that the fourth quarter global crude oil supply shortage will be more than 3 million barrels per day, meaning that oil prices will likely continue to rise.
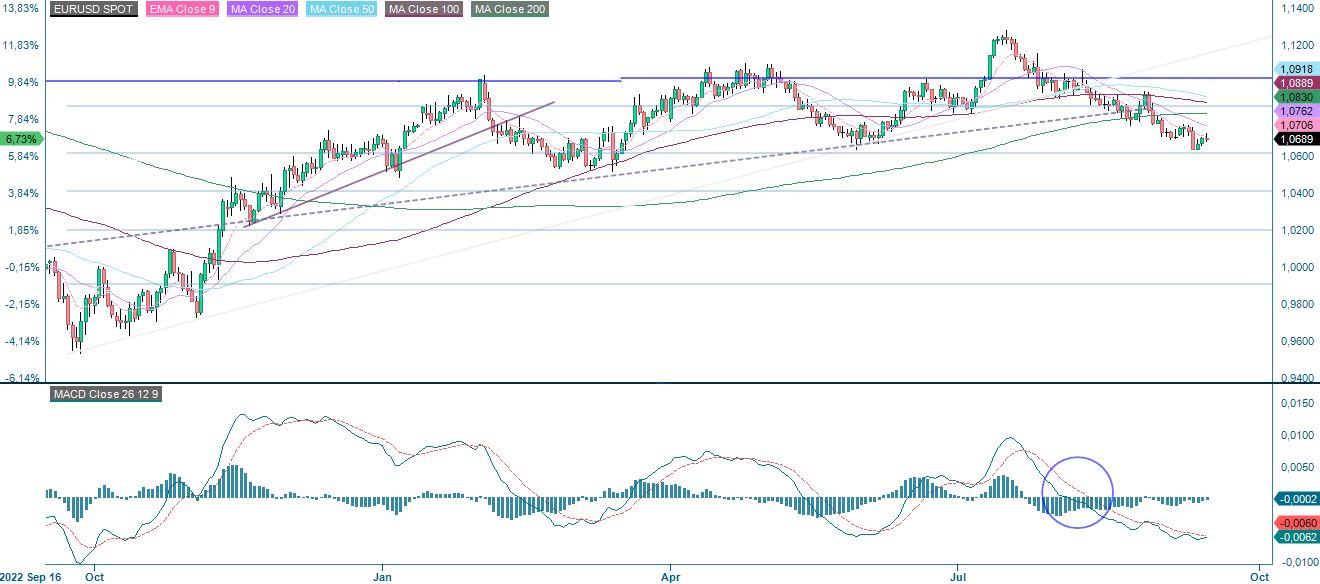
EUR/USD, one-year daily chart
Suppose the recovery of energy inflation promotes the United States CPI, which continues to rise. In that case, it may prompt the Federal Reserve to reconsider its policy rate direction. That could affect the US-dollar rally. Should US inflation begin to fall back, the US dollar interest rate hike cycle has ended, weakening one of the US dollar support factors.
EUR/USD, five-year weekly chart
Macro comments
The ECB raised its deposit rate by 25 basis points to 4.00% on Thursday, 14th September, which aligned with expectations. President Christine Lagarde said that the ECB had probably reached the level of interest rates considered appropriate to dampen inflation. This boosted sentiment on the stock markets.
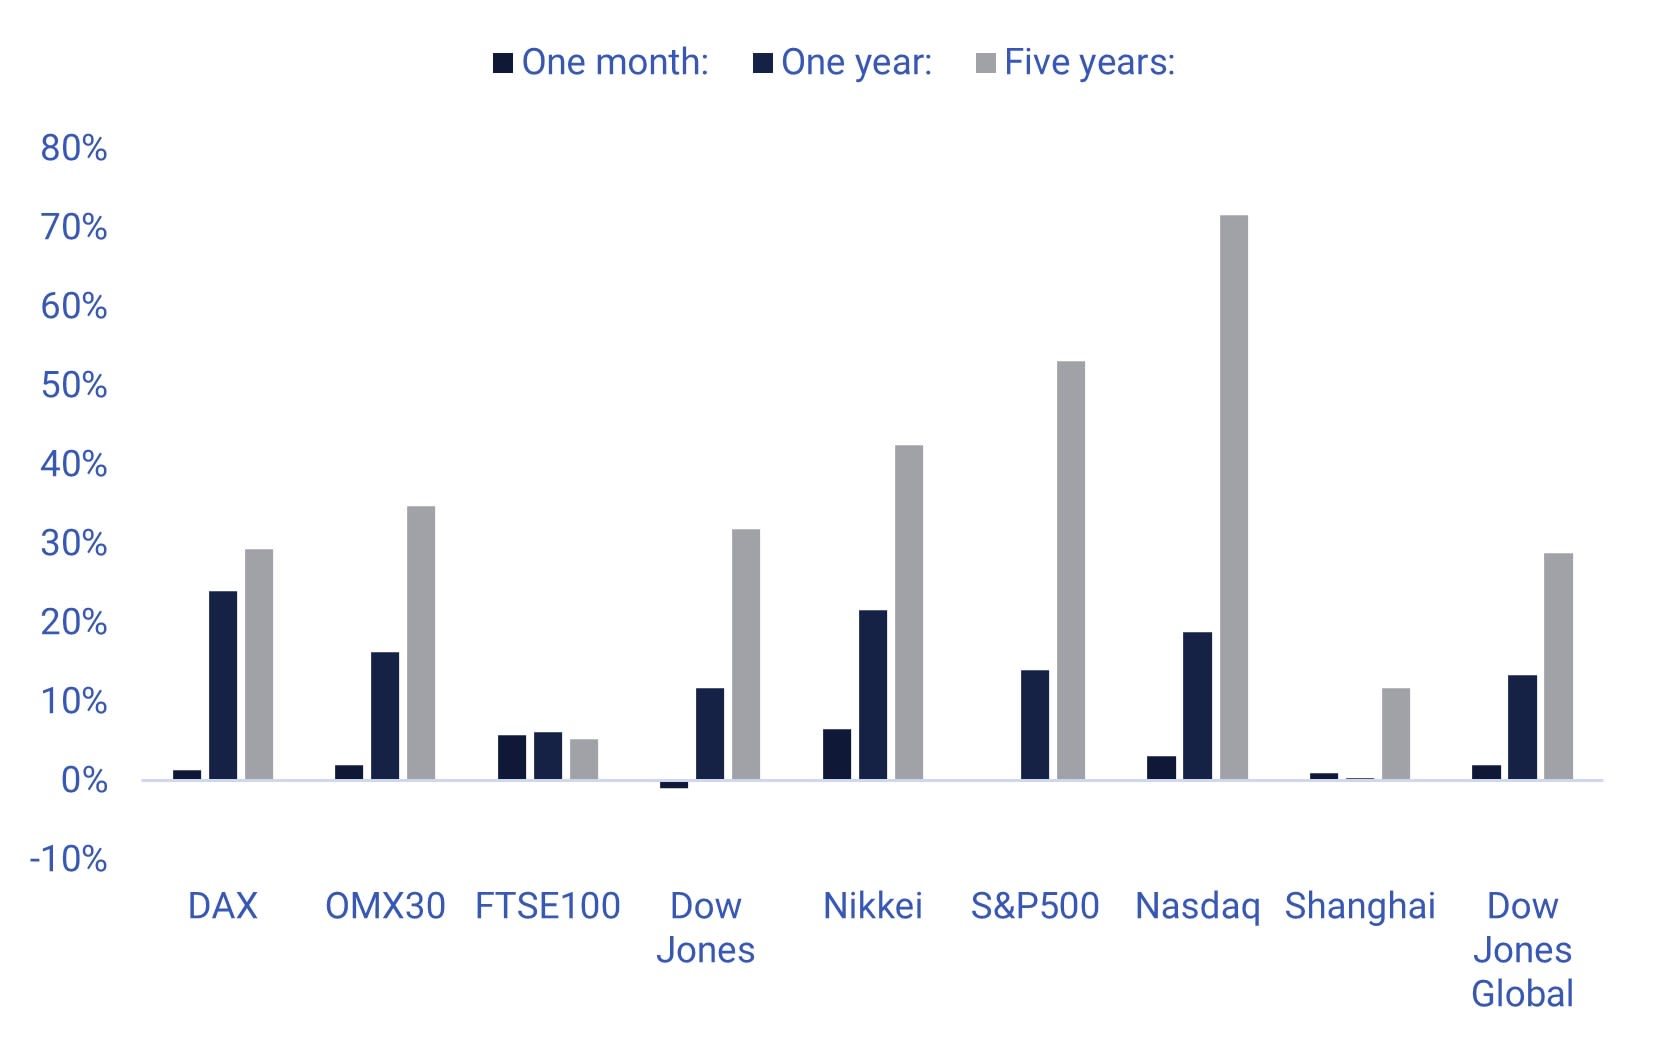
Significant stock indices performance in one month, one year and five years
Relaterte produkter
US equity markets fell on Friday, 15th September. The semiconductor sub-index fell 3% on rumours that Taiwan Semiconductor Manufacturing Company is worried about falling demand. The chip maker was rumoured to ask suppliers to delay deliveries due to lower demand. Most large technology stocks, including Microsoft, Amazon and Meta, fell on these rumours.
Today, Wednesday, 20 September, the Fed makes its interest rate announcement, followed by Powell's press conference (20:00 and 20:30 CET).
On Thursday, 21 September, from the United States, we will receive the Philadelphia Fed index for September, weekly unemployment data, the July household confidence indicator, and existing home sales for August. We also get interest rate announcements from the Bank of England and the central banks of Sweden, Norway, and Switzerland.
The most crucial macro news on Friday, 22 September, is the PMI figures for September from Germany, France, the United Kingdom and the United States.
Risk shifted to the downside ahead of the Fed
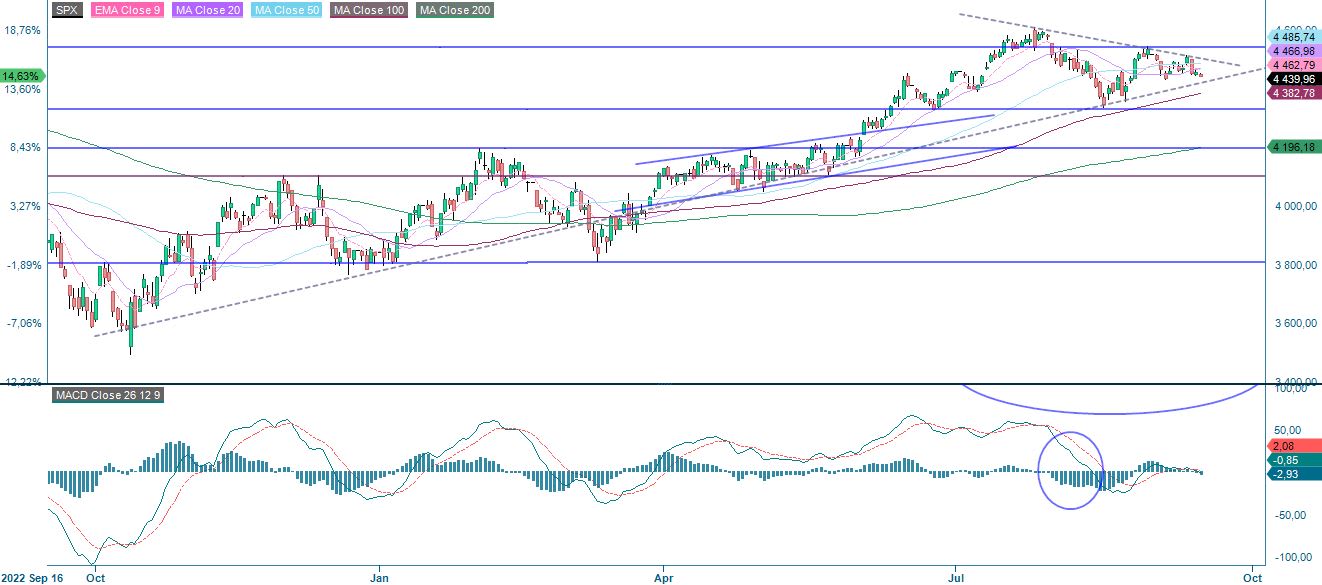
In the US, the S&P 500 is struggling to find a direction ahead of today's rate decision from the Fed. The chart below shows that the S&P 500 consolidates in a neutral wedge formation. If the wedge is broken on the upside, the formation indicates an upward movement of about 250 index points and vice versa. Note MACD in the weekly chart that has generated a soft sell signal.
S&P 500 (in USD), one-year daily chart
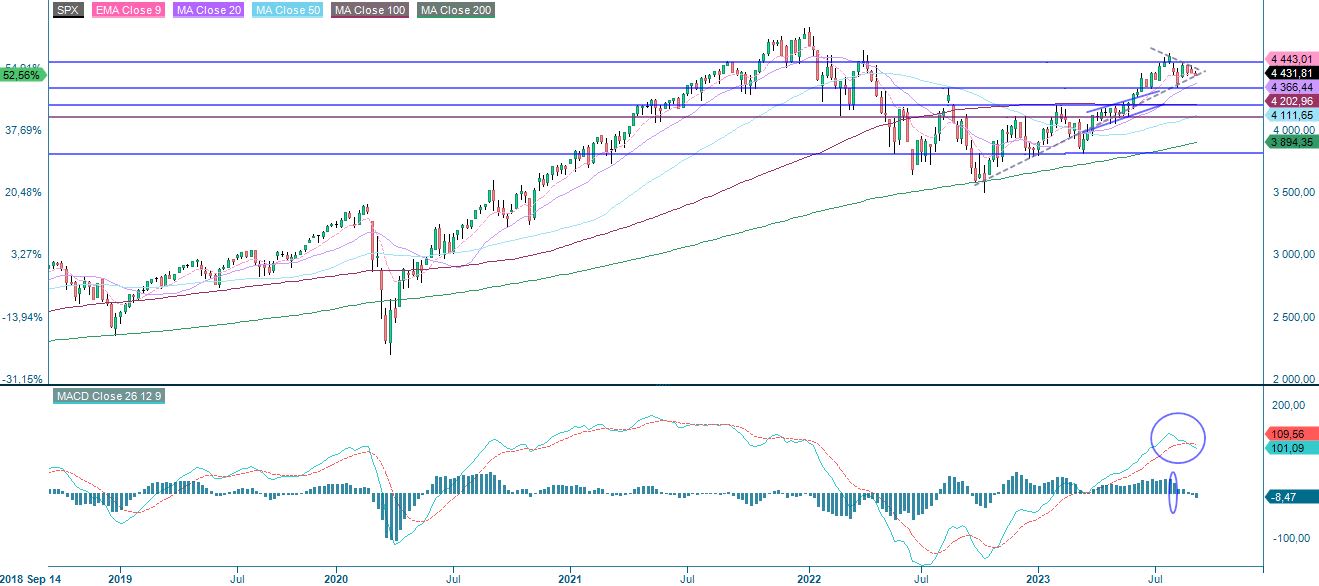
S&P 500 (in USD), weekly five-year chart
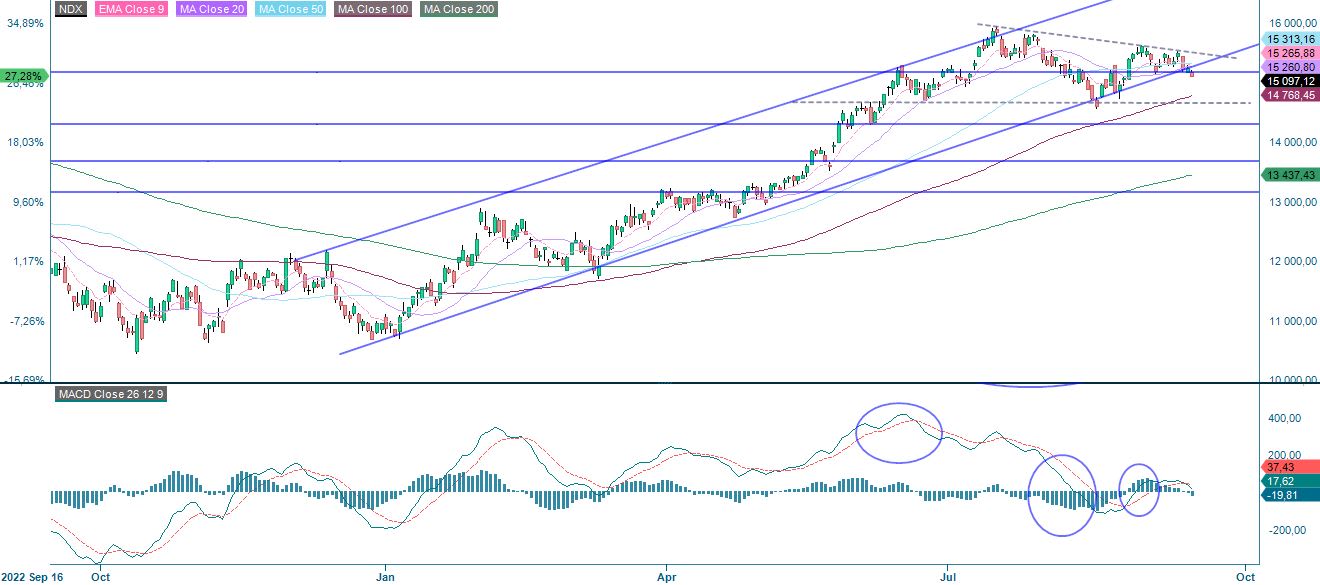
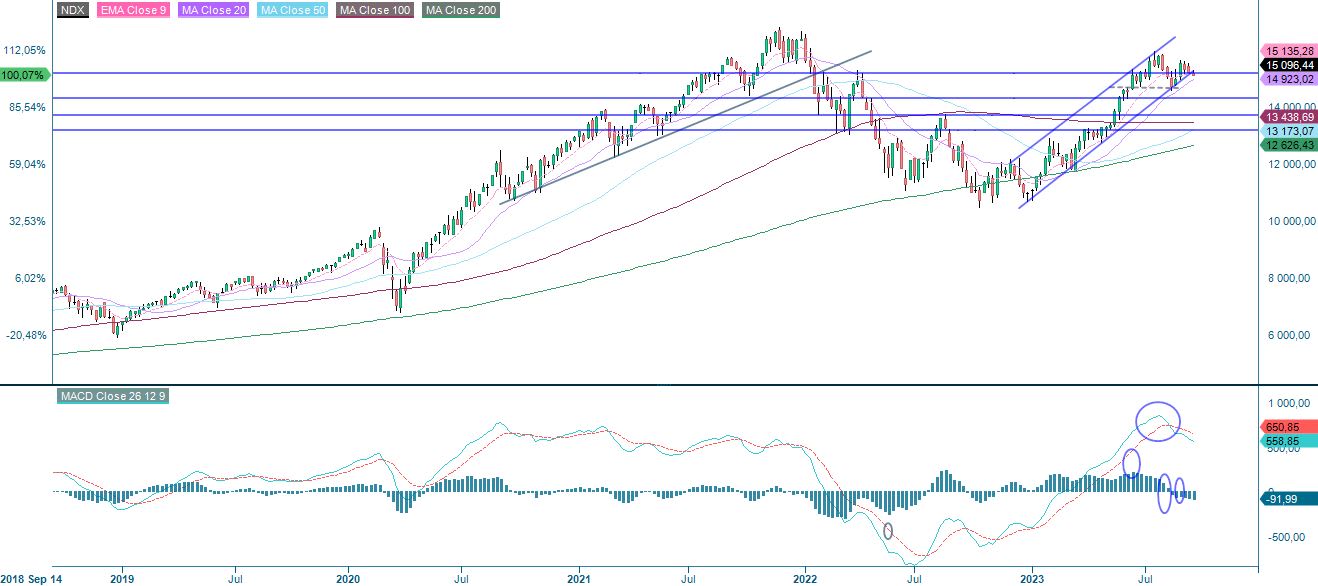
The Nasdaq 100 is under pressure and trading close to the floor of the rising trend channel. In case of a break to the downside, MA10, currently at 14,769, maybe next.
Nasdaq 100 (in USD), one-year daily chart
Nasdaq 100 (in USD), weekly five-year chart
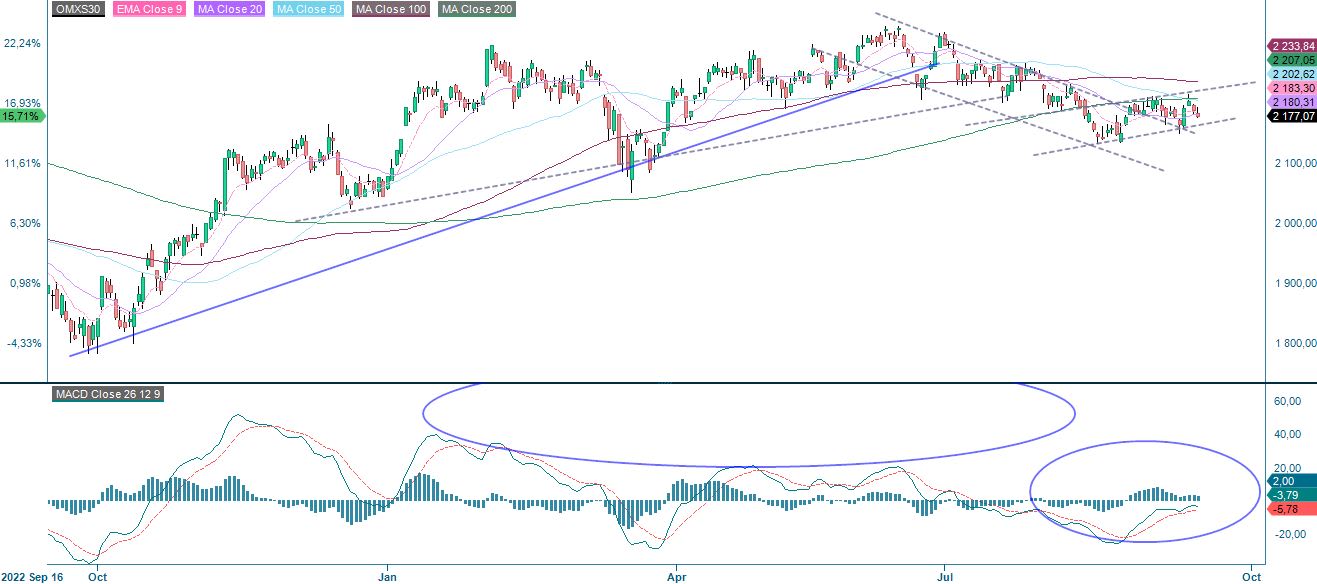
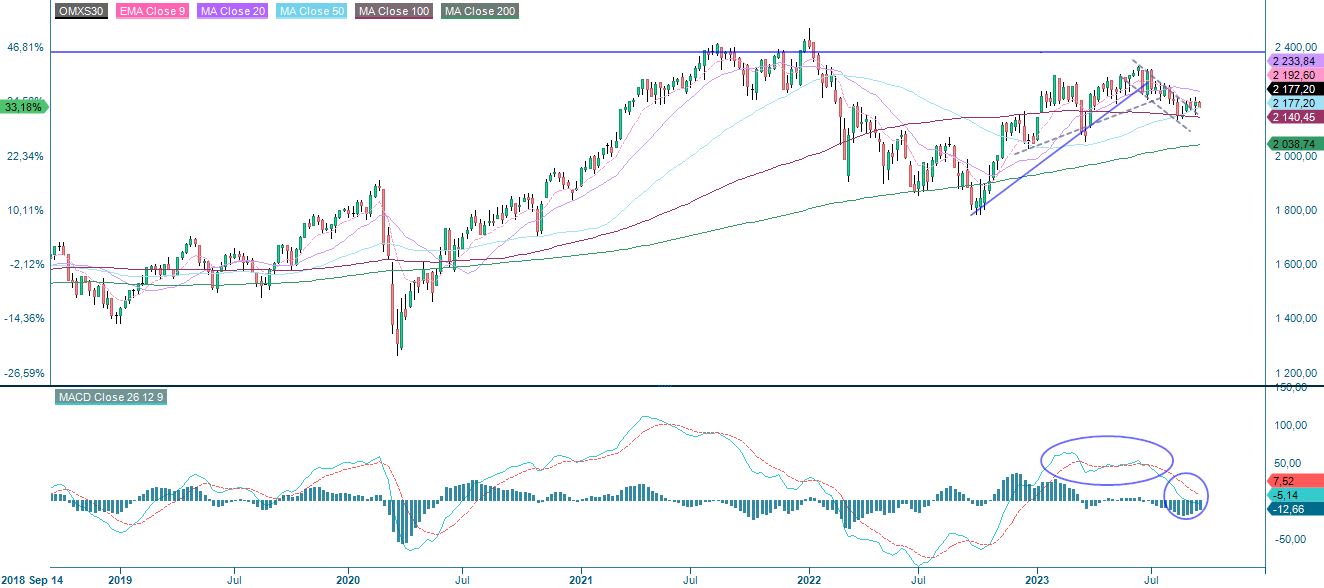
In the daily chart, OMXS has established a short upward-sloping trend. Momentum remains negative but is improving. In the weekly chart, the index has bounced nicely on MA50.
OMXS30 (in SEK), one-year daily chart
OMXS30 (in SEK), weekly five-year chart
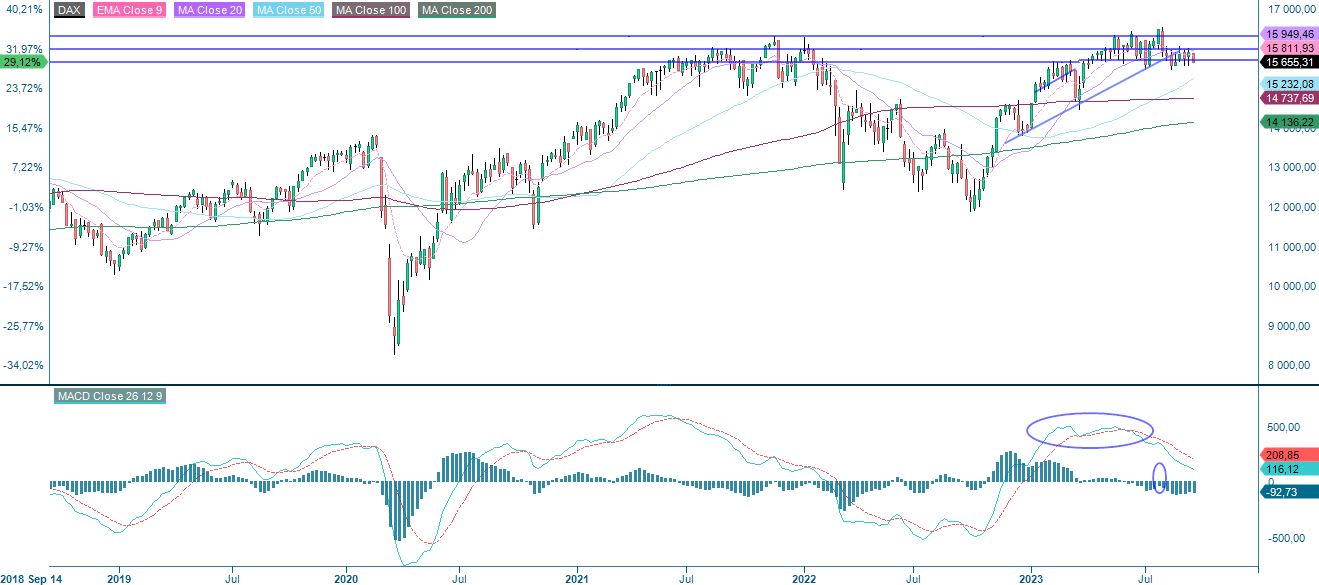
Like the S&P 500, the German DAX has difficulty finding a direction.
DAX (in EUR), one-year daily chart

DAX (in EUR), weekly five-year chart
The full name for abbreviations used in the previous text:
EMA 9: 9-day exponential moving average
Fibonacci: There are several Fibonacci lines used in technical analysis. Fibonacci numbers are a sequence in which each successive number is the sum of the two previous numbers.
MA20: 20-day moving average
MA50: 50-day moving average
MA100: 100-day moving average
MA200: 200-day moving average
MACD: Moving average convergence divergence
Risiko
Ekstern forfatter:
Denne informasjonen er utelukkende på gjesteforfatterens ansvar og representerer ikke nødvendigvis oppfatningen til Bank Vontobel Europe AG eller noe annet selskap i Vontobel Group. Den videre utviklingen av indeksen eller et selskap samt aksjekursen avhenger av en lang rekke selskaps-, gruppe- og sektorspesifikke samt økonomiske faktorer. Hver investor må ta hensyn til risikoen for kurstap i investeringsbeslutningen. Vær oppmerksom på at investering i disse produktene ikke vil generere løpende inntekter.
Produktene er ikke kapitalbeskyttet, i verste fall er et totalt tap av investert kapital mulig. Ved insolvens av utstederen og garantisten, bærer investoren risikoen for totaltap av sin investering. I alle fall bør investorer merke seg at tidligere resultater og/eller analytikeres meninger ikke er en tilstrekkelig indikator på fremtidig ytelse. Ytelsen til de underliggende elementene avhenger av en rekke økonomiske, entreprenørielle og politiske faktorer som bør tas i betraktning i dannelsen av en markedsforventning.
Disclaimer:
Denne informasjonen er verken et investeringsråd eller en investerings- eller investeringsstrategianbefaling, men en annonse. Den fullstendige informasjonen om handelsproduktene (verdipapirene) nevnt her, spesielt strukturen og risikoene knyttet til en investering, er beskrevet i basisprospektet, sammen med eventuelle tillegg, samt de endelige vilkårene. Grunnprospektet og de endelige vilkårene utgjør de eneste bindende salgsdokumentene for verdipapirene og er tilgjengelige under produktlenkene. Det anbefales at potensielle investorer leser disse dokumentene før de tar noen investeringsbeslutning. Dokumentene og nøkkelinformasjonsdokumentet er publisert på nettsiden til utstederen, Vontobel Financial Products GmbH, Bockenheimer Landstrasse 24, 60323 Frankfurt am Main, Tyskland, på prospectus.vontobel.com og er gratis tilgjengelig fra utstederen. Godkjenningen av prospektet skal ikke forstås som en godkjenning av verdipapirene. Verdipapirene er produkter som ikke er enkle og kan være vanskelige å forstå. Denne informasjonen inkluderer eller er relatert til tall for tidligere resultater. Tidligere resultater er ikke en pålitelig indikator på fremtidig ytelse.