FTC speculation puts spotlight on Amazon's premium valuation

Amazon may be facing a lawsuit by the U.S. Federal Trade Commission (FTC). This has put a spotlight on the company's dominance of the e-commerce landscape, as well as its high valuation relative to peers in all sub-sectors. The European Central Bank will announce its interest rate decision on Thursday, 14 September. The Fed and the Swedish Riksbank follow on Wednesday, 20 September. The Fed is expected to keep its policy rates unchanged. Technical momentum is generally fading for the stock indices.
Case of the week: FTC Lawsuit Casts Shadows on Amazon's Dominance in the E-commerce Landscape
Recently, there has been a growing crescendo of speculation about the U.S. Federal Trade Commission's (FTC) antitrust unit preparing to initiate legal action against Amazon concerning its management of the world's foremost e-commerce platform. Speculation suggests that the government is considering potentially dismantling Amazon into separate entities to foster greater competition in the online retail landscape.
Should the company split into several distinct entities, beginning with its e-commerce retail segment, this move could potentially elicit dissatisfaction among current Amazon shareholders concerning their financial outcomes. Such a restructuring might stifle growth rates and introduce fresh accounting, managerial, and marketing expenses for each separate entity, challenging the prompt attainment and sustenance of individual and overall operational profitability.
On the contrary, some argue that Amazon would be better off as several entities, making achieving a 10 – 20 per cent annual growth rate easier than its current structure.
Regardless of whether an eventual split is negative or positive, Amazon's business model, characterised by its ownership and control over a substantial portion of the online retail marketplace, is currently facing mounting scrutiny and challenges.
Looking at valuation, the Amazon share is currently trading at $138. Although this is lower than the all-time high of $186.6, the share price has increased by 64% year to date. Amazon's share price can be seen as inflated compared to various peers. Amazon can be classified within several sectors, from tech to goods delivery. In our peer group, we have chosen tech (Microsoft, Apple, Alphabet and Meta), retail (Walmart and Target), and goods delivery companies (FedEx and UPS). As shown in the chart below, Amazon trades at significantly higher levels than its peers, regardless of sector, with a staggering next twelve months Price-to-Earnings (P/E) ratio of 68.3x.
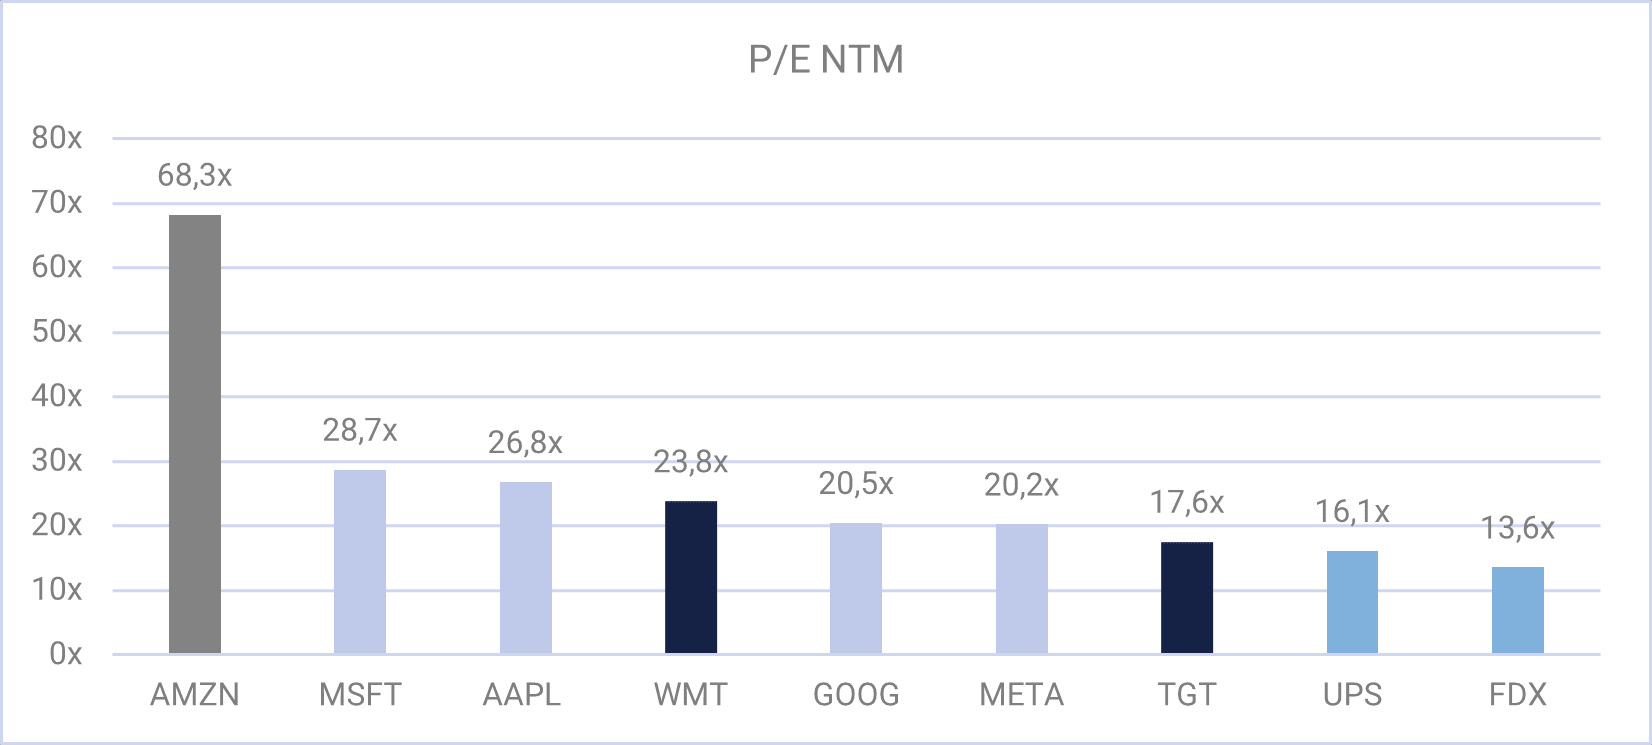
For the tech companies, the average next twelve months P/E is currently 24,1x. The retail companies showcase an average next twelve months P/E of 20.7x, while the goods delivery players come in at 14.8x.
Regarding profitability, Amazon's profit margin last twelve months amounts to 8.3%. Amazon's profitability is low compared to the tech companies, which, on average, showcase 27% in profit margins. Compared to UPS (9.44%) and FedEx (7.01%), Amazon is pretty much on point, while the profitability is lower for Walmart and Target (average 2.4%).

The share price is arguably high regardless of which sector investors place Amazon in. The market seems to have largely overlooked the potential FTC antitrust lawsuit against Amazon thus far, with Amazon's stock maintaining its high valuation. Given the FTC's lengthy investigation, it is likely that they will proceed with the lawsuit. Consequently, Amazon's shares may experience increased volatility in the foreseeable future, with an underlying downside risk.
Amazon stock price chart (in USD), one-year daily chart

Amazon stock price chart (in USD), five-year weekly chart

Macro comments
US interest rates fluctuated last week but rose on Friday, the 8th of September. Today, Wednesday the 13th of September, investors will focus on the US August Consumer Price Indexrod. Tomorrow, on Thursday, the 14th of September, US Producer Price Index figures for August are due. The Fed's next meeting is scheduled for Wednesday, the 20th of September. The market is pricing over a 90% chance that the Fed will leave its policy rates unchanged.
The probability that the European Central Bank will raise its policy rate on Thursday, the 14th of September, is around 40%, while the Riksbank is expected to raise the Swedish policy rate on the 20th of September with a 90% probability. Swedish Consumer Price Index figures for August will be released on Thursday, the 14th of September.
US 10-year yield (%), one-year daily chart

US 10-year yield (%), five-year weekly chart

On Thursday morning, 14th September, Japan's Machinery Orders and Industrial Production for July are due.
On the morning of Friday, 15th September, we will get statistics from China on the country's industrial production, investment, retail trade and unemployment in August. The US Industrial production for August is due later on Friday afternoon.
Momentum is fading
S&P 500 is struggling to maintain the positive momentum, as illustrated by MACD. The index is currently trading down below EMA9 but above MA20. A beak below MA20 and MA100, currently at 4,365, may be next.
S&P 500 (in USD), one-year daily chart

Also, MACD has generated a soft sell signal in the weekly chart below.
S&P 500 (in USD), weekly five-year chart

Nasdaq 100 is also struggling to keep the positive momentum going.
Nasdaq 100 (in USD), one-year daily chart

Again, MACD has generated a soft sell signal in the weekly chart.
Nasdaq 100 (in USD), weekly five-year chart

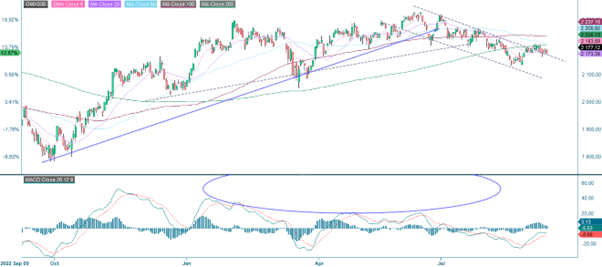
OMXS30 did not break up above MA200 and is trading downwards along the ceiling of a falling trend channel.
OMXS30 (in SEK), one-year daily chart
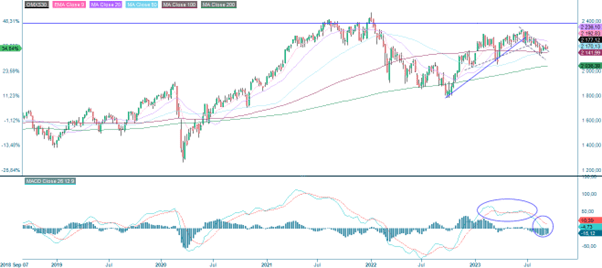
As shown in the weekly chart below, MACD generated a sell signal some time ago.
OMXS30 (in SEK), weekly five-year chart
DAX looks somewhat scary as the index is testing the support around 15,700 again. The next level on the downside is made up by MA200, currently just below 15,500. In case of a break below this level 15,000 may be next.
DAX (in EUR), one-year daily chart

DAX (in EUR), weekly five-year chart

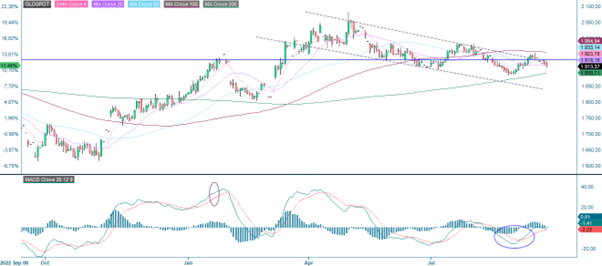
The gold price is approaching MA200 after a failed attempt to break up above the ceiling of a falling trend channel. Meanwhile, the EUR/USD may have bottomed out for now. A weakened USD may fuel yet another upward move in gold.
Gold (in USD per troy ounce), one-year daily chart
Gold (in USD per troy ounce), weekly five-year chart

The full name for abbreviations used in the previous text:
EMA 9: 9-day exponential moving average
Fibonacci: There are several Fibonacci lines used in technical analysis. Fibonacci numbers are a sequence in which each successive number is the sum of the two previous numbers.
MA20: 20-day moving average
MA50: 50-day moving average
MA100: 100-day moving average
MA200: 200-day moving average
MACD: Moving average convergence divergence
Risiko
Ekstern forfatter:
Denne informasjonen er utelukkende på gjesteforfatterens ansvar og representerer ikke nødvendigvis oppfatningen til Bank Vontobel Europe AG eller noe annet selskap i Vontobel Group. Den videre utviklingen av indeksen eller et selskap samt aksjekursen avhenger av en lang rekke selskaps-, gruppe- og sektorspesifikke samt økonomiske faktorer. Hver investor må ta hensyn til risikoen for kurstap i investeringsbeslutningen. Vær oppmerksom på at investering i disse produktene ikke vil generere løpende inntekter.
Produktene er ikke kapitalbeskyttet, i verste fall er et totalt tap av investert kapital mulig. Ved insolvens av utstederen og garantisten, bærer investoren risikoen for totaltap av sin investering. I alle fall bør investorer merke seg at tidligere resultater og/eller analytikeres meninger ikke er en tilstrekkelig indikator på fremtidig ytelse. Ytelsen til de underliggende elementene avhenger av en rekke økonomiske, entreprenørielle og politiske faktorer som bør tas i betraktning i dannelsen av en markedsforventning.
Disclaimer:
Denne informasjonen er verken et investeringsråd eller en investerings- eller investeringsstrategianbefaling, men en annonse. Den fullstendige informasjonen om handelsproduktene (verdipapirene) nevnt her, spesielt strukturen og risikoene knyttet til en investering, er beskrevet i basisprospektet, sammen med eventuelle tillegg, samt de endelige vilkårene. Grunnprospektet og de endelige vilkårene utgjør de eneste bindende salgsdokumentene for verdipapirene og er tilgjengelige under produktlenkene. Det anbefales at potensielle investorer leser disse dokumentene før de tar noen investeringsbeslutning. Dokumentene og nøkkelinformasjonsdokumentet er publisert på nettsiden til utstederen, Vontobel Financial Products GmbH, Bockenheimer Landstrasse 24, 60323 Frankfurt am Main, Tyskland, på prospectus.vontobel.com og er gratis tilgjengelig fra utstederen. Godkjenningen av prospektet skal ikke forstås som en godkjenning av verdipapirene. Verdipapirene er produkter som ikke er enkle og kan være vanskelige å forstå. Denne informasjonen inkluderer eller er relatert til tall for tidligere resultater. Tidligere resultater er ikke en pålitelig indikator på fremtidig ytelse.