Time to hedge in VIX and USD

Wagner's attempted coup in Russia on Midsummer's Day unexpectedly little affected the market. We believe in a flight to safety where the USD and, even more so, the US volatility index VIX are currently at attractive levels.
Case of the week: Geopolitics could bolster the US dollar
Will the fog of war cloud financial markets again?
An attempted and eventually abandoned coup d’état by the mercenary Wagner group in Russia and Ukraine´s ongoing counteroffensive to reclaim Russian-occupied territories are signs that the war’s stalemate might be ending. This could break the relative calm in financial markets of recent months. It is likely that the positive performance in equity markets so far in 2023 has at least partly been underpinned by the lack of any significant development in the war. This has contributed to energy and commodities prices retreating, easing inflationary pressures.
Neither Russia nor Ukraine seems ready for peace talks. If either side makes significant territorial gains during the summer, the risk of escalation may, on the contrary, spike and market turbulence could return. For example, if Russia suffers severe setbacks on the battlefield, it may resolve to weaponise energy and commodity prices by cutting flows of, e.g., natural gas and grains. If Russia gains, there will likely be increased pressure for more sanctions towards Russia and calls for further NATO involvement.
USD typically rises in late summer
The US dollar index has been moving sideways this year. The risk appetite has improved, and, e.g. the ECB has become more hawkish and is raising interest rates faster than the FED. In this environment, the USD has struggled somewhat. However, the US dollar strengthens as a safe haven whenever geopolitical risks rise. Hence, now could be a time to increase USD exposure to prepare for a more uncertain period in the months ahead. Typically, August and September are solid periods for the US dollar.
The Fed expected to resume hiking
While the Fed did not change the target federal funds rate at the last FOMC meeting in June, the probability of a July hike has increased in the last month, according to the CME Fedwatch tool, and currently stands at 72 per cent. The inflation data (PCE) on Friday this week will provide further clues.
The Fed is expected to raise the rate at the July meeting

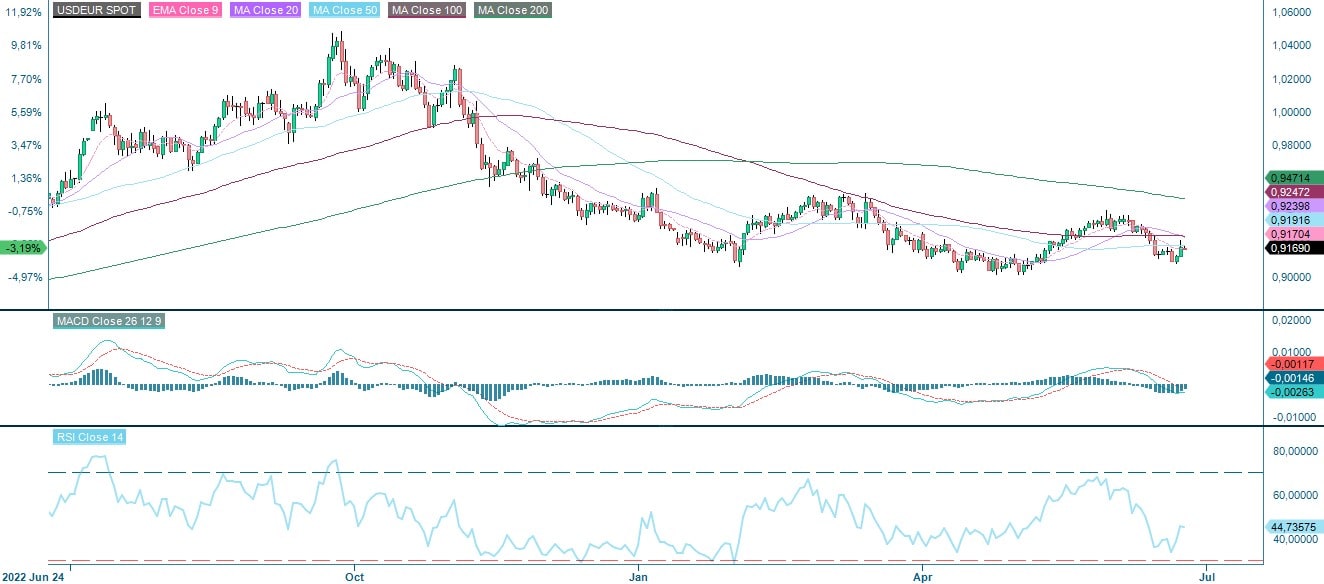
The USD to EUR has been in a negative trend since the end of last year. The currency pair is close to the bottom of the trading range 2023, which suggests there is room for US-dollar appreciation. Admittedly, there is some significant technical resistance above at the 0.92 to 0.925 area from, e.g., the MA50 level. A breakthrough of this resistance could confirm a signal to move higher.
USDEUR, daily one-year price chart
Relaterte produkter
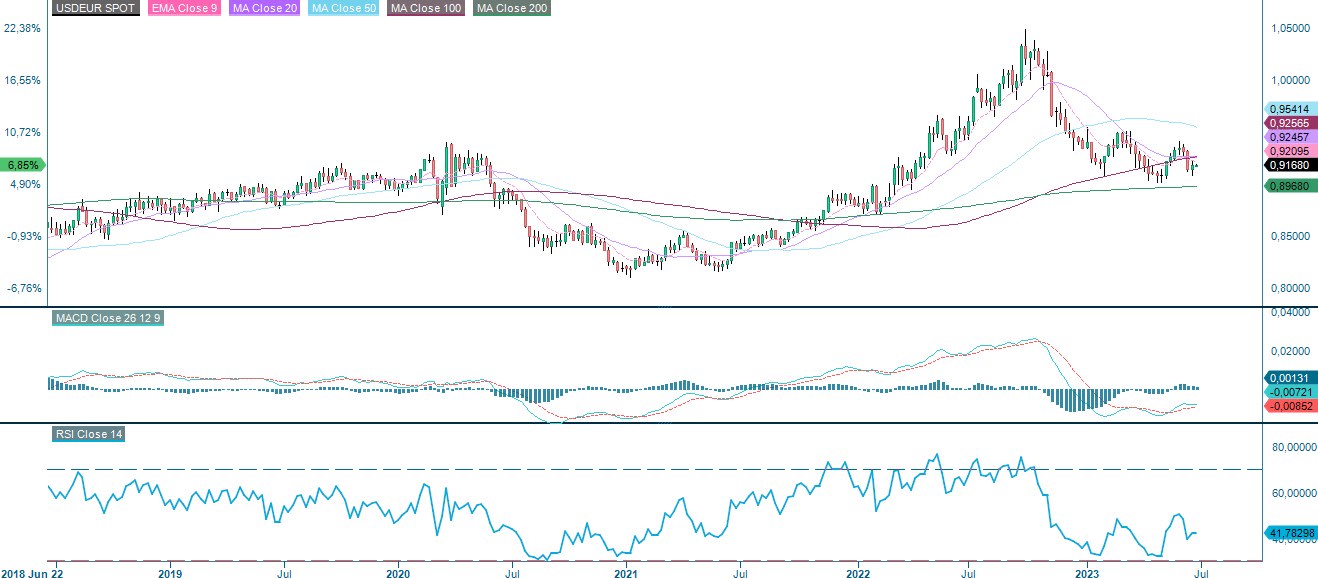
USDEUR, weekly five-year price chart
Market Comments: Low PMIs affect the market more than Wagner
US and European stock markets fell on Friday, 23rd June, after weaker-than-expected PMIs from France, Germany, the UK and the US.
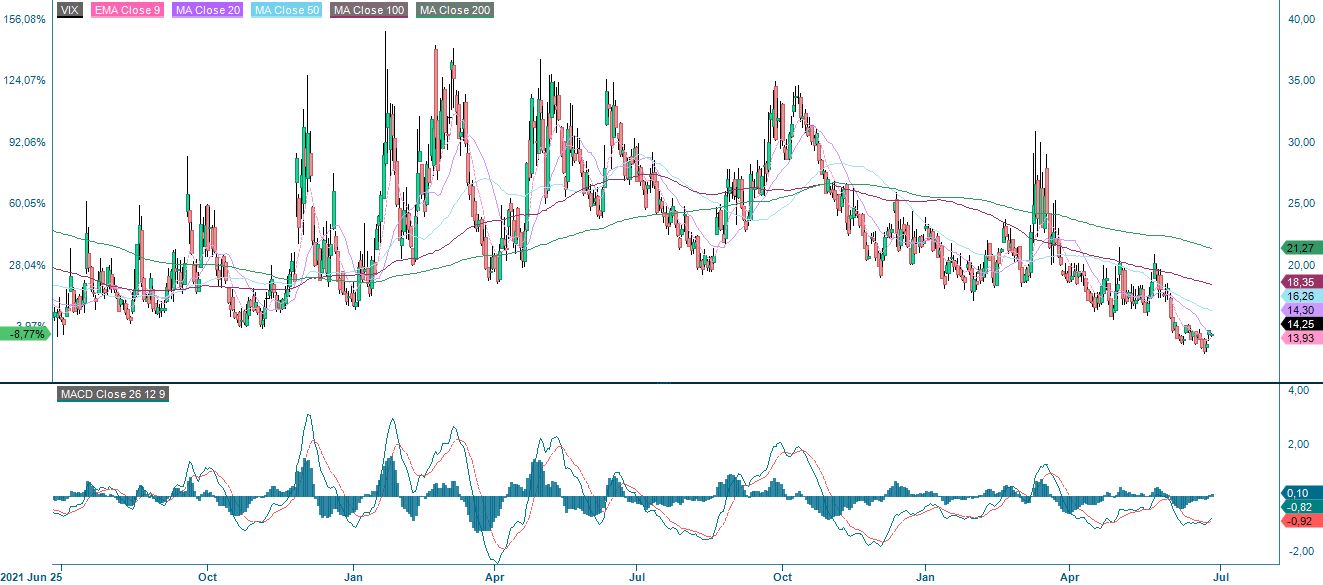
Apart from a slight decline in oil prices, the Wagner Group military putsch in Russia on 24 June did not impact the markets. The unrest in Russia, a belligerent country with a sizeable nuclear arsenal, has not affected the VIX, which remains at remarkably low levels. One might ask what it takes to send the VIX higher, as that was not enough.
VIX, two-year daily chart
VIX, five year weekly chart

The market's appetite for risk remains low, as indicated by the fact that HYG (a US junk bond ETF) continues to trade in an increasingly narrow and lower range. The main drop occurred in the first half of 2022, when HYG fell by around 15 per cent.
HYG, three-year daily chart

HYG, five year weekly chart

What’s next this week
Nike will release its quarterly results on Thursday, 29 June. Interest rate hikes have triggered weaker consumer spending. Nike's report will be an essential indicator of household sentiment and an early signal for the retail sector ahead of the Q2 2023 reporting period.
In Sweden, the focus will be on the Riksbank's interest rate announcement on Thursday, 29 June. The Riksbank is expected to raise interest rates by 25 basis points. However, there is some whispering of a 50 basis point hike. The Riksbank is also likely to take further measures to strengthen the krona and dampen imported inflation.
Following the hawkish signals from central banks, this week's US PCE inflation on Friday, 30 June, will be an essential data point for the market. The trend must continue to decline for the equity market to move higher. US Core PCE inflation is expected to land at 4.7% year-on-year, the same as last month.
Has the risk shifted to the downside?
Worries about the Fed’s aggressive rate politics have increased, and investors have sold off equities. S&P 500 is back down by the previous resistance level, which is now working as support. MA20 can be found at these levels to strengthen support just north of 3,200. However, one should note that MACD recently generated a soft sell signal. Thus, further downside risk is very much present from a technical point of view.
S&P500 price chart (in USD), two-year daily chart

S&P500 price chart (in USD), five-year weekly chart

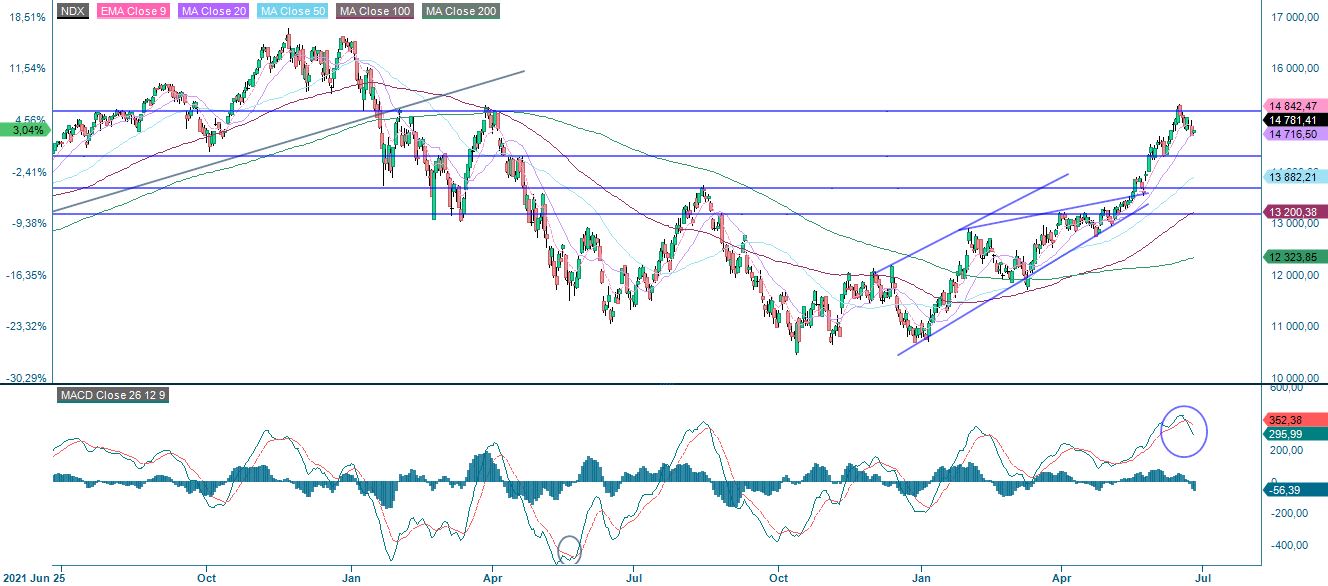
In the daily chart, a similar situation applies to the Nasaq 100, where MA20 is the first level of support. Again, MACD has generated a soft sell signal. Also worth noticing is RSI in the weekly chart, which is at overbought levels. However, RSI at overbought levels is not a sell signal per se. A potential break below 14,000, and this is looking a little scary.
Nasdaq 100 (in USD), two-year daily chart
Relaterte produkter
Nasdaq 100 (in USD), weekly five-year chart

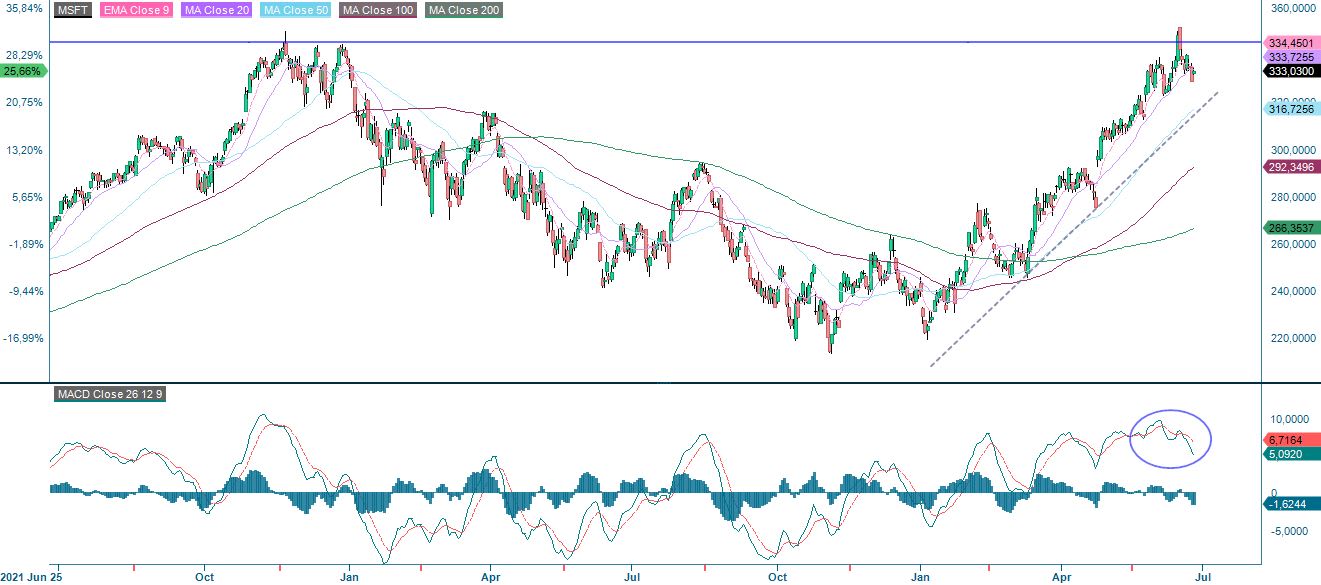
Microsoft is a heavy-weighter for both Nasdaq 100 and S&P 500. After failing to establish its share price above the new all-time high, momentum has been falling though still positive, as illustrated by MACD in the chart below. Are levels just south of 320 USD next, where support can be found in the daily and weekly chart?
Microsoft (in USD), two-year daily chart
Microsoft (in USD), weekly five-year chart

Small downside in OMXS30, but is the long-term trend at stake?
In the daily chart, OMXS30 is still hanging on to support made up by MA100 and the rising trendline. In case of a break, the downside is currently limited, as the next level is made up by Fibonacci 23.6 at 2,193. But fading momentum, as illustrated by MACD in the weekly chart, is somewhat worrisome for the long-term rising trend.
OMXS30 (in SEK), two-year daily chart

OMXS30 (in SEK), weekly five-year chart

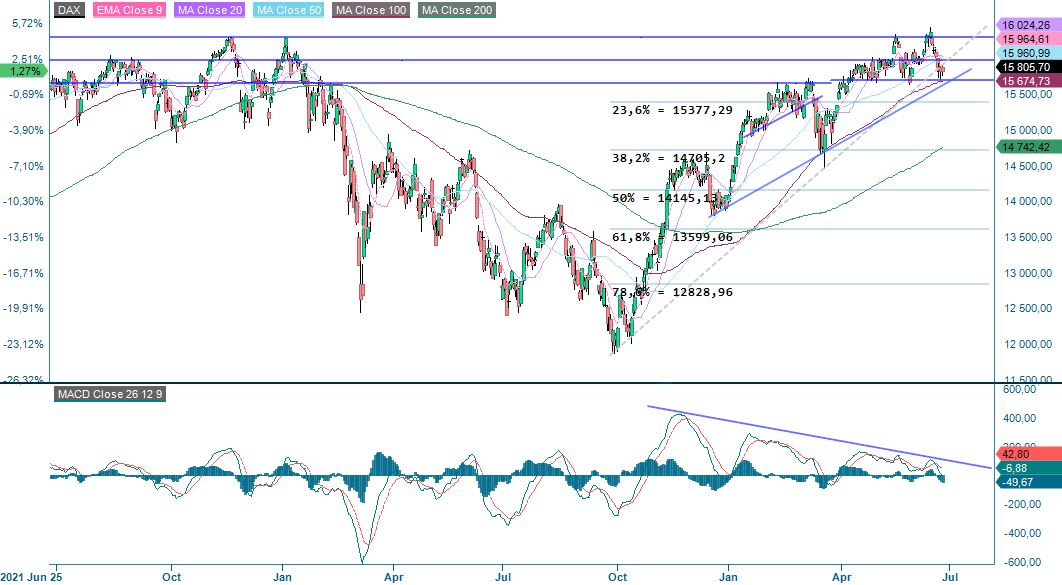
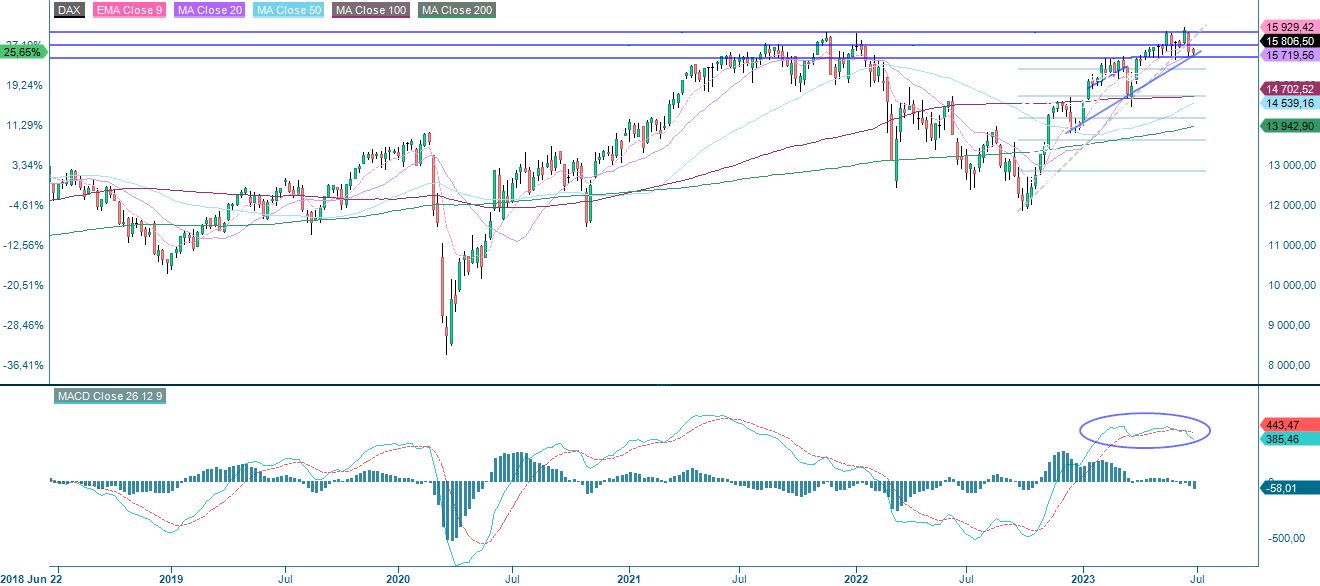
The German DAX is like OMXS20 hanging on to support with limited downside risk, as the next level is around 15,377. Again, a fading momentum in the weekly chart is worrisome for the long-term rising trend.
DAX (in EUR), two-year daily chart
DAX (in EUR), weekly five-year chart
The full name for abbreviations used in the previous text:
EMA 9: 9-day exponential moving average
Fibonacci: There are several Fibonacci lines used in technical analysis. Fibonacci numbers are a sequence of numbers in which each successive number is the sum of the two previous numbers.
MA20: 20-day moving average
MA50: 50-day moving average
MA100: 100-day moving average
MA200: 200-day moving average
MACD: Moving average convergence divergence
Risiko
Disclaimer:
Denne informasjonen er verken et investeringsråd eller en investerings- eller investeringsstrategianbefaling, men en annonse. Den fullstendige informasjonen om handelsproduktene (verdipapirene) nevnt her, spesielt strukturen og risikoene knyttet til en investering, er beskrevet i basisprospektet, sammen med eventuelle tillegg, samt de endelige vilkårene. Grunnprospektet og de endelige vilkårene utgjør de eneste bindende salgsdokumentene for verdipapirene og er tilgjengelige under produktlenkene. Det anbefales at potensielle investorer leser disse dokumentene før de tar noen investeringsbeslutning. Dokumentene og nøkkelinformasjonsdokumentet er publisert på nettsiden til utstederen, Vontobel Financial Products GmbH, Bockenheimer Landstrasse 24, 60323 Frankfurt am Main, Tyskland, på prospectus.vontobel.com og er gratis tilgjengelig fra utstederen. Godkjenningen av prospektet skal ikke forstås som en godkjenning av verdipapirene. Verdipapirene er produkter som ikke er enkle og kan være vanskelige å forstå. Denne informasjonen inkluderer eller er relatert til tall for tidligere resultater. Tidligere resultater er ikke en pålitelig indikator på fremtidig ytelse.
Ekstern forfatter:
Denne informasjonen er utelukkende på gjesteforfatterens ansvar og representerer ikke nødvendigvis oppfatningen til Bank Vontobel Europe AG eller noe annet selskap i Vontobel Group. Den videre utviklingen av indeksen eller et selskap samt aksjekursen avhenger av en lang rekke selskaps-, gruppe- og sektorspesifikke samt økonomiske faktorer. Hver investor må ta hensyn til risikoen for kurstap i investeringsbeslutningen. Vær oppmerksom på at investering i disse produktene ikke vil generere løpende inntekter.
Produktene er ikke kapitalbeskyttet, i verste fall er et totalt tap av investert kapital mulig. Ved insolvens av utstederen og garantisten, bærer investoren risikoen for totaltap av sin investering. I alle fall bør investorer merke seg at tidligere resultater og/eller analytikeres meninger ikke er en tilstrekkelig indikator på fremtidig ytelse. Ytelsen til de underliggende elementene avhenger av en rekke økonomiske, entreprenørielle og politiske faktorer som bør tas i betraktning i dannelsen av en markedsforventning.