The bears are getting a sweet tooth

Due to several factors, sugar prices have risen impressively since the beginning of 2023. While demand in India has increased the sugar price, a stronger Brazilian currency and ethanol prices could push sugar prices down by the autumn. Higher US interest rates are dampening investors' risk appetite. From a technical point of view, lower stock prices may be necessary for the market to regain momentum.
Case of the week: Sugar prices may trickle down
Two producers and a struggle to meet demand
Sugar prices have been rising the last three months, moving from a contract for difference (CFD) price of just under US 22 cents per pound to over 26 cents per pound. The rising prices can mainly be attributed to supply shocks. These supply shocks are, in turn, caused by several factors pushing the expected amount of harvested sugar that gets crushed into white sugar downward. However, the opportunistic swing trader might be able to catch a ride downward as summer turns into fall.
Why prices have gone up
The two biggest sugar producers in the world, Brazil and India, are in different stages of the sugarcane crop cycle.
Sugarcane crop cycle for Brazil and India

Sugarcane crushing in India has produced less sugar than initially estimated during the first quarter of 2023. The lower-than-anticipated supply was, however, not matched by a lower-than-anticipated demand. Quite the opposite, sugar demand in India remained elevated, meaning that even less got exported. In the second quarter, when the crushing season drew to a close, India stopped exporting altogether after the quota of 6.1 million tonnes was filled. The country is now set to halt exports completely until, at least the first half of the next crop cycle, starting the first of October. To say that the impending risk of El Niño is hurting future growth expectations would be an understatement. Combine the sweltering heat and drought risk with the fact that the Indian government is keen on controlling food prices ahead of their state and general elections in 2023 and mid-2024, respectively, and the sugar price surge makes sense.
Why prices might go down
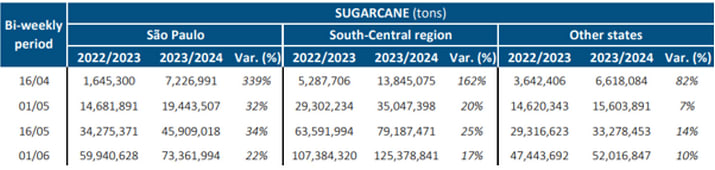
Brazil is beginning the crushing of sugarcane planted last year and harvesting ratoons. The crop season for Brazil has so far been much the opposite to India, with ideal weather conditions boosting expectations of the coming harvest. Rains came down during the planting season, while the weather turned dry at the beginning of the ratooning. This has entailed strong yields already, with the south-central region being 17 % above last year in terms of accumulated sugarcanes crushed.
Accumulated sugarcanes crushed in Brazil (tonnes)
If the dry warmth of El Niño were to come in during the main harvest, that would further boost yields, possibly entailing a record-breaking season for Brazil. However, two prominent threats could impede the normalisation of sugar prices; the strong real and the high price of ethanol. The Brazilian real has appreciated against other currencies substantially during the second quarter, a trend that demotivates exports. Secondly, ethanol has been increasing in price, motivating millers to choose ethanol over white sugar.
Conclusion
Brazil wants to compensate for the lapse in production in India. The strong price development should motivate Brazilian millers to prioritise white sugar over ethanol. Barring freak weather events, prices on sugar look set to fall as summer turns to autumn and Brazil’s primary harvest season starts.
Relaterte produkter
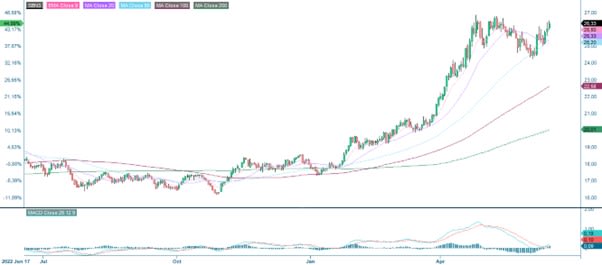
Sugar Future Jul 23 (USD), daily one-year price chart
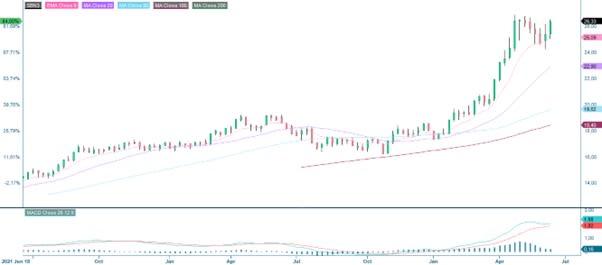
Sugar Future Jul 23 (USD), weekly two-year price chart
Sugar Future Jul 23 (USD), weekly five-year price chart

Market comments: Rising US interest rates weigh on equity markets
US stocks opened higher on Friday, 16 June, but turned south in the final trading hours before the long weekend. US stock exchanges were closed on Monday, 19 June. The S&P500 was down 0.8% at around 16.30 CET on Tuesday, 20 June.
Several Fed members have discussed the need for further rate hikes as inflation remains high. Last week, the US 2-year Treasury yield rose 11 basis points to 4.70%. The US 2-year yield fell 2 bps to 4.68% on Tuesday, the 20th.
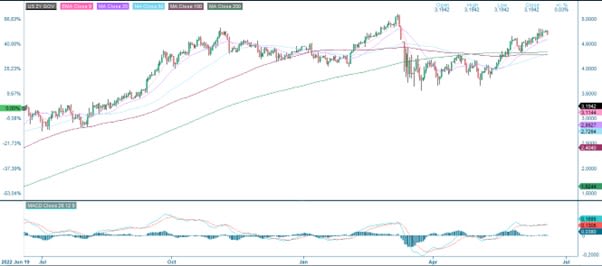
US 2-year Treasury yield (in %), one-year daily chart
Most of the world's stock markets have performed relatively strongly over the past month and quarter. The Nikkei is the best performer, up 24% over the last quarter, followed by the Nasdaq, up 16%. But the S&P500 (+11%) also posted a double-digit gain over the past three months.
Significant stock indices performance in one week, one month and three months

Significant stock indices performance in five years

European stock markets indices, such as the DAX, CAC and OMX, fell by an average of 1.5% between the morning of Monday, 19 June and around 17:00 CET on Tuesday, 20 June. Higher US interest rates make investors reluctant to invest further.
What’s next this week
We could get more clues on Wednesday and Thursday's upcoming monetary policy changes when US Congress questions Fed Chief Powell. Today, Wednesday, 19 June, we will also get the UK Consumer Price Index CPI and Producer Price Index PPI for May in the early morning
On Thursday, 20 June, we will get the French Industrial Expectations for June. After lunch, the Bank of England will release its interest rate statement. From the US, we will get the Q1 current account, weekly jobless claims, existing home sales and leading indicators for May and the Kansas City Fed index for June.
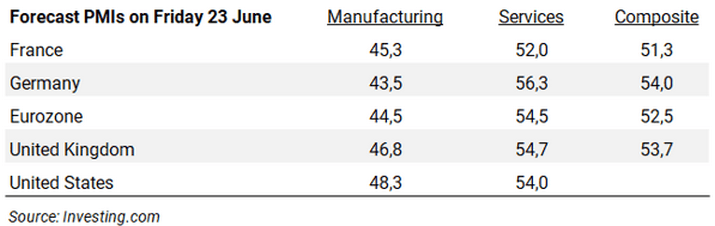
On Friday, the 21st, Japan's CPI for May and UK Retail Sales for May will be released early. We will also get Spain's Q1 GDP. However, the June PMIs from France, Germany, the Eurozone, the UK and the US will be the most important on Friday. Overall, the services Purchasing Manager's Index PMI has been well above the manufacturing PMI for several months. The trend in the PMIs has also been on a sloping curve. This time, the German manufacturing PMI is expected to improve slightly, while the other PMIs are anticipated to fall by a few tenths of a percentage point.
Is S&P 500 in the pit on its race to 4,500?
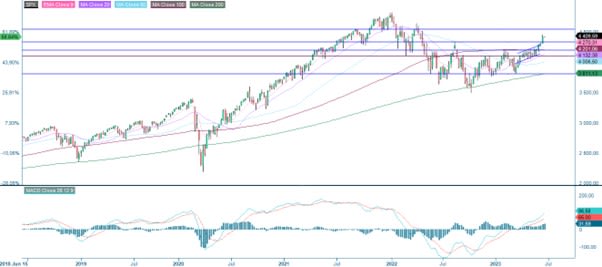
S&P 500 is flying and trading above the resistance level of around 4,300. The way to 4,500 looks free from a technical point of view. However, one should be aware of the Relative Strength Index RSI as risk indicator that is at overbought levels and that the market needs a minor setback or consolidation to gather new energy. Momentum in the weekly chart support a continued rising trend.
S&P500 price chart (in USD), two-year daily chart

S&P500 price chart (in USD), five-year weekly chart
Nasdaq 100 tried to break above the resistance level of around 15,200. However, the index is currently trading below. RSI remains at oversold levels. In case of a break below, EMA9 and MA20 may be next.
Nasdaq 100 (in USD), two-year daily chart

Relaterte produkter
Nasdaq 100 (in USD), weekly five-year chart

Tesla shares have been rallying and are currently trading at Fibonacci 50. Is this the level where it would have been nice to have a range extender?
Tesla (in USD), two-year daily chart

Tesla (in USD), weekly five-year chart

European stock indices lag
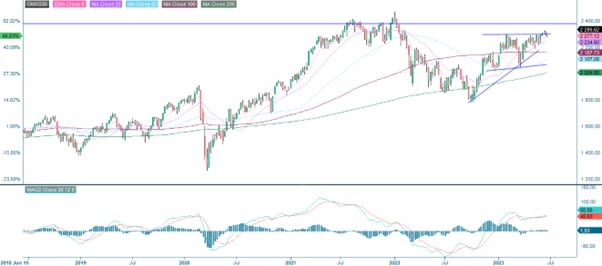
OMXS30 is not looking as strong despite a weak SEK. The index is currently trading below EMA9 and approaching MA20. In case of a break below MA20 and the floor of the narrow rising trend channel may be next. Well worth noticing is that MACD has generated a soft sell signal.
OMXS30 (in SEK), two-year daily chart

On the other hand, with some effort, a bullish flag-like formation can be spotted in the weekly chart.
OMXS30 (in SEK), weekly five-year chart
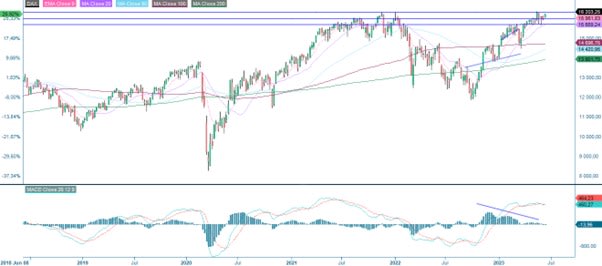
The German DAX attempted to break up above the resistance just south of 16,300. However, the attempt failed and as illustrated in the chart below, the index is trading below, and support is around 16,000. A break below and 15,600 may be next.
DAX (in EUR), two-year daily chart

MACD has generated a soft sell signal in the weekly chart.
DAX (in EUR), weekly five-year chart
The full name for abbreviations used in the previous text:
EMA 9: 9-day exponential moving average
Fibonacci: There are several Fibonacci lines used in technical analysis. Fibonacci numbers are a sequence of numbers in which each successive number is the sum of the two previous numbers.
MA20: 20-day moving average
MA50: 50-day moving average
MA100: 100-day moving average
MA200: 200-day moving average
MACD: Moving average convergence divergence
Risiko
Ekstern forfatter:
Denne informasjonen er utelukkende på gjesteforfatterens ansvar og representerer ikke nødvendigvis oppfatningen til Bank Vontobel Europe AG eller noe annet selskap i Vontobel Group. Den videre utviklingen av indeksen eller et selskap samt aksjekursen avhenger av en lang rekke selskaps-, gruppe- og sektorspesifikke samt økonomiske faktorer. Hver investor må ta hensyn til risikoen for kurstap i investeringsbeslutningen. Vær oppmerksom på at investering i disse produktene ikke vil generere løpende inntekter.
Produktene er ikke kapitalbeskyttet, i verste fall er et totalt tap av investert kapital mulig. Ved insolvens av utstederen og garantisten, bærer investoren risikoen for totaltap av sin investering. I alle fall bør investorer merke seg at tidligere resultater og/eller analytikeres meninger ikke er en tilstrekkelig indikator på fremtidig ytelse. Ytelsen til de underliggende elementene avhenger av en rekke økonomiske, entreprenørielle og politiske faktorer som bør tas i betraktning i dannelsen av en markedsforventning.
Disclaimer:
Denne informasjonen er verken et investeringsråd eller en investerings- eller investeringsstrategianbefaling, men en annonse. Den fullstendige informasjonen om handelsproduktene (verdipapirene) nevnt her, spesielt strukturen og risikoene knyttet til en investering, er beskrevet i basisprospektet, sammen med eventuelle tillegg, samt de endelige vilkårene. Grunnprospektet og de endelige vilkårene utgjør de eneste bindende salgsdokumentene for verdipapirene og er tilgjengelige under produktlenkene. Det anbefales at potensielle investorer leser disse dokumentene før de tar noen investeringsbeslutning. Dokumentene og nøkkelinformasjonsdokumentet er publisert på nettsiden til utstederen, Vontobel Financial Products GmbH, Bockenheimer Landstrasse 24, 60323 Frankfurt am Main, Tyskland, på prospectus.vontobel.com og er gratis tilgjengelig fra utstederen. Godkjenningen av prospektet skal ikke forstås som en godkjenning av verdipapirene. Verdipapirene er produkter som ikke er enkle og kan være vanskelige å forstå. Denne informasjonen inkluderer eller er relatert til tall for tidligere resultater. Tidligere resultater er ikke en pålitelig indikator på fremtidig ytelse.