Bullish signs in the US but bears spotted in the Swedish forests

Despite a relatively high proportion of growth companies, the S&P500 has lagged behind the Nasdaq. There are technical signals that the S&P500 may be due for a rebound. The Swedish krona continues to weaken, favouring exporters such as Boliden, Ericsson and Volvo.
Case of the week: Summer rally or June jitters?
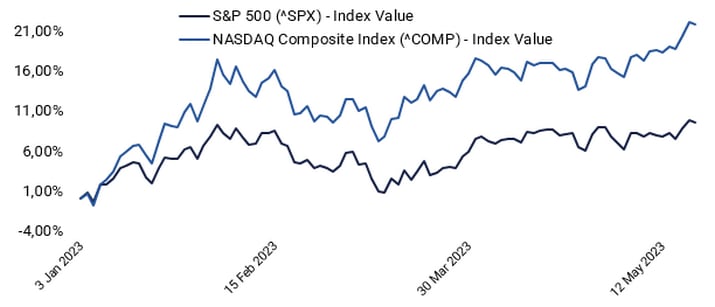
Despite generally positive equity markets, the S&P 500 has underperformed other large indices this year, such as major European stock markets and the Nasdaq. This is partly due to unfavourable exposure to US financials and Energy.
S&P500 v Nasdaq, YTD performance (%, USD)
Last week, there was a significant options expiration in the US. How the markets behave following expiration days could tell the market trend. Last week the S&P 500 possibly broke out of a neutral wedge pattern to the upside. If the move is confirmed this week, it could be a bullish signal. A short-term target is around 4,300, the top of a rising channel.
Relaterte produkter
S&P500 price chart (in USD), one-year daily chart

Sell in May, the saying goes. As shown below, history indicates that going away already in May is often premature. Instead, the weakest period of stock market performance is August and September.
S&P500 monthly price change and positive percentage months (five-year average)

The US debt ceiling negotiations are a concern, with Secretary of Treasury Yellen saying early June represents a hard deadline to avoid defaulting on US debt. On the other hand, investors are becoming more confident that the Fed will pause the rate hike at the June meeting. This might cool off the recent rise in interest rates, which might otherwise spoil a stock market summer party.
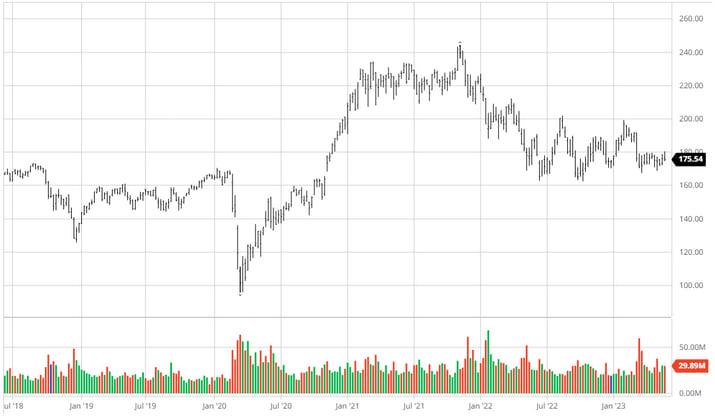
S&P500 price chart (in USD), five-year weekly chart

Nasdaq 100 have broken up above resistance, and the next level on the upside is around 14,200-14,500. Adding to the bullish sentiment is MACD, which has broken the falling trend.
Nasdaq 100 (in USD), two-year daily chart

Relaterte produkter
In the weekly chart below, one can see that a scary-looking doji appears. If this doji remains by Friday’s close, a bearish signal has been created.
Nasdaq 100 (in USD), weekly five-year chart

Bears spotted in the forests of Sweden
Trading in Sweden is less bullish than in the US.OMXS30 gapped up on Friday, the 19th of May, but the following trading is down. This increases the probability of the gap being closed, meaning that the index may return to levels around 2,250. But as long as this level can hold, the risk is on the upside.
OMXS30 (in SEK), one-year daily chart

OMXS30 (in SEK), weekly five-year chart

The German DAX approached the resistance but did not manage to break above. But the short-term trend is rising as long as MA20, currently at 15,939, can hold.
DAX (in EUR), one-year daily chart

DAX (in EUR), weekly five-year chart

SEK is losing ground
The SEK is losing ground against the euro as well as the USD. All else equal, that is positive news for Swedish exporting stocks, such as Boliden, Ericsson and Volvo. The chart below shows that the EUR/SEK is testing resistance. In case of a break to the upside, one must return to March of 2009 to find a place when the SEK was this weak against the euro.
EUR/SEK, one-year daily chart

The instruments below have the underlying SEK per 1 EUR.
EUR/SEK, weekly five-year chart

General market comments: The US debt ceiling continues to weigh on markets
US stock markets opened higher on Friday, 19 May, but turned lower during the evening as uncertainty over the debt ceiling increased. Powell signalled that rate hikes might be paused as the banking crisis leads to tighter credit conditions. The probability of a June rate hike fell from 40% to 25% in Friday's futures trading.
At the G7 meeting over the weekend, Mr Biden said that relations with China were expected to improve soon. This provided some support to the stock markets on Monday, 22nd May. Biden said that he was considering lifting sanctions on China's defence minister. Chinese authorities decided over the weekend to ban imports from US semiconductor company Micron saying its products posed a serious security threat.
Now that the Q1 reporting season is essentially over, the focus in equity markets will likely shift to macroeconomic statistics, whether central banks will continue to raise their policy rates and negotiations on the US debt ceiling. The latter is currently a significant drag on US equity markets, which, as usual, also affects most other equity markets worldwide.
Today, Wednesday, 24 May, the Fed’s latest meeting minutes will be published on 2-3 May. At this meeting, the Fed raised its key interest rate by 0.25% to 5-5.25%. At the same time, it removed the sentence that it expected further rate hikes.
The Russell 2000 small caps index has underperformed the US equity market over the past few weeks, as shown in the following graph.
IShares Russell 2000 ETF (in USD), one-year daily chart
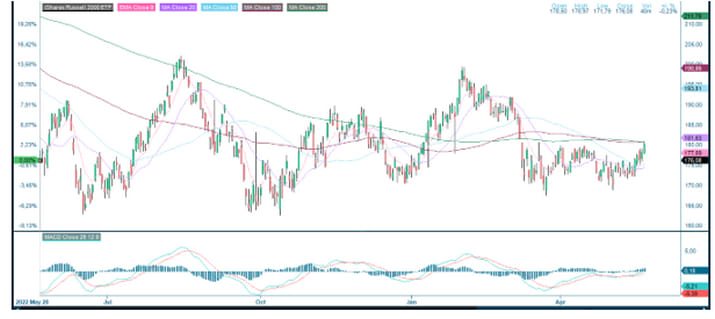
IShares Russell 2000 ETF (in USD), five-year weekly chart
On the contrary, the gold price has performed relatively strongly this year but has recently eased. Historically, gold has been seen as a hedge against inflation and financial instability.
Gold (USD per ounce), one-year daily chart

On Tuesday, 23rd May, the Purchasing Managers' Indices (PMIs) for France, Germany, the UK and the US were published. The previous trend of a more robust services PMI and a weaker manufacturing PMI in the Eurozone continues, as illustrated in the three-year graph below.
Eurozone Purchasing Managers' Index from January 2020 to May 2023

This week (22-26 May), 13 S&P500 companies are scheduled to report Q1 2023 results. Nvidia reports its Q1 2023 figures on Wednesday, 24th May, while Costco Wholesale and Medtronic report quarterly figures on Thursday, 25th May.
The average earnings per share surprise are 8.5%, and the median is 5.5% for the S&P500 companies reporting since 21 March. Share price movements following these quarterly reports have been small (0.0% on average and 0.1% on median).
The full name for abbreviations used in the previous text:
EMA 9: 9-day exponential moving average
Fibonacci: There are several Fibonacci lines used in technical analysis. Fibonacci numbers are a sequence of numbers in which each successive number is the sum of the two previous numbers.
MA20: 20-day moving average
MA50: 50-day moving average
MA100: 100-day moving average
MA200: 200-day moving average
MACD: Moving average convergence divergence
Risiko
Ekstern forfatter:
Denne informasjonen er utelukkende på gjesteforfatterens ansvar og representerer ikke nødvendigvis oppfatningen til Bank Vontobel Europe AG eller noe annet selskap i Vontobel Group. Den videre utviklingen av indeksen eller et selskap samt aksjekursen avhenger av en lang rekke selskaps-, gruppe- og sektorspesifikke samt økonomiske faktorer. Hver investor må ta hensyn til risikoen for kurstap i investeringsbeslutningen. Vær oppmerksom på at investering i disse produktene ikke vil generere løpende inntekter.
Produktene er ikke kapitalbeskyttet, i verste fall er et totalt tap av investert kapital mulig. Ved insolvens av utstederen og garantisten, bærer investoren risikoen for totaltap av sin investering. I alle fall bør investorer merke seg at tidligere resultater og/eller analytikeres meninger ikke er en tilstrekkelig indikator på fremtidig ytelse. Ytelsen til de underliggende elementene avhenger av en rekke økonomiske, entreprenørielle og politiske faktorer som bør tas i betraktning i dannelsen av en markedsforventning.
Disclaimer:
Denne informasjonen er verken et investeringsråd eller en investerings- eller investeringsstrategianbefaling, men en annonse. Den fullstendige informasjonen om handelsproduktene (verdipapirene) nevnt her, spesielt strukturen og risikoene knyttet til en investering, er beskrevet i basisprospektet, sammen med eventuelle tillegg, samt de endelige vilkårene. Grunnprospektet og de endelige vilkårene utgjør de eneste bindende salgsdokumentene for verdipapirene og er tilgjengelige under produktlenkene. Det anbefales at potensielle investorer leser disse dokumentene før de tar noen investeringsbeslutning. Dokumentene og nøkkelinformasjonsdokumentet er publisert på nettsiden til utstederen, Vontobel Financial Products GmbH, Bockenheimer Landstrasse 24, 60323 Frankfurt am Main, Tyskland, på prospectus.vontobel.com og er gratis tilgjengelig fra utstederen. Godkjenningen av prospektet skal ikke forstås som en godkjenning av verdipapirene. Verdipapirene er produkter som ikke er enkle og kan være vanskelige å forstå. Denne informasjonen inkluderer eller er relatert til tall for tidligere resultater. Tidligere resultater er ikke en pålitelig indikator på fremtidig ytelse.