Will oil continue its bearish trend, or can it provide support?

Airbnb significantly improved its result in Q1 2023. Despite the more challenging times, the trend points to increased tourism and interest in renting one's home. This favours the American company. We also look at the Nasdaq, which has risen but fights against rising interest rates. The price of Brent crude oil is technically close to a buy signal after falling quite significantly.
Case of the week: Growing tourism favours Airbnb
The San Francisco-based company Airbnb reported their Q1 results 2023 on Tuesday, 9 May. Net sales rose about 20.5% to USD 1,818 million. Earnings per share improved from negative USD 0.03 in the first quarter of 2022 to USD 0.18 in the first quarter of 2023.
Leverage ratios such as net debt/ EBITDA increased by 466,71%. A significant part of debt belongs to customers repayable. The worsening of this ratio is understandable, considering the type of service Airbnb provides. Customers must pay upfront when booking, increasing the net debt. Free cash flow was 1,581 million, above the last quarter of 2022’s 1,196 million.
Looking closely at revenues divided by geographic region, we can see there was a clear trend of growth in the Asian Pacific area and nights booked in Q1 2023 increased over 40% year-over-year, according to the company’s statement, which indicates the company benefited from the continued recovery in this region. Many analysts project that the short-term rental industry might experience 8,5% growth in the coming years, which would benefit Airbnb rentals further. At the same time, this raises the question of whether the claim is believable, considering the picture of the macro environment is somewhat gloomy. Many of the traditional economic leading indicators are down at recessionary levels. The impact of inflation was significant to ordinary people’s lives as the price of energy and other commodities has risen sharply from last year.
The expectation of second-half-year growth is primarily based on two key assumptions. Under gloomy circumstances, many people rent their homes to enjoy hosting and reduce the burden of their mortgage loans, especially in popular tourist areas. Common consensus suggests the interest rate will rise at least once or twice (if inflation ever falls back) and would support this trend even for an extended period. According to the general manager for Airbnb, Kathrin Anselm, private room listings are up by 30% over the year, and many are using this platform to supplement their incomes.
Consumers expect a pullback in spending for most categories over the second half, such as consumer electronics, home appliances and food delivered to home. Low- and middle-income consumers need to plan more carefully about their spending. In addition, the services Airbnb provides have enormous advantages when planning their travelling. For high-income consumers, travel is one service category with positive spending intentions. According to the Economist Intelligence Unit, global tourism will increase by 30% in 2023, following growth of 60% in 2022, but will remain below the pre-pandemic level. Moreover, consumers have grown fond of other characteristics of Airbnb’s service, such as unique experience expectation, enjoyment, home convenience and social interactions, not merely one bed to sleep.
Relaterte produkter
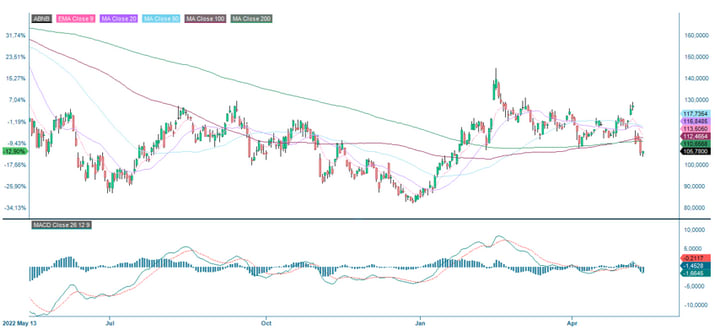
Airbnb share price chart (in USD), one-year daily chart
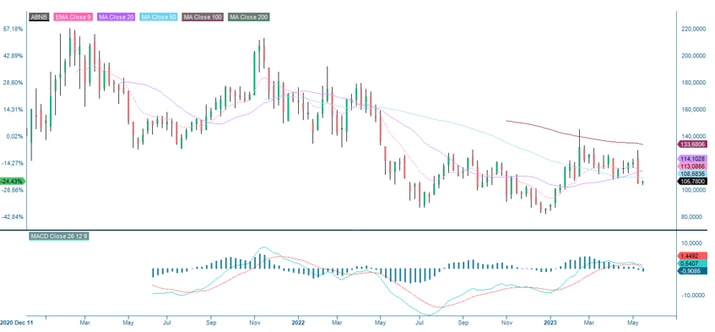
Airbnb share price chart (in USD), three-year weekly chart
General market comments: Falling demand for loans in the US indicates a continued economic slowdown
Interest rates rose in the US on Friday, 12th May. Short- and long-term Treasury yields rose a few points after European stock markets closed. Several Fed members made statements that may have contributed to the rate rise. According to Jefferson, the inflation process is taking longer than expected, but previous tightening measures are well on their way to impacting the economy. During Monday, 15 May and Tuesday, 16 May, the US 2-year Treasury yield has advanced a further nine bps to 4,09%.
As measured by the CPIF, Sweden's inflation rate was 7.6% in April. Analysts had expected the rate to be 7.9%. Underlying inflation, i.e. the CPIF excluding energy, was 8.4%, and expectations were 8.7%. In Riksbank's most recent assessment, the bank expected the CPIF to be 7.9%. The CPIF, excluding energy, was forecast at 8.6 %. The lower inflation rate increases the likelihood of Sweden approaching an interest rate peak.
The US consumer price index (CPI) fell from 5.0% to 4.9% year-on-year in April. However, the US stock and bond markets focus more on the US debt ceiling, which could be reached in early June. According to President Biden, progress is being made in the negotiations, and new meetings are scheduled for this week.
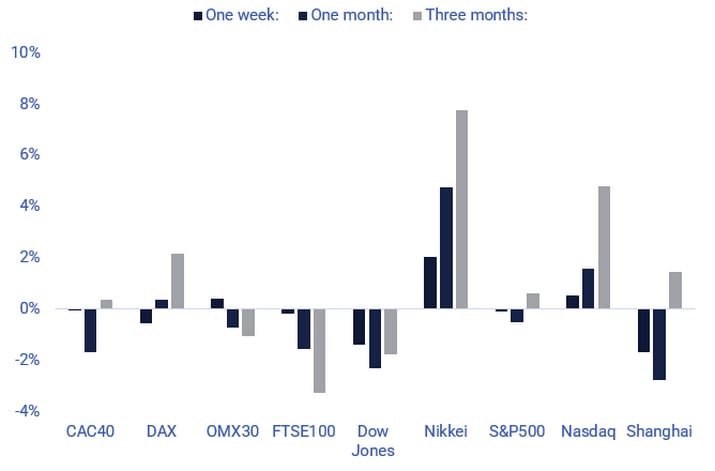
The Japanese Nikkei is the only primary stock market index that has performed strongly over both short term (one month) and medium-term (three months). The UK's FTSE (probably because of its exposure to commodity companies), Dow Jones and Shanghai have been weaker recently.
Significant stock indices performance in one week, one month and three months
Significant stock indices performance in five years

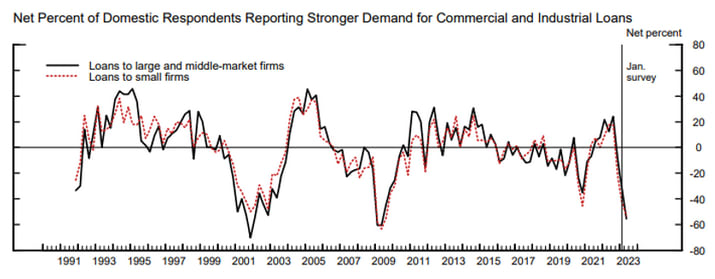
A survey of senior loan officers in the US indicates falling demand for credit from industrial and real estate companies. Apart from the fact that the price of money, i.e. interest rates, has risen, this indicates both uncertainty about the future and the risk that the economy will weaken further.
Demand for commercial loans falls sharply in the US
For Q1 2023 (with 92% of S&P500 companies reporting), 78% of S&P companies have reported a positive EPS surprise, while 75% have reported a positive revenue surprise.
The best-performing sectors are Energy and Information Technology, with 87% of Q1 results beating expectations, followed by Industrials with 86%. The sectors with the lowest percentage of better-than-expected Q1 results are Utilities at 60%, Financials at 64% and Real Estate at 70%.
The average earnings per share surprise have been 8.5%, and the median is 5.5% for 81 large-cap US companies reporting since 21 March 2023. Share price movements following these quarterly reports have been small (0.0% on average and -0.1% on median).
For Q2 2023, 50 S&P500 companies have issued negative earnings guidance, and 37 have issued positive earnings guidance.
This week, 13 S&P500 companies will report their Q1 2023 results. Three large-cap US companies are amongst those; Cisco Systems today, Wednesday, 17th May; Walmart on Thursday, 18th May and Deere & Company on Friday, 19th May.
Can Nasdaq fight the rising interest rates?
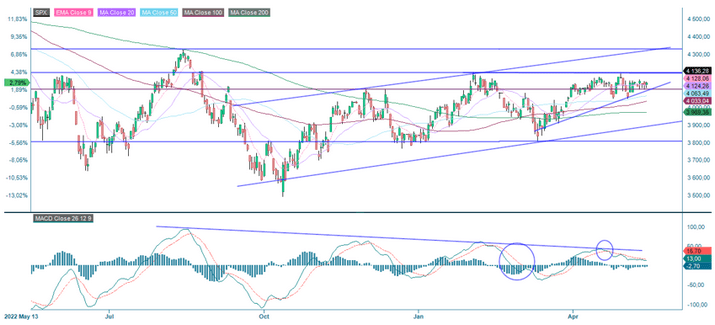
The S&P 500 is having difficulty finding direction. Nevertheless, the risk is still tilted towards the downside from a technical perspective. Serving as support on the downside is MA50, currently at 4,063. A break below this level is bearish, allowing the negative divergence between MACD and the index to take out its rights. In case of a break above the resistance level of around 4,180, levels around 4,300 could be tested
S&P 500 (in USD), one-year daily chart
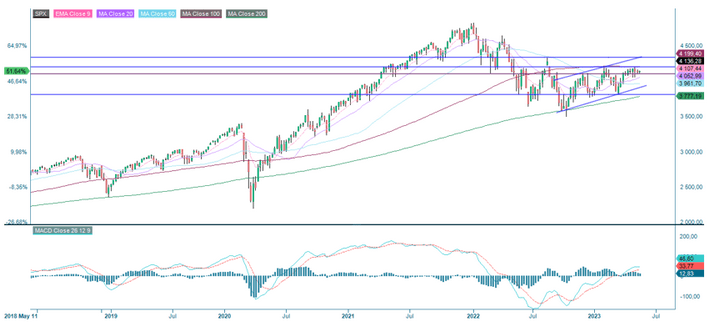
S&P 500 (in USD), weekly five-year chart
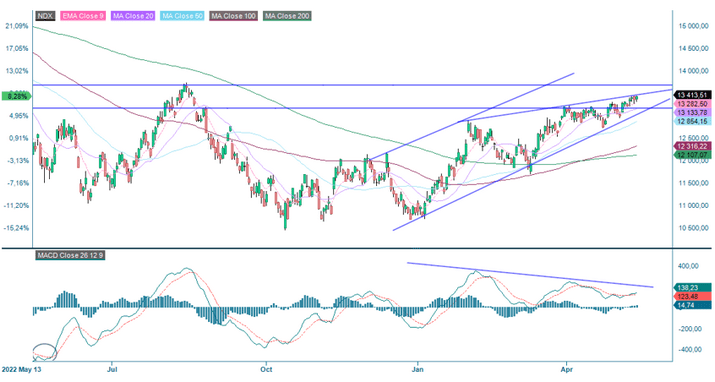
After solid interim reports from the large tech giants, the Nasdaq 100 has broken up above resistance between 13,100-13,200, above MA20. The index is trading above its rising EMA9 and MA20 and could reach the previous top from August 2022 at 13,667. Well worth noticing is that the rates have once again started to climb, which may derail this scenario.
Nasdaq 100 (in USD), two-year daily chart
Relaterte produkter
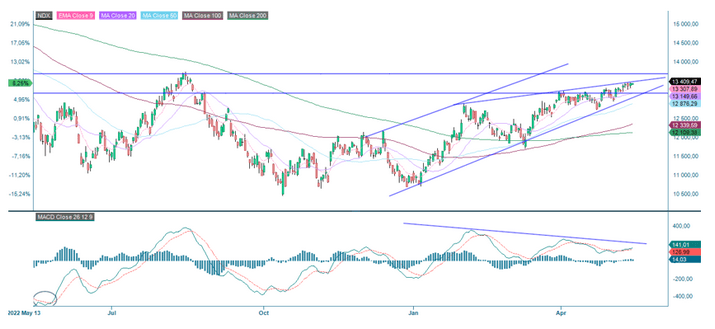
Nasdaq 100 (in USD), weekly five-year chart
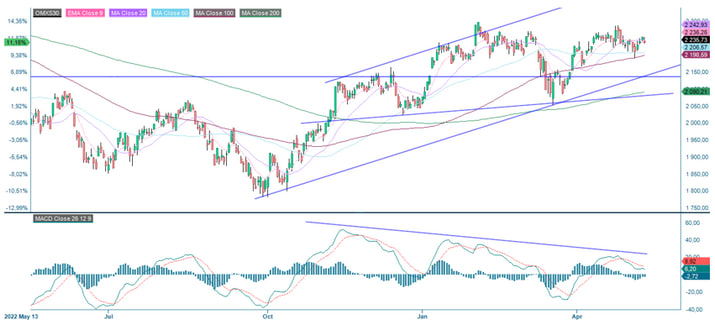
Swedish OMXS30 is not looking as strong as Nasdaq 100. The index is currently trading below both EMA9 and MA20. Next, the support comprises MA50, followed by MA20 at 2,206 and 2,199, respectively. In the case of an upwards movement, the first level of resistance is around 2,270.
OMXS30 (in SEK), one-year daily chart
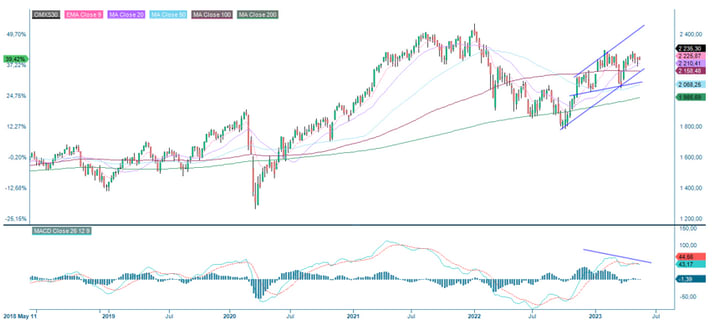
OMXS30 (in SEK), weekly five-year chart
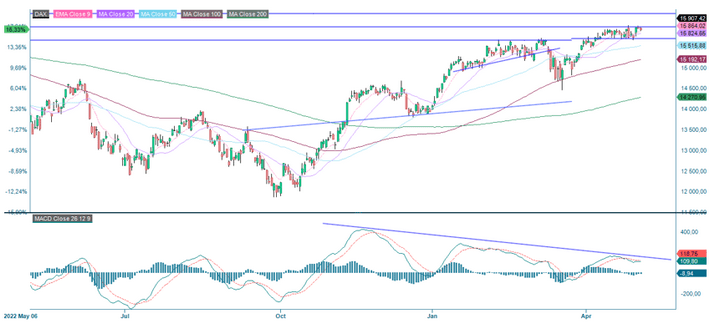
Like the other indices, the German DAX is trading without a clear direction under low volatility.
DAX (in EUR), one-year daily chart
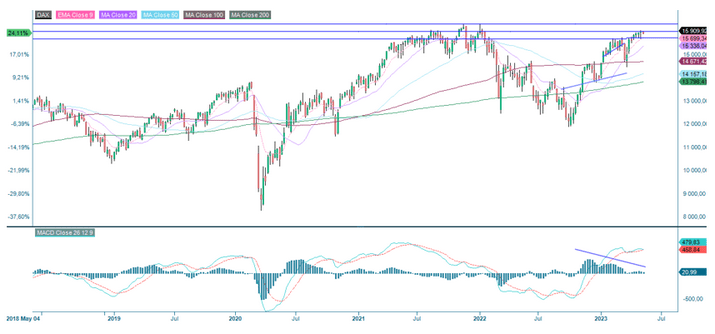
DAX (in EUR), weekly five-year chart
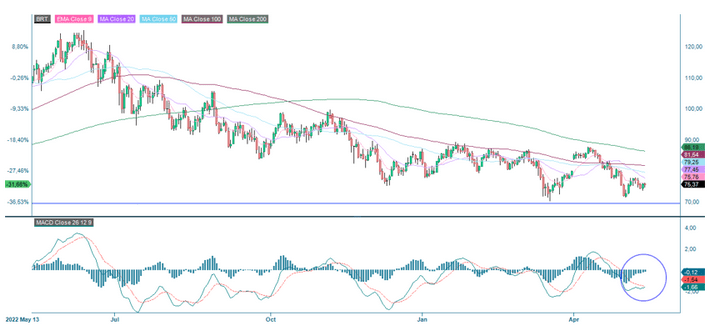
Has the oil bottomed out?
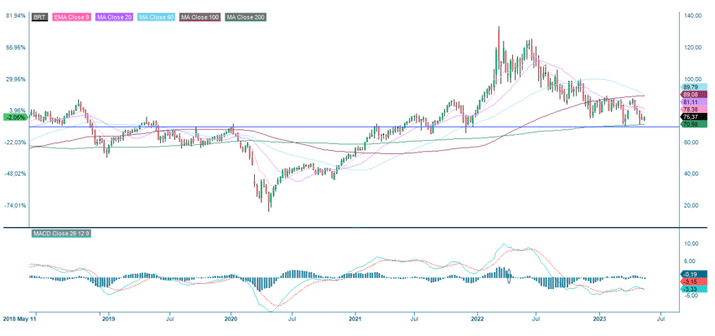
The stronger USD is pressuring the Brent oil price. However, as shown in the daily chart below, MACD is close to generating a soft buy signal. In the weekly chart, it can be seen that oil is trading close to solid support. Will we see a bounce?
Brent oil (in USD), one-year daily chart
Relaterte produkter
Brent oil (in USD), weekly five-year chart
The full name for abbreviations used in the previous text:
EMA 9: 9-day exponential moving average
Fibonacci: There are several Fibonacci lines used in technical analysis. Fibonacci numbers are a sequence of numbers in which each successive number is the sum of the two previous numbers.
MA20: 20-day moving average
MA50: 50-day moving average
MA100: 100-day moving average
MA200: 200-day moving average
MACD: Moving average convergence divergence
Risiko
Ekstern forfatter:
Denne informasjonen er utelukkende på gjesteforfatterens ansvar og representerer ikke nødvendigvis oppfatningen til Bank Vontobel Europe AG eller noe annet selskap i Vontobel Group. Den videre utviklingen av indeksen eller et selskap samt aksjekursen avhenger av en lang rekke selskaps-, gruppe- og sektorspesifikke samt økonomiske faktorer. Hver investor må ta hensyn til risikoen for kurstap i investeringsbeslutningen. Vær oppmerksom på at investering i disse produktene ikke vil generere løpende inntekter.
Produktene er ikke kapitalbeskyttet, i verste fall er et totalt tap av investert kapital mulig. Ved insolvens av utstederen og garantisten, bærer investoren risikoen for totaltap av sin investering. I alle fall bør investorer merke seg at tidligere resultater og/eller analytikeres meninger ikke er en tilstrekkelig indikator på fremtidig ytelse. Ytelsen til de underliggende elementene avhenger av en rekke økonomiske, entreprenørielle og politiske faktorer som bør tas i betraktning i dannelsen av en markedsforventning.
Disclaimer:
Denne informasjonen er verken et investeringsråd eller en investerings- eller investeringsstrategianbefaling, men en annonse. Den fullstendige informasjonen om handelsproduktene (verdipapirene) nevnt her, spesielt strukturen og risikoene knyttet til en investering, er beskrevet i basisprospektet, sammen med eventuelle tillegg, samt de endelige vilkårene. Grunnprospektet og de endelige vilkårene utgjør de eneste bindende salgsdokumentene for verdipapirene og er tilgjengelige under produktlenkene. Det anbefales at potensielle investorer leser disse dokumentene før de tar noen investeringsbeslutning. Dokumentene og nøkkelinformasjonsdokumentet er publisert på nettsiden til utstederen, Vontobel Financial Products GmbH, Bockenheimer Landstrasse 24, 60323 Frankfurt am Main, Tyskland, på prospectus.vontobel.com og er gratis tilgjengelig fra utstederen. Godkjenningen av prospektet skal ikke forstås som en godkjenning av verdipapirene. Verdipapirene er produkter som ikke er enkle og kan være vanskelige å forstå. Denne informasjonen inkluderer eller er relatert til tall for tidligere resultater. Tidligere resultater er ikke en pålitelig indikator på fremtidig ytelse.