The weather conditions support the cotton price

Cotton has been trading sideways for some time. Now, weather conditions and reduced supplies from China suggest that cotton prices could rise. In the US, interest rates rose due to a strong employment report last Friday and have continued to rise this week.
Case of the week: Cotton might be spot-on
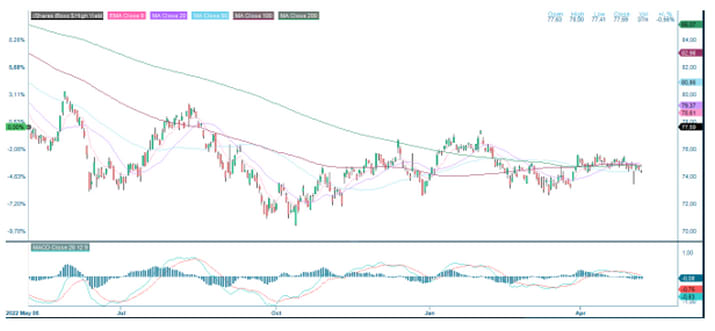
After peaking during the summer of 2022, with prices not seen since 2011, the cotton price has decreased to levels seen before the pandemic. Since January 2023, the cotton price has been moving sideways. Increased uncertainty regarding expected future demand and solid supply has pushed traders toward other soft commodities such as sugar and cocoa. However, the pendulum might be about to swing the other way, as a few different variables might push in the same direction, entailing an upside for cotton.
Cotton is mainly grown in and exported from China, India, the United States and Brazil. In general, cotton is planted during the spring from April through May and harvested from August through to November, although there is variation depending on latitude. Most notably, in Brazil, cotton is planted in January and February while harvested in July and August. Given these cycles, we are currently in the planting season, and during the planting season, the weather is even more crucial than usual. Western Texas is experiencing windy and dry weather, which has become more probable over the last few years. Furthermore, although oceanic winds are changing from La Nina to El Nino, entailing more moisture, the weather pattern is forecast to come in in the last months of the year. Put together; the expected dry and windy weather should not be a big motivator for Texan farmers to push planting cotton this season, potentially meaning tighter supplies. After the current planting season, the outlook for the harvest in the second half of 2023 will be easier to gauge. With current meteorological forecasts in mind, the USA might only be able to meet some of the demand.
This potential export hit is not contained to the USA, as Brazil is also struggling. During the first quarter of 2023, exports from Brazil were down 56 % Year-on-Year. A perfect storm of challenging weather conditions in Brazil combined with the turbulence in import countries Pakistan and Bangladesh has meant that many contracts have been cancelled. Turkey, another big importer, has been struggling since the earthquake but, following the current election, might see a rebound in demand. Top producer and exporter India has seen low exports at the beginning of 2023, failing to reach the numbers of 2022. While historically exporting more than importing, the commodity is forecast to be in balance for 2023. Conversely, China has been hamstrung by the ban on cotton from the Xinjiang province following revelations regarding forced labourers in the region. Also, facing dry weather, pent-up demand from textile workers in countries such as Vietnam, which usually gets half its cotton from China, could fuel the demanded fire.
In summary, factors indicate a potential rise in cotton prices as dry, hot weather combines with macroeconomic factors to entail a drop in cotton supply. After the bull runs in sugar and cocoa prices, cotton might be ready to go from pushing sideways to increasing. While the previously mentioned sugar and cocoa markets are smaller, leaner and with shorter supply chains, cotton is a vast industry with subsidized production and a complex supply chain. Taken into account, the potential drop in supply might take longer to recover.
Cotton Future Jul 2023 (USD/Lbs), one-year daily chart
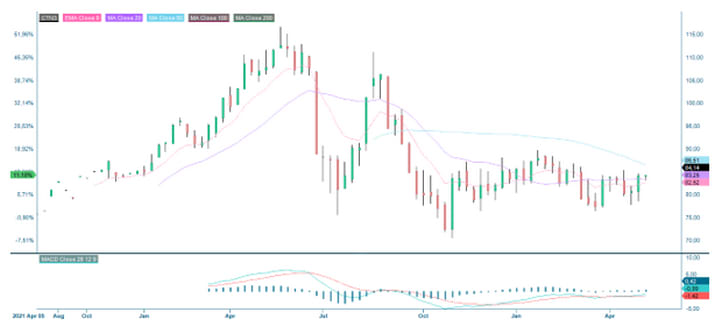
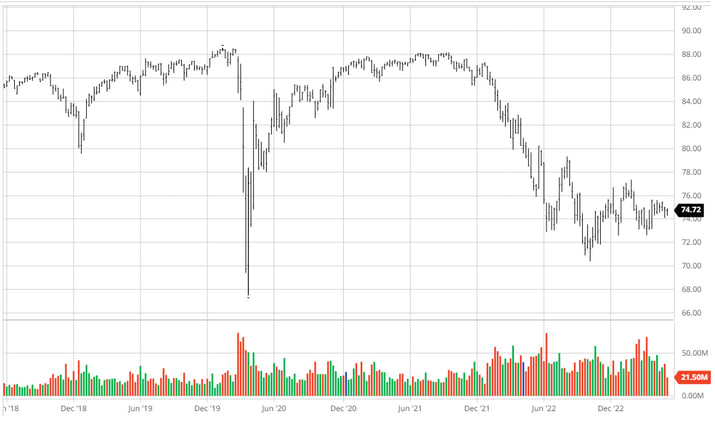
Cotton Future Jul 2023 (USD/Lbs), two-year weekly chart
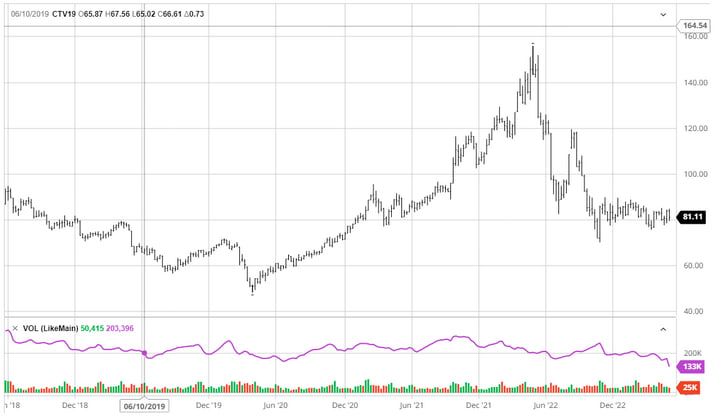
Cotton Future Jul 2023 (USD/Lbs), five-year weekly chart
General market comments: Rates on the rise after strong US jobs report
After four consecutive days of decline, the S&P 500 reversed on Friday last week and rose by 1%. The Nasdaq rose 2.3% and the Dow Jones 1.7%. The market received Friday's US employment report well while interest rates rose. US employment rose more than expected in April, with 253,000 jobs added versus expectations of 180,000. Employment growth was broadly based, with increases in most sectors. Meanwhile, the number of new jobs created during the last two months was reduced by 150,000. Wages rose by 0.5% month-on-month versus market expectations of 0.3%.
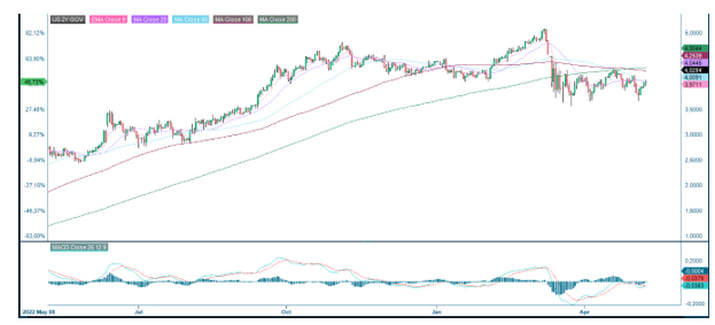
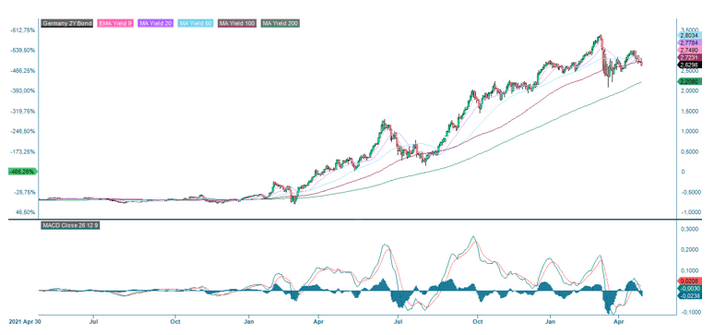
The US 2-year Treasury yield rose by 16 basis points to 3.97%, while the 10-year US Treasury yield increased slightly less on Friday, 5 May. Currently, the US 2-year Treasury yield has advanced to 4.05%. The employment report helped to revive previously non-existent expectations of a June rate hike by the Fed. The US debt ceiling issue (where US government debt hit the ceiling on 19 January 2023) remains unresolved. On Sunday, 7 May, US Treasury Secretary Yellen said there was no reasonable alternative to raising the debt ceiling.
US 2-year Treasury yield (in %), one-year daily chart
Following the weak performance of US equity indices last week, the HYG, US junk bond ETF has also fallen. The HYG is an interesting indicator for several reasons. Firstly, the historical correlation between HYG and the S&P500 is relatively good. Secondly, HYG reflects investors' risk appetite for bonds linked to companies with lower credit ratings. In the US, the oil and energy sector is the largest bond borrower, while in Sweden, the real estate sector has issued most bond loans.
HYG ETF in the US, one-year daily chart
HYG ETF in the US, five-year daily chart
S&P500 Q1 2023 reporting season and week ahead
For Q1 2023 (with 85% of S&P 500 companies reporting), 79% of S&P 500 companies have reported a positive Earnings-per-Share (EPS) surprise, while 75% have reported a positive revenue surprise.
The best-performing sectors are Energy, with 90% of Q1 results beating expectations; Information Technology, 89%; and Commercial Services, 87%. The sectors with the lowest percentage of better-than-expected Q1 results are Utilities at 62%, Financials at 64% and Real Estate at 69%.
As of 31 March 2023, analysts were forecasting a -6.7% decline in earnings for Q1 2023. This expected earnings decline has been reduced to -2.2% as of May 5, 2023.
For Q2 2023, 44 S&P 500 companies have issued negative earnings guidance, and 35 S&P 500 companies have issued positive earnings guidance. For Q2 2023, analysts are projecting an earnings decline of -5.7% and a revenue decline of less than -0.1%.
This week, 32 S&P500 companies will report their Q1 2023 results. Of the US big caps with a market cap exceeding USD 100bn, Disney will present their Q1 2023 numbers today, Wednesday, 10 March.
Today, the main macroeconomic releases will be April’s German and US Consumer Price Indices (CPI). Tomorrow, Thursday, 11 May, we have China's CPI and PPI (Purchaser Price Index) for April in the early morning, an interest rate announcement from the Bank of England, and the US PPI for April later in the day. On Friday the 12th, we get April CPI data from France and Spain and the US Michigan index for May.
Risk still tilted to the downside
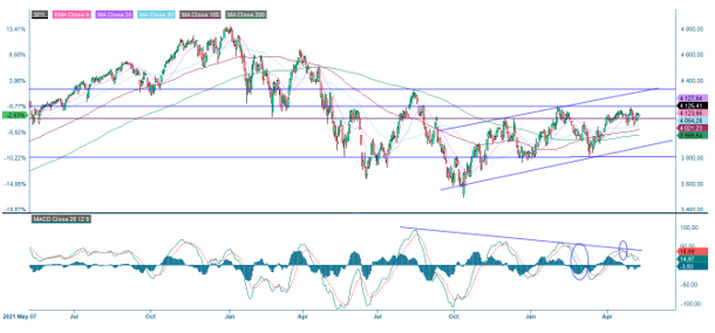
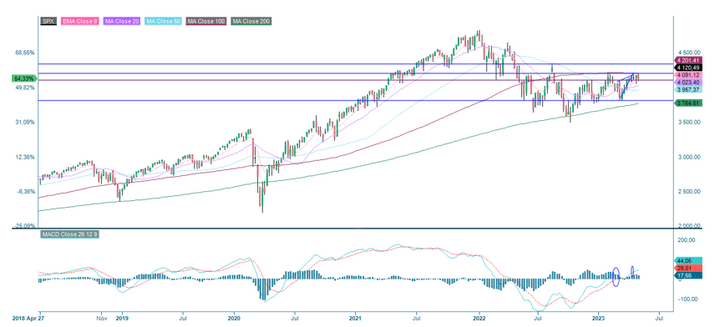
The chart below shows that S&P 500 is having difficulty finding direction. Nevertheless, the risk is still tilted towards the downside from a technical perspective. Serving as support on the downside is MA50, currently at 4,054. A break below this level is bearish, allowing the negative divergence between MACD and the index to take out its rights. In case of a break above the resistance level of around 4,180, levels around 4,300 could be tested.
S&P 500 (in USD), two-year daily chart
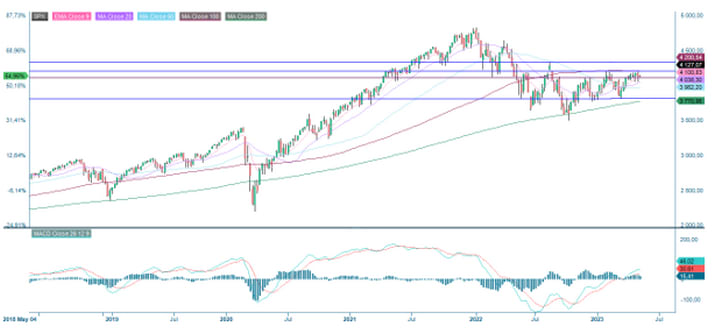
S&P 500 (in USD), weekly five-year chart
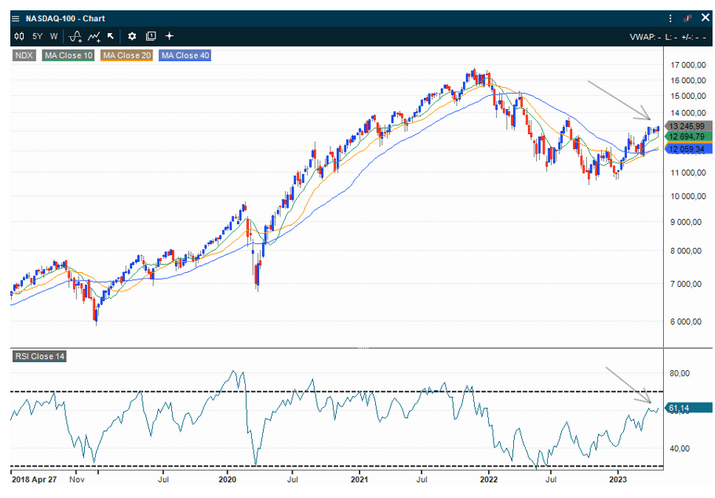
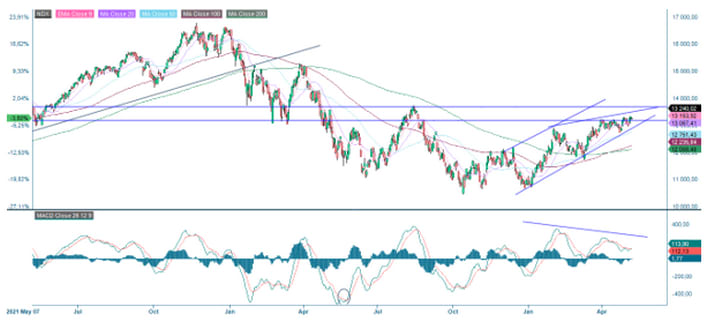
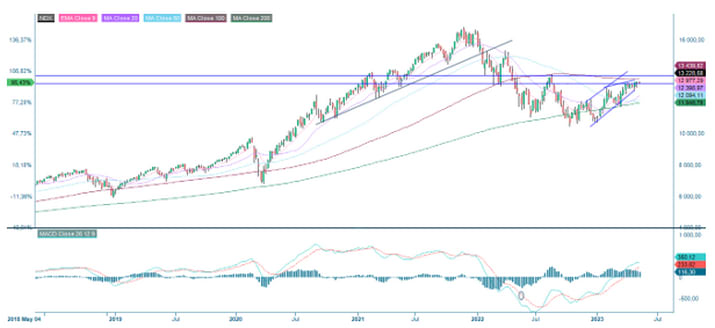
The Nasdaq 100 still hangs around resistance between 13,000-13,100, above MA20. The robust reports from the tech sector did not help the index break above is somewhat troublesome. Negative divergence can once again be found between the index and MACD. In case of a break below the rising trendline and MA100, around 12,800 is bearish, and MA200, around 12,090, maybe next. In case of a break to the upside, the next resistance level is close to 13,685.
Nasdaq 100 (in USD), two-year daily chart
Nasdaq 100 (in USD), weekly five-year chart
OMXS30 is currently trading below MA20—however, both MA50 at 2,205 and MA100 at 2,190 support the index from below. A break below these levels is bearish, and MA200, currently at 2,084, may very well be next.
OMXS30 (in SEK), one-year daily chart
OMXS30 (in SEK), weekly five-year chart
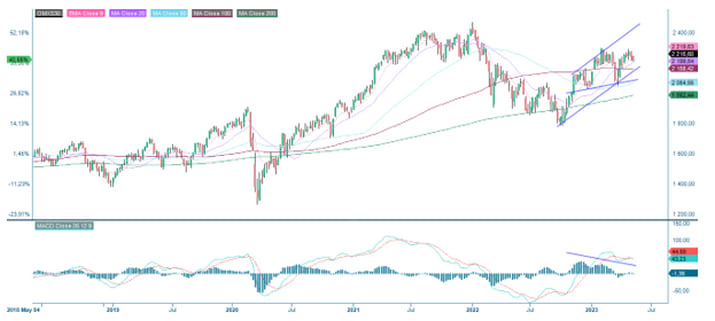
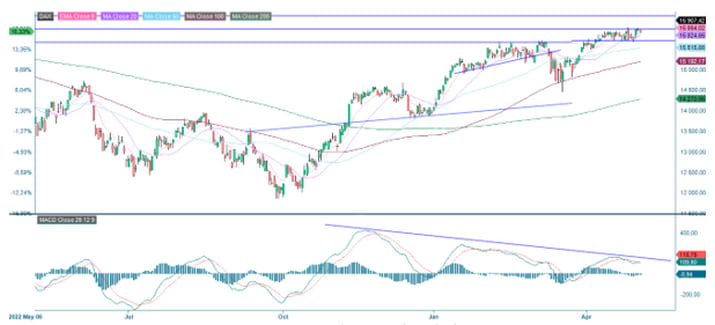
The German DAX always seems to have steam, as it recently tested resistance south of 16,000. Again, note the negative divergence between the index and MACD. A fall to gather energy is needed.
DAX (in EUR), one-year daily chart
DAX (in EUR), weekly five-year chart
The full name for abbreviations used in the previous text:
EMA 9: 9-day exponential moving average
Fibonacci: There are several Fibonacci lines used in technical analysis. Fibonacci numbers are a sequence of numbers in which each successive number is the sum of the two previous numbers.
MA20: 20-day moving average
MA50: 50-day moving average
MA100: 100-day moving average
MA200: 200-day moving average
MACD: Moving average convergence divergence
Risiko
Ekstern forfatter:
Denne informasjonen er utelukkende på gjesteforfatterens ansvar og representerer ikke nødvendigvis oppfatningen til Bank Vontobel Europe AG eller noe annet selskap i Vontobel Group. Den videre utviklingen av indeksen eller et selskap samt aksjekursen avhenger av en lang rekke selskaps-, gruppe- og sektorspesifikke samt økonomiske faktorer. Hver investor må ta hensyn til risikoen for kurstap i investeringsbeslutningen. Vær oppmerksom på at investering i disse produktene ikke vil generere løpende inntekter.
Produktene er ikke kapitalbeskyttet, i verste fall er et totalt tap av investert kapital mulig. Ved insolvens av utstederen og garantisten, bærer investoren risikoen for totaltap av sin investering. I alle fall bør investorer merke seg at tidligere resultater og/eller analytikeres meninger ikke er en tilstrekkelig indikator på fremtidig ytelse. Ytelsen til de underliggende elementene avhenger av en rekke økonomiske, entreprenørielle og politiske faktorer som bør tas i betraktning i dannelsen av en markedsforventning.
Disclaimer:
Denne informasjonen er verken et investeringsråd eller en investerings- eller investeringsstrategianbefaling, men en annonse. Den fullstendige informasjonen om handelsproduktene (verdipapirene) nevnt her, spesielt strukturen og risikoene knyttet til en investering, er beskrevet i basisprospektet, sammen med eventuelle tillegg, samt de endelige vilkårene. Grunnprospektet og de endelige vilkårene utgjør de eneste bindende salgsdokumentene for verdipapirene og er tilgjengelige under produktlenkene. Det anbefales at potensielle investorer leser disse dokumentene før de tar noen investeringsbeslutning. Dokumentene og nøkkelinformasjonsdokumentet er publisert på nettsiden til utstederen, Vontobel Financial Products GmbH, Bockenheimer Landstrasse 24, 60323 Frankfurt am Main, Tyskland, på prospectus.vontobel.com og er gratis tilgjengelig fra utstederen. Godkjenningen av prospektet skal ikke forstås som en godkjenning av verdipapirene. Verdipapirene er produkter som ikke er enkle og kan være vanskelige å forstå. Denne informasjonen inkluderer eller er relatert til tall for tidligere resultater. Tidligere resultater er ikke en pålitelig indikator på fremtidig ytelse.