Bear with us, Tesla

The leading European and US stock market indices rose by around two percentage points last week. That is, even though short-term interest rates have continued to rise. This week we look at highly valued Tesla, where the company failed to meet market expectations at last week’s Investor Day.
Relatively solid economic data but mixed signals from central bankers
On Thursday, 2 March, Eurozone CPI for February came in at an annual rate of 8.5%, down from 8.6% in January but above the consensus estimate of 8.2%. The German two-year Treasury yield rose only a few basis points on the news. One explanation may be that the yield on two-year German government bonds had already risen from 2.8% on 24 February to 3.1% on 2 March before the news.
On Thursday, 2 March, markets were also influenced by comments from Atlanta Fed President Bostic, who said it may be time for central banks to pause rate hikes until the summer of 2023. But there were also more hawkish comments from Fed members. Daly said interest rates would have to be raised to a higher level and kept there for an extended period. Barkin said that he sees interest rates peaking at 5.5-5.75%, one percentage point higher than today’s level. Lagarde from ECB noted that core inflation remains elevated, increasing the likelihood of a 50 basis point hike at the ECB meeting on 16 March. Fed will be in focus this week, too. Chairman Powell testifies before the US Senate today and on Wednesday. The Fed also releases its Beige Book on Wednesday.
Friday’s macro data was positive for the eurozone, starting with Germany’s January trade balance, where exports rose instead of falling as expected. The Eurozone Composite PMI also came in at 52.0, compared to 52.3 the previous month and an expected 50.3. Meanwhile, US producer-led inflation declined in January (minus 2.8%) against an expected increase of 1.1%. Also, in the US, the February composite PMI came in much better than expected at 50.1 versus a forecast of 46.8.
China’s services PMI rose from 52.9 in January to 55.0 in February versus the anticipated 54.7. China has set its growth target for 2023 at 5.0%, down from last year’s target of 5.5%. Last year’s result was a 3% growth due to strict Covid restrictions. The target is combined with a supportive spending plan. The relatively cautious growth target might explain why commodity prices, including oil, iron ore and copper, fell on Monday, 6 March.
Last week, European stock indices such as the CAC40, DAX and OMXS30 rose by 2.2, 2.4 and 2.1%, respectively. US stock market indices rose slightly less (Dow Jones +1.7%, S&P 500 +1.9% and Nasdaq +1.5%). The Shanghai stock market followed the general trend with a 2.2% gain last week, most of which occurred at the end of last week.
On Wednesday, 8 March, US ADP Private Employment will be released in February (expected 195K new jobs) and on Friday, Nonfarm Payrolls, where the market hopes for 200K new jobs. Last month, the market was surprised by 517,000 new jobs in the US. That significantly impacted the central bank’s view on inflation and its policy rates.
US 2-Year Treasury Yield (in %) vs US 10-Year Treasury Yield (orange, in %) in a five-year weekly charts

The spread between 2-year and 10-year US Treasury yields has widened from about 40 bps in October 2022 to 85 bps by 6 March 2023. In 2020 and 2021, the 10-year US Treasury yield was higher than the 2-year US Treasury yield, which could be considered normal.
Q4 2022 Earnings season
As of 3 March 2023, 99% of S&P 500 companies have reported their Q4 2022 results. The proportion of earnings reports that beat estimates is 69%, while the ratio of companies with revenue that surpassed estimates is 65%.
From 31 December 2022 to 28 February 2023, analysts have raised earnings estimates for only one of the eleven S&P 500 sectors, Consumer Staples, by 0.2%. The second and third best sectors are Utilities and Communication Services, where analysts have cut earnings forecasts by 0.7%. The most significant earnings revisions were seen in Real Estate & Materials, down 5.7%, and Consumer Discretionary, down 6.3%.
The forward 12-month Price/Earnings (P/E) ratio for the S& P500 is 17.5x. This P/E ratio is below the 5-year average (18.5x) but above the 10-year average (17.2x).

The S&P 500 bounced off a cluster of resistance levels. But now a tombstone
The chart below shows that the S&P 500 has managed to bounce off resistance levels. The index attempts to regain the MA20, which is essential for the short-term trend. However, a scary-looking doji in the shape of a 'tombstone' is forming. As the name "tombstone" suggests, this is a bearish candlestick. The bearish view is supported by the MACD, which recently gave a sell signal.
S&P 500 (in USD), one-year daily chart

If the index holds above the MA20, the next level to the upside will be around 4,100.
The bearish notion is also not supported on the weekly chart, where the MACD recently gave a buy signal. It may be wise to leave any profits on the downside temporarily.
S&P 500 (in USD), weekly five-year chart

A tombstone can also be found in the Nasdaq 100
The Nasdaq 100 trades in a "gravestone" candlestick but above MA20.
Nasdaq 100 (in USD), one-year daily chart

Relaterte produkter
Nasdaq 100 (in USD), weekly five-year chart

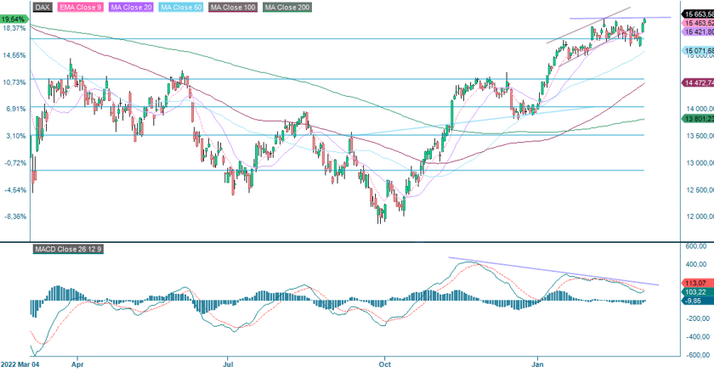
Are January 2022 levels next for the DAX?
The US indices are still in a downtrend (perhaps about to break). The DAX is in a strong uptrend and closed yesterday's trading at resistance. In case of a break, the previous top from January 2022 could be in the cards. However, the negative divergence between the index and the MACD does not support this move. A break from the falling trend on the MACD would be welcome.
DAX (in EUR), one-year daily chart
DAX (in EUR), weekly five-year chart

Will the broken wedge formation take out its rights?
The Swedish OMXS30 has broken out of a neutral wedge formation, indicating a 4-5% upside. However, a doji was formed yesterday, which signals uncertainty. As for the DAX, there is a negative divergence between the OMXS30 and MACD.
OMXS30 (in SEK), one-year daily chart

On the weekly chart, the OMXS30 is supported by a rising EMA9 and Fibonacci 81.8.
OMXS30 (in SEK), weekly five-year chart

The third time’s the charm for the oil price. Or will it get stuck?
The Brent oil price has tried to break through the MA100 resistance twice in 2023 but failed each time. Will the third time be the charm with strong figures from China? In the event of a break to the upside, the MA200, currently at 93 USD per barrel, could be next.
Brent oil price(in USD per barrel), one-year daily chart

The third time's charm is supported on the weekly chart by the MACD, which has given a weak buy signal.
Brent oil (in USD per barrel), weekly five-year chart

Bear with us, Tesla
Tesla is always in the news for several reasons. One reason is Elon Musk, Tesla’s CEO and the wealthiest in the world as of March 2023. Another is Tesla’s status as a significant disruptor in the automotive industry and a pioneer in the development and production of primarily electric vehicles (EVs). These factors, among others, have led to Tesla receiving much attention from bearish investors and even more from bullish investors. As shown in the 5-year stock chart below, Tesla’s stock is highly volatile, offering trading opportunities in both directions.

On Wednesday, 1 March, Tesla held its annual Investor Day - an event with high expectations from the market for news, outlook and more. One of the main expectations ahead of the 2023 Investor Day was the anticipated launch of a new low-cost EV model, which Elon Musk has talked about for some time. Instead, ‘Master Plan 3’ was unveiled, including plans for a new mega-factory in Mexico. This may be more promising long-term than a new model, given Tesla’s ambition to produce around 3.5 million vehicles yearly. However, the market did not find a new mega factory as attractive as a new EV model, and Tesla shares fell around 6% intraday ahead of Investor Day.
Since the start of 2023, Tesla shares have performed exceptionally well, gaining around 65%. A far better return than its peers.
Tesla is widely known as a stock whose valuation is remarkably disconnected from the company’s fundamentals. Its last twelve month P/E multiple as of 31 December 2022 is around 153x. Compared to its peers, which have an average P/E multiple of 12.1x, the disconnect from the fundamentals is still very notable. One could argue that Tesla is more of a technology company than an automaker, but Tesla’s core business is making and selling cars. As such, it should be viewed first and foremost as a car company.
Combining the market’s disappointment with the outcome of Tesla’s Investor Day, the stock’s performance so far in 2023, and its fundamentally disconnected valuation, it could be argued that the decline in Tesla stock over the past few days will continue, at least in the short term. On the contrary, Tesla’s bulls have proven the bears wrong time and time again, so the decline could just as quickly be a buying opportunity.
TESLA, (in USD) 1-yr daily stock chart

The full name for abbreviations used in the previous text:
EMA 9: 9-day exponential moving average
Fibonacci: There are several Fibonacci lines used in technical analysis. Fibonacci numbers are a sequence in which each successive number is the sum of the two previous numbers.
MA20: 20-day moving average
MA50: 50-day moving average
MA100: 100-day moving average
MA200: 200-day moving average
MACD: Moving average convergence divergence
Risiko
Ekstern forfatter:
Denne informasjonen er utelukkende på gjesteforfatterens ansvar og representerer ikke nødvendigvis oppfatningen til Bank Vontobel Europe AG eller noe annet selskap i Vontobel Group. Den videre utviklingen av indeksen eller et selskap samt aksjekursen avhenger av en lang rekke selskaps-, gruppe- og sektorspesifikke samt økonomiske faktorer. Hver investor må ta hensyn til risikoen for kurstap i investeringsbeslutningen. Vær oppmerksom på at investering i disse produktene ikke vil generere løpende inntekter.
Produktene er ikke kapitalbeskyttet, i verste fall er et totalt tap av investert kapital mulig. Ved insolvens av utstederen og garantisten, bærer investoren risikoen for totaltap av sin investering. I alle fall bør investorer merke seg at tidligere resultater og/eller analytikeres meninger ikke er en tilstrekkelig indikator på fremtidig ytelse. Ytelsen til de underliggende elementene avhenger av en rekke økonomiske, entreprenørielle og politiske faktorer som bør tas i betraktning i dannelsen av en markedsforventning.
Disclaimer:
Denne informasjonen er verken et investeringsråd eller en investerings- eller investeringsstrategianbefaling, men en annonse. Den fullstendige informasjonen om handelsproduktene (verdipapirene) nevnt her, spesielt strukturen og risikoene knyttet til en investering, er beskrevet i basisprospektet, sammen med eventuelle tillegg, samt de endelige vilkårene. Grunnprospektet og de endelige vilkårene utgjør de eneste bindende salgsdokumentene for verdipapirene og er tilgjengelige under produktlenkene. Det anbefales at potensielle investorer leser disse dokumentene før de tar noen investeringsbeslutning. Dokumentene og nøkkelinformasjonsdokumentet er publisert på nettsiden til utstederen, Vontobel Financial Products GmbH, Bockenheimer Landstrasse 24, 60323 Frankfurt am Main, Tyskland, på prospectus.vontobel.com og er gratis tilgjengelig fra utstederen. Godkjenningen av prospektet skal ikke forstås som en godkjenning av verdipapirene. Verdipapirene er produkter som ikke er enkle og kan være vanskelige å forstå. Denne informasjonen inkluderer eller er relatert til tall for tidligere resultater. Tidligere resultater er ikke en pålitelig indikator på fremtidig ytelse.