Corn prices could go against the grain

Solid economic activity in the USA led to sharp movements in interest rates towards the end of last week. Higher interest rates mean higher yield requirements, which weighed on equity prices, particularly in the US. This was although companies in the IT sector of the S&P 500 index reported the best Q4 2022 results relative to expectations. This week we look at corn, where a price rebound against the grain is possible.
Expectations for US rate hike up another 0.2%
US equity markets fell on Friday, 26 February, after a PCE (personal consumption expenditures) report showed that inflation is not slowing at the market’s expected pace. The interest rate-sensitive Nasdaq 100 fell more than the S&P 500 and Dow Jones. Information technology, real estate and consumer durables were the biggest decliners among sectors. US core PCE in January 2023 was 0.6% higher than in December 2022 and 4.7% higher than in January 2022.
At the same time, other indicators showed that the US economy continues to perform strongly - in the form of higher retail growth, increased housing activity and improved consumer confidence. But this is also inflationary, which naturally pushes up interest rates. The interest rate market has now raised the expected peak in US interest rates to 5.4% from 5.2% a week ago.
US 2-Year Treasury Yield (in %) in a five-year weekly graph

On Wednesday, 1 March, industrial Purchasing Managers’ Indices (PMIs) for February will be released from China, Sweden, Spain, Italy, France, Germany, the UK and the US. Overall, a slowdown is expected. China's activity data will be of particular interest following the reopening of its economy in December.
On Tuesday, 28 February and Thursday, 2 March, we will get Consumer Price Index (CPI) figures for February from Germany, France, Italy and Spain. Tuesday's Spanish CPI figures were slightly higher than expected and might indicate the outcome. For the Eurozone, annual inflation is expected to have declined from 8.6% in January to 8.2% in February.
On Thursday, 2 March, we will receive the minutes of the ECB's meeting on 2 February. The tone of the ECB's message over the past few months has been tightening.
Looking at the performance of the major stock indices (in Europe, the US and Asia), the European index appear more buoyant. In contrast, the US (especially the Nasdaq) and Asian indices show a more negative trend. The US economy is doing well, so interest rates and yields are rising. This contrasts with Europe, which is in a slowdown phase but where expectations of an improvement are starting to be discounted in equity prices.
Significant stock indices performance in one month, three months and one year

Analysts expect weak first half and a better second half in 2023
As of 24 February 2023, 94% of S&P 500 companies have reported their Q4 2022 results. The proportion of earnings reports that beat estimates are 68%, while the ratio of companies with revenue that beat estimates is 66%, up from 65% a week ago.
The S&P 500 sectors that have been most successful in beating analysts' Q4 2022 earnings forecasts are Information Technology (82% of Q4 earnings better than expected), followed by Health Care (74%) and Real Estate (71%). The worst performers are Utilities (63%), Materials (59%) and Commercial Services (44%).
In Q4 2022, S&P 500 earnings fell 4.8% compared to Q4 2021. For Q1 and Q2 2023, analysts expect S&P 500 earnings to fall 5.7% and 3.7%, respectively, compared to the same quarter in 2022. Then, according to FactSet Earnings Insight, analysts expect the economy to improve, with earnings growth of 3.0% in Q3 2023 and 9.7% in Q4 2023 for the S&P 500 companies.
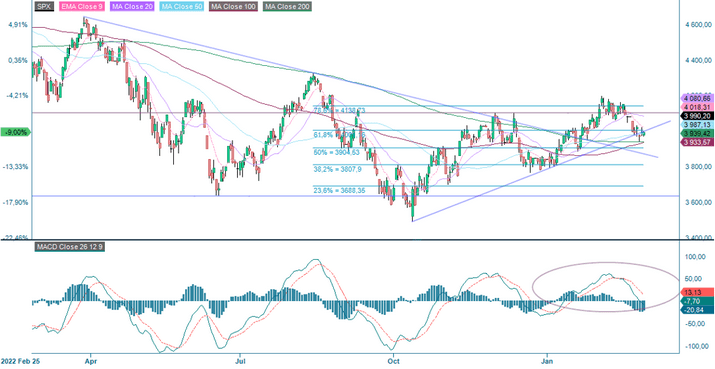
S&P 500 at a cluster of support levels
S&P 500 is trading at a cluster of support levels in the shape of the rising trendline and MA200. Given the lack of direction during the last trading days, the market is waiting for new information to find its next direction. MACD has generated a sell signal, and the risk is thus still tilted to the downside. A break below Fibonacci 50, just above 3,900, and the downside risk is growing.
S&P 500 (in USD), one-year daily graph
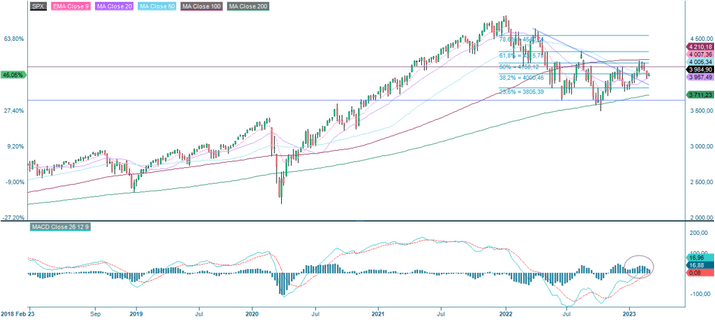
The weekly graph adds little valuable information from a technical point of view of what direction is next.
S&P 500 (in USD), weekly five-year graph
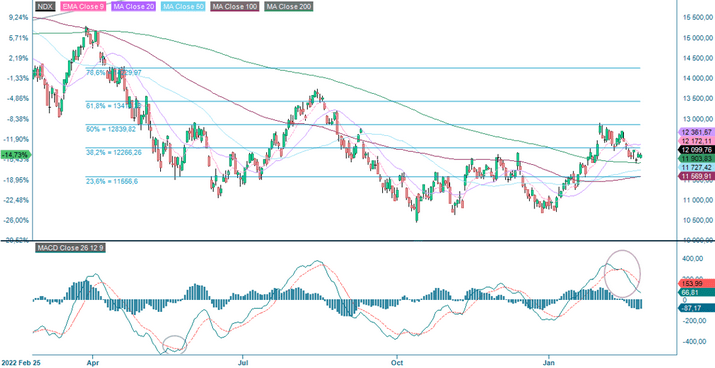
Nasdaq 100 is holding up well
Despite recent development with rising rates, tech-heavy Nasdaq 100 has been doing quite well by trading sideways. That may be an indication that the risk appetite is still out there. MACD is a factor of worry. MA200, currently at 11,903, serves as support on the downside.
Nasdaq 100 (in USD), one-year daily graph
Relaterte produkter
Nasdaq 100 (in USD), weekly five-year graph

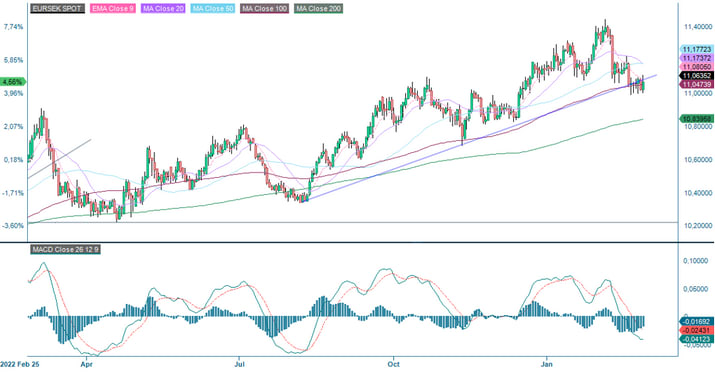
Will European inflation figures cause EUR to strengthen against SEK?
In the US, the latest inflation reading exceeded expectations. Will this be the case even for the Eurozone? Such a scenario may give strength to the euro against the SEK. The currency pair EUR/SEK is currently trading at support made up by the rising trendline and MA100. A break above MA20 is currently at 11.17; the previous top from early February may be next. In case of a break to the downside, the next support level is made up by MA200, currently at 10.83.
EUR/SEK, one-year daily graph
The currency pair also finds support around its current levels in the weekly graph.
EUR/SEK, weekly five-year graph

Support levels are also being tested in Europe
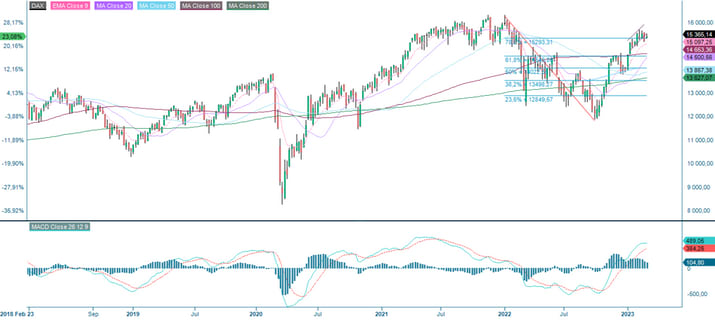
The German DAX has been trading sideways since the beginning of February. Rising MA20 is being tested. Falling MACD and negative divergence with the index are lingering. MA100, currently at 14,950 make up the next level on the downside.
DAX (in EUR), one-year daily graph

DAX (in EUR), weekly five-year graph
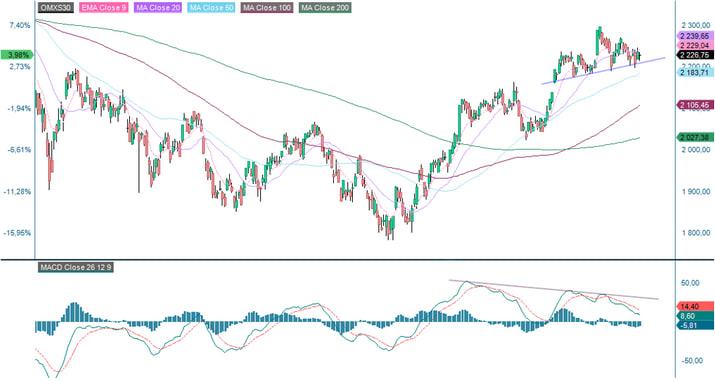
In Sweden, the negative divergence between the index and MACD is worrisome. A break below the short-rising trendline may close the gap at about 2,140.
OMXS30 (in SEK), one-year daily graph
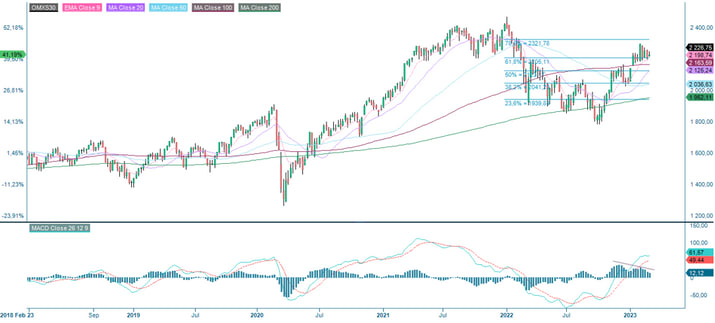
OMXS30 (in SEK), weekly five-year graph
Corn might be about to go against the grain
Corn has been at the centre of many recent headlines, with grain shipments from Ukraine uncertain. Coupled with forecasts that supply will outstrip demand, the outlook looks bleak. However, what makes corn interesting from an investment perspective is that several moving parts contribute to the current decline. If one or more of these stops moving, a bounce is possible.
Top 4 Corn exporters (Millions of tonnes, Oct-Sep years)
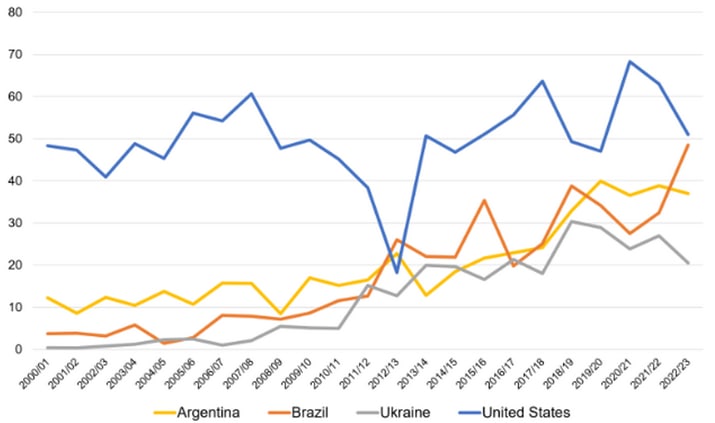
The primary grain exporters are in turmoil, with the US starting to lose out to the other three of the big four, Brazil, Argentina and Ukraine. The reopening of China, the largest importer of maise, where it is mainly used as feed, has brought back a significant source of demand. Further demand is forecast to come from Europe, with maise imports forecast to reach 23.5 million tonnes in 2022/23 (October-September)..
Despite demand pressures, stellar growth in Brazil is keeping a lid on corn prices, with the 2022/23 corn crop at a record 125 million tonnes. The large harvest has brought Brazil closer to the US regarding exports, with the possibility of overtaking the US if the coming North American crop is smaller than expected. The US crop season begins in March, with planting typically lasting two months and harvest in the autumn around October. As for the third largest exporter, Argentina, there are some dark clouds on the supply horizon.
However, it has been quite the opposite, with too much sun and dryness damaging crops at critical stages of development, leading to lower yields being forecast for early-planted corn. As for Ukraine, the final member of the Big Four, it is currently expected that Russia and Turkey will agree to extend the trade deal that allows safe passage for Ukrainian ships carrying grain. With the original agreement expiring in March, the risk of the deal falling through is a possible short-term trigger.
Top 4 Corn exporters (Millions of tonnes, Oct-Sep years)
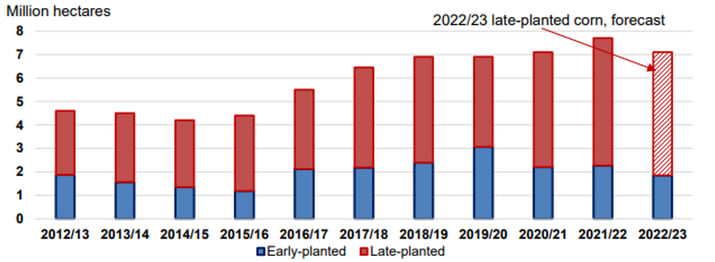
Corn and soybean futures, which share the planting season, have a seasonality where prices tend to rise during planting. This is due to the build-up of a risk premium to cover the risks associated with weather that may delay planting. As noted above, for Argentina, the weather during planting is critical to the yield of the subsequent crop. The risk of a renewed lack of rain is a potential short-term trigger that could cause prices to rebound.
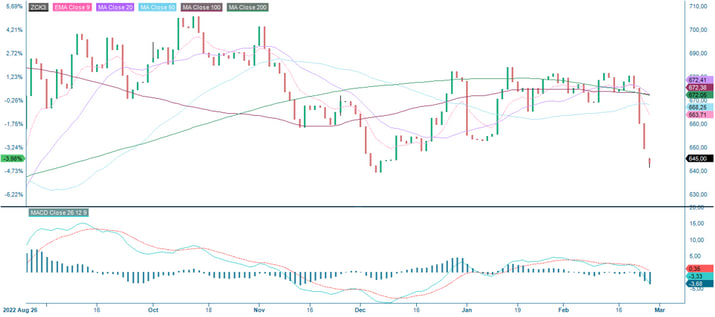
Corn Future May 2023 (USD/Bu) daily 6-month price graph
Corn Future Front Month (USD/Bushel) weekly 5 year price graph
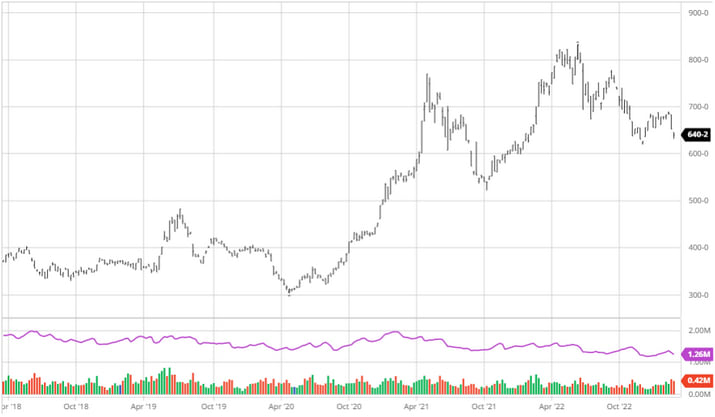
The corn price has recently broken through the upwardly sloping support level since the sharp decline in July and August, dropping over 5%. Combining this sharp drop with the above, there are opportunities for corn to bounce further in the coming months. With several short-term triggers and more long-term demand from China and the EU, the sideways movement that has been in place since September could be broken.
The full name for abbreviations used in the previous text:
EMA 9: 9-day exponential moving average
Fibonacci: There are several Fibonacci lines used in technical analysis. Fibonacci numbers are a sequence of numbers in which each successive number is the sum of the two previous numbers.
MA20: 20-day moving average
MA50: 50-day moving average
MA100: 100-day moving average
MA200: 200-day moving average
MACD: Moving average convergence divergence
Risiko
Ekstern forfatter:
Denne informasjonen er utelukkende på gjesteforfatterens ansvar og representerer ikke nødvendigvis oppfatningen til Bank Vontobel Europe AG eller noe annet selskap i Vontobel Group. Den videre utviklingen av indeksen eller et selskap samt aksjekursen avhenger av en lang rekke selskaps-, gruppe- og sektorspesifikke samt økonomiske faktorer. Hver investor må ta hensyn til risikoen for kurstap i investeringsbeslutningen. Vær oppmerksom på at investering i disse produktene ikke vil generere løpende inntekter.
Produktene er ikke kapitalbeskyttet, i verste fall er et totalt tap av investert kapital mulig. Ved insolvens av utstederen og garantisten, bærer investoren risikoen for totaltap av sin investering. I alle fall bør investorer merke seg at tidligere resultater og/eller analytikeres meninger ikke er en tilstrekkelig indikator på fremtidig ytelse. Ytelsen til de underliggende elementene avhenger av en rekke økonomiske, entreprenørielle og politiske faktorer som bør tas i betraktning i dannelsen av en markedsforventning.
Disclaimer:
Denne informasjonen er verken et investeringsråd eller en investerings- eller investeringsstrategianbefaling, men en annonse. Den fullstendige informasjonen om handelsproduktene (verdipapirene) nevnt her, spesielt strukturen og risikoene knyttet til en investering, er beskrevet i basisprospektet, sammen med eventuelle tillegg, samt de endelige vilkårene. Grunnprospektet og de endelige vilkårene utgjør de eneste bindende salgsdokumentene for verdipapirene og er tilgjengelige under produktlenkene. Det anbefales at potensielle investorer leser disse dokumentene før de tar noen investeringsbeslutning. Dokumentene og nøkkelinformasjonsdokumentet er publisert på nettsiden til utstederen, Vontobel Financial Products GmbH, Bockenheimer Landstrasse 24, 60323 Frankfurt am Main, Tyskland, på prospectus.vontobel.com og er gratis tilgjengelig fra utstederen. Godkjenningen av prospektet skal ikke forstås som en godkjenning av verdipapirene. Verdipapirene er produkter som ikke er enkle og kan være vanskelige å forstå. Denne informasjonen inkluderer eller er relatert til tall for tidligere resultater. Tidligere resultater er ikke en pålitelig indikator på fremtidig ytelse.