Inflation and interest rates remain in focus

This week, the market continues to focus on the inflation rate related to US statistics. We look at the spread between the OMX and the DAX and the movement in gold after Valentine's Day. This week's case study is sugar, where we see three reasons the price may have peaked.
US statistics drive interest rates
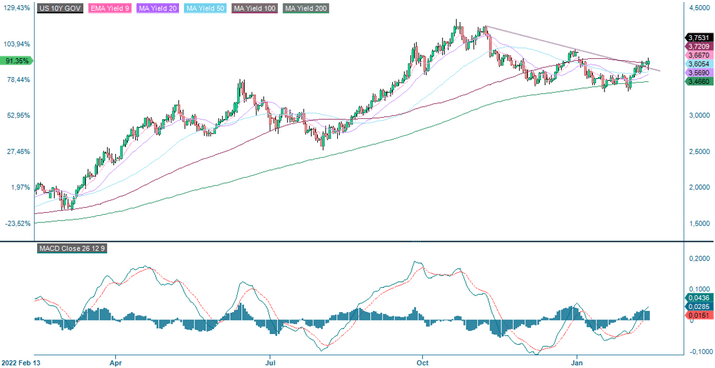
US equity markets turned higher on Friday, 10 February, after a cautious start. The S&P 500 and Dow Jones performed more robustly than the Nasdaq, which was pressured by rising US interest rates. US inflation data on Tuesday, 14th February, came in slightly higher than expected at 6.4% annual inflation compared to 6.2% anticipated. Last month's figure was 6.5%. Thus, the trend is still positively falling but at a slower pace.
Today, Wednesday, the 15th of February, US retail sales figures for January will be released. That will also likely influence investors' views on inflation and interest rates. Consumer spending accounts for 70% of the US GDP, making this statistic particularly important for the stock market.
European central banks have a more challenging time-fighting inflation than the Fed. That is because inflation in the eurozone and Sweden is running at around 10% per year, partly due to imported inflation due to the strong USD. In Sweden, the new Riksbank Governor, Erik Thedéen, strengthened the SEK by 1.2% after his interest rate announcement on Thursday, 9th February. However, the United States is at the forefront of a trend of slightly lower inflation.
On the commodities side, we note that oil prices rose slightly last week after Russia decided to cut its oil production by 0.5 million barrels in March.
US 10-Year Treasury Yield (in %) in a one-year daily chart
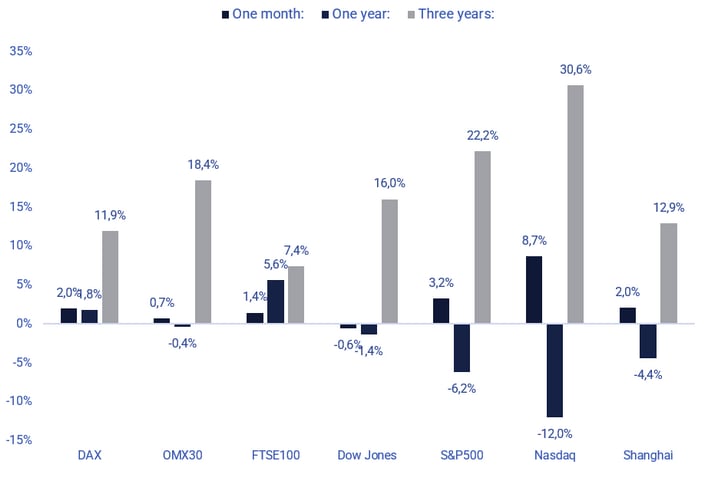
Over the past month, we have seen the relatively best performance from US equity markets, led by the Nasdaq 100 and the S&P 500. At the same time, European equity markets have been weaker, probably linked to the outcome of the Q4 2022 earnings season, where economic signals have been weaker in China and nearby parts of Asia, mixed in Europe and more robust in the United States. According to Factset Earnings Insight's Q4 2022 report compilations, S&P500 companies with greater exposure to the North American domestic market have outperformed more export-oriented US companies in earnings performance.
Highest earnings growth for Energy and Industrials in the US
Until Friday, 10 February 2023, 69% of S&P500 companies have reported their Q4 2022 results. The number of better-than-expected earnings has eased slightly to 69%, down from 70% a week ago. Meanwhile, the number of better-than-anticipated revenue reports has increased from 61% to 63%.
The Energy and Industrials sectors achieved the highest earnings growth in Q4 2022. The Materials and Commercial Services sectors have the most significant earnings decline in Q4 2022.
The S&P 500 sectors that have managed to beat analysts' Q4 2022 earnings forecasts by the most significant margin are Utilities (86% of Q4 earnings better than expected), followed by Information Technology and Health Care (77%). The worst performers are Energy (64%), Financials (63%) and Commercial Services (48%).
We have also compiled the Q4 2022 reports of 69 Nasdaq Stockholm and three Nasdaq Helsinki companies. 58% of these Q4 reports had better-than-expected results, while 74% of the Q4 reports had higher-than-expected revenues.
Long OMXS30, short DAX – an interesting spread?
Last Friday, the Swedish OMXS30 broke down from a narrow rising wedge. However, the index found strength on Monday of this week. Yesterday a doji was formed, indicating uncertainty after the US inflation figures. The market will likely take a trading day or so for investors to digest the new information. The negative divergence between the index and the MACD remains.
OMXS30 (in SEK), one-year daily chart

The weekly chart is a little more positive. The chart below shows that the MACD has recently generated a buy signal. A break above the Fibonacci 50 and MA100, at 4,150 and 4,210, respectively, could see the pair target the 4,300 level, where the Fibonacci 61.8 converges.
OMXS30 (in SEK), weekly five-year chart
Compared to the OMXS30, the German DAX has recovered better from its losses earlier in the year. However, the index has recently been consolidating for some time and is struggling to find a direction. As for the OMXS30, there is still a negative divergence between the index and the MACD. A break to the downside below the MA20, currently at 15,240, and the MA50 at 14,700, could be the next target.
DAX (in EUR), one-year daily chart

The weekly chart below shows that the DAX consolidates at the 78.6 Fibonacci level. Momentum is rising but fading, as the MACD histogram shows. Does the spread, short DAX, long OMXS30, look interesting?
DAX (in EUR), weekly five-year chart

Uncertainty in the S&P 500, but looks attractive on the weekly chart
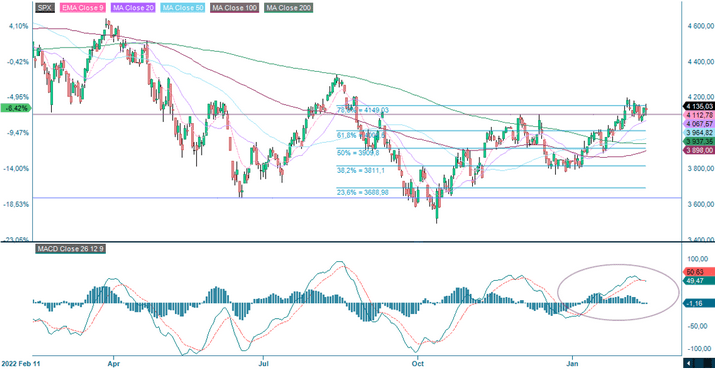
A doji was formed in the S&P 500 after yesterday's inflation figure. Uncertainty is imminent. Resistance on the upside is between 4,150 and 4,200. Note that the MACD has generated a weak sell signal. On the downside, the index is supported by the rising MA20, currently at 4,067.
S&P 500 (in USD), one-year daily chart
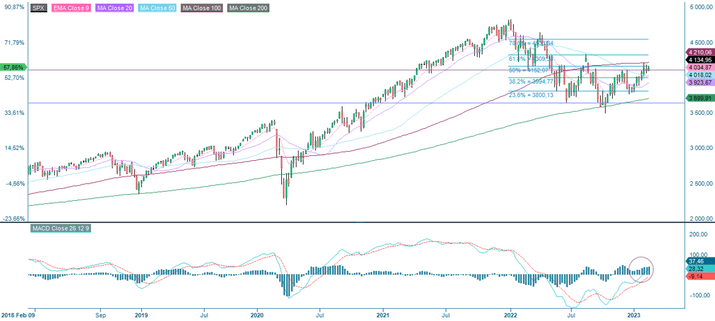
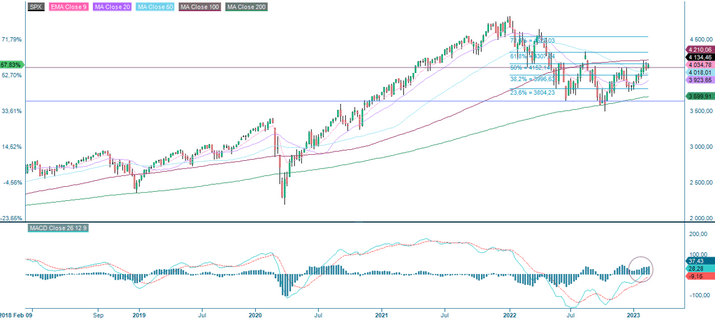
On the weekly chart, the index is consolidating around its Fibonacci 50 and MA200, which act as resistance. On the other hand, the MACD has recently given a buy signal.
S&P 500 (in USD), weekly five-year chart
Nasdaq 100 does not look too weak on the weekly chart either
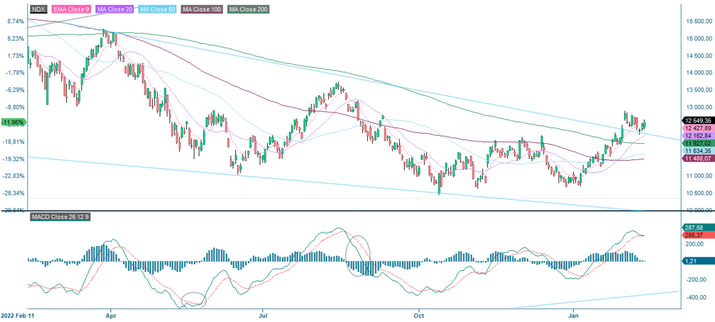
The Nasdaq 100 closed yesterday’s higher trading despite rising interest rates. The MACD has given a weak sell signal, and the rising MA20 acts as a support, currently at 12,162.
Nasdaq 100 (in USD), one-year daily chart
Relaterte produkter
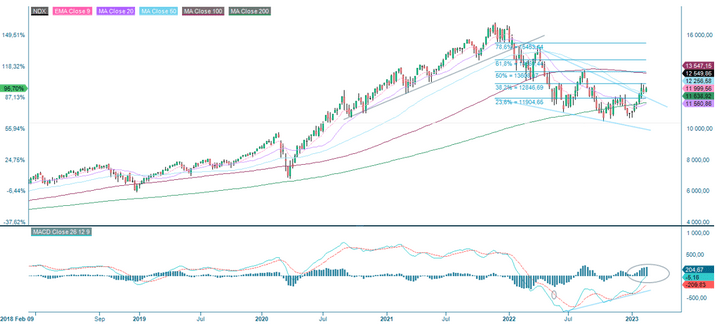
The Nasdaq 100 looks attractive on the weekly chart, with the shorter moving averages acting as support. The MACD has recently given a buy signal. A break above the 38.2% Fibonacci at 12,846, the 50 Fibonacci and the MA200 between 13,547 and 13,608 could be next.
Nasdaq 100 (in USD), weekly five-year chart
Will gold continue to shine after valentines day?
Gold was sold off quite heavily on Monday and is currently trading at Fibonacci 50. The real demand for gold comes mainly from the jewellery industry. Will the fun be over when Valentine's Day is over for this year, and inflation is falling? Also, note how the MACD has generated a weak sell signal.
Gold (in USD per ounce), one-year daily chart

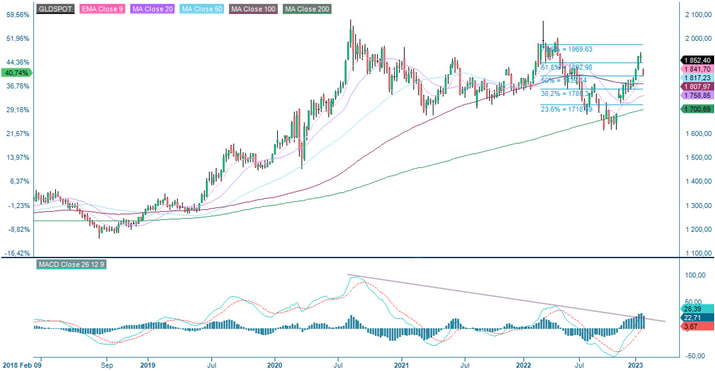
On the weekly chart, there is a scary-looking negative divergence between the gold price and the MACD, just waiting to take out its right side. However, the Fibonacci 50 continues to support the weekly chart. Keep an eye on the USD once the new data has been digested.
Gold (in USD per ounce), weekly five-year chart
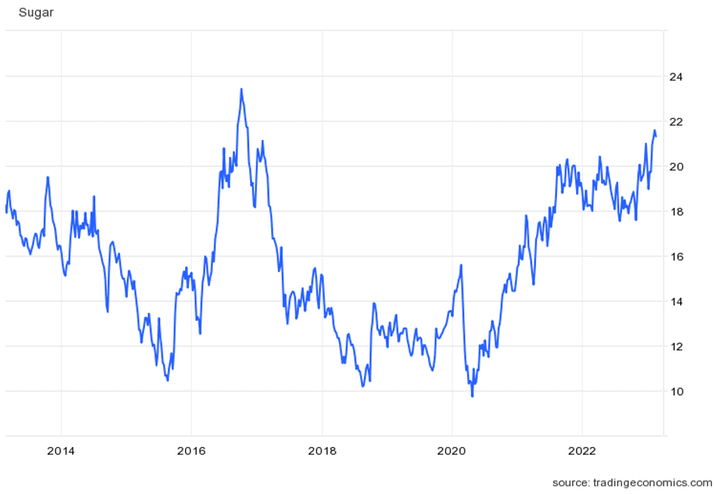
Case of the week - Sugar is starting 2023 on six-year peak levels
At the beginning of the century, understanding global sugar consumption was straightforward. Usually, sugar consumption worldwide increases by 2% annually, with 1% attributed to population growth and 1% to growing wealth. Since around 2014, people have become more aware of the sugar in their food and drinks, causing consumption growth to slow. Currently, sugar consumption only grows at the same pace as the world's population. In many developed countries, it's declining.
Despite the decrease in sugar consumption in food, demand for sucrose remains high, and a large part of the growth comes from India. Sucrose from cane and beet can be used to make ethanol for gasoline. India plans to have a 20% blend of ethanol in gasoline by 2025. Before the COVID-19 pandemic, demand for road fuel was high, growing at around 7% per year, mainly for motorcycle engines.
As we head into 2023, Raw Sugar futures on the Intercontinental Exchange (ICE) are close to a six-year peak of 21.86 cents due to concerns over limited supplies and strong demand expectations. The demand is anticipated to be strong this year as China's economy reopens after two years of shutdown. However, the sucrose supply is uncertain, with production in Europe and India affected by weather conditions and uncertainty over this season's crop, with India's output expected to be 7% lower.
With the increased uncertainty that strong demand for sucrose will meet production output in Europe and India, Raw Sugar Futures on ICE are at peak levels. The current price levels offer an attractive short position, which will be supported by:
- Weaker demand expectations than previously anticipated due to a slower reopening of China.
- An improvement in the production outlook in India and Europe ahead of the crop season.
- India's economy is not expected to return to pre-COVID levels during 2023.
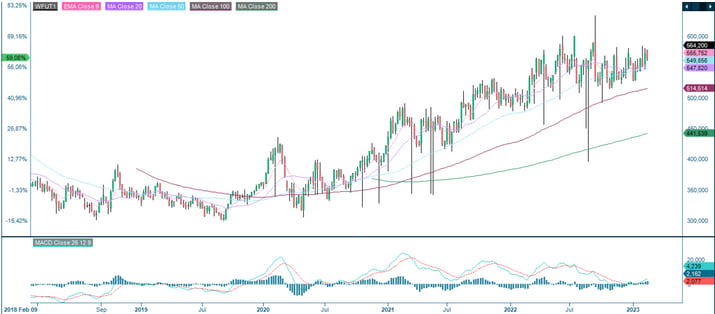
White Sugar Future ICEU, Current Rolling, one-year daily chart

Relaterte produkter
White Sugar Future ICEU, Current Rolling, weekly five-year chart
The full name for abbreviations used in the previous text:
EMA 9: 9-day exponential moving average
Fibonacci: There are several Fibonacci lines used in technical analysis. Fibonacci numbers are a sequence of numbers in which each successive number is the sum of the two previous numbers.
MA20: 20-day moving average
MA50: 50-day moving average
MA100: 100-day moving average
MA200: 200-day moving average
MACD: Moving average convergence divergence
Risiko
Ekstern forfatter:
Denne informasjonen er utelukkende på gjesteforfatterens ansvar og representerer ikke nødvendigvis oppfatningen til Bank Vontobel Europe AG eller noe annet selskap i Vontobel Group. Den videre utviklingen av indeksen eller et selskap samt aksjekursen avhenger av en lang rekke selskaps-, gruppe- og sektorspesifikke samt økonomiske faktorer. Hver investor må ta hensyn til risikoen for kurstap i investeringsbeslutningen. Vær oppmerksom på at investering i disse produktene ikke vil generere løpende inntekter.
Produktene er ikke kapitalbeskyttet, i verste fall er et totalt tap av investert kapital mulig. Ved insolvens av utstederen og garantisten, bærer investoren risikoen for totaltap av sin investering. I alle fall bør investorer merke seg at tidligere resultater og/eller analytikeres meninger ikke er en tilstrekkelig indikator på fremtidig ytelse. Ytelsen til de underliggende elementene avhenger av en rekke økonomiske, entreprenørielle og politiske faktorer som bør tas i betraktning i dannelsen av en markedsforventning.
Disclaimer:
Denne informasjonen er verken et investeringsråd eller en investerings- eller investeringsstrategianbefaling, men en annonse. Den fullstendige informasjonen om handelsproduktene (verdipapirene) nevnt her, spesielt strukturen og risikoene knyttet til en investering, er beskrevet i basisprospektet, sammen med eventuelle tillegg, samt de endelige vilkårene. Grunnprospektet og de endelige vilkårene utgjør de eneste bindende salgsdokumentene for verdipapirene og er tilgjengelige under produktlenkene. Det anbefales at potensielle investorer leser disse dokumentene før de tar noen investeringsbeslutning. Dokumentene og nøkkelinformasjonsdokumentet er publisert på nettsiden til utstederen, Vontobel Financial Products GmbH, Bockenheimer Landstrasse 24, 60323 Frankfurt am Main, Tyskland, på prospectus.vontobel.com og er gratis tilgjengelig fra utstederen. Godkjenningen av prospektet skal ikke forstås som en godkjenning av verdipapirene. Verdipapirene er produkter som ikke er enkle og kan være vanskelige å forstå. Denne informasjonen inkluderer eller er relatert til tall for tidligere resultater. Tidligere resultater er ikke en pålitelig indikator på fremtidig ytelse.