The trend towards value stocks favourable for Dow Jones

The trend of falling inflation and lower long-term interest should benefit value stocks. In recent quarters, orders have been firm for industrial and capital goods. One way to get such exposure is via the Dow Jones Industrial Index.
Major stock markets have traded slightly lower ahead of the US Consumer Price Index (CPI) figures for November today and the Fed's interest rate decision tomorrow, Wednesday, 14 December. The US Producer Price Index (PPI) figures for November were slightly higher than anticipated, 0.3% against expectations of 0.2%. But in annual terms, inflation in the US has fallen from 9.7% in July to 7.4% in November 2022.
This is also reflected in the 10-year US Treasury yield, which has declined from 4.22% on 21 October to 3.61% as of 12 December 2022.
US 10-year Treasury Yield (in %)

At the same time, order intake for industrial goods remains good in Europe and the US, partly affected by previous major supply disruptions. One sector that invests heavily in industrial goods is, unsurprisingly, energy-producing companies. But the coming energy transition also drives demand and product development in the automotive sector. Businesses have been ordering more to ensure they receive the deliveries that have been delayed.
We believe that the current interest rate and inflation environment, which now seems to be falling back to a somewhat more stable and lower level, could be favourable for value stocks. That includes companies that can provide a high and stable dividend and whose businesses also benefit from the possibility of better-operating margins given lower input prices. Such companies are, for example, found in the engineering and construction sectors.
Despite these developments, the Dow Jones index has fallen back recently. This could offer an opportunity to invest in this index with giants such as Apple, Caterpillar, Coca-Cola, and General Electric, plus stable dividend stocks such as Walgreens Boots Alliance.
Dow Jones Industrial Index, a daily one-year graph
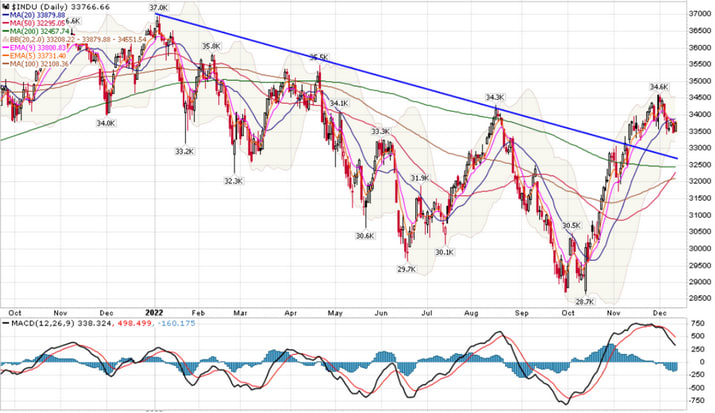
Technically, the Dow Jones Industrial does not look that strong since it has fallen below MA20. At the same time, there is support further down in the form of the MA200 and MA100.
Dow Jones Industrial index, a weekly five-year share price chart

The full name for abbreviations used in the previous text:
EMA 5: 5-day exponential moving average
EMA 9: 9-day exponential moving average
Fibonacci: There are several Fibonacci lines used in technical analysis. Fibonacci numbers are a sequence of numbers in which each successive number is the sum of the two previous numbers.
MA20: 20-day moving average
MA50: 50-day moving average
MA100: 100-day moving average
MA200: 200-day moving average
MACD: Moving average convergence divergence
BB(20,2,0): Bollinger bands is a line used in technical analysis, it is a set of trendlines plotting two standard deviations away from the MA20.
Risiko
Ekstern forfatter:
Denne informasjonen er utelukkende på gjesteforfatterens ansvar og representerer ikke nødvendigvis oppfatningen til Bank Vontobel Europe AG eller noe annet selskap i Vontobel Group. Den videre utviklingen av indeksen eller et selskap samt aksjekursen avhenger av en lang rekke selskaps-, gruppe- og sektorspesifikke samt økonomiske faktorer. Hver investor må ta hensyn til risikoen for kurstap i investeringsbeslutningen. Vær oppmerksom på at investering i disse produktene ikke vil generere løpende inntekter.
Produktene er ikke kapitalbeskyttet, i verste fall er et totalt tap av investert kapital mulig. Ved insolvens av utstederen og garantisten, bærer investoren risikoen for totaltap av sin investering. I alle fall bør investorer merke seg at tidligere resultater og/eller analytikeres meninger ikke er en tilstrekkelig indikator på fremtidig ytelse. Ytelsen til de underliggende elementene avhenger av en rekke økonomiske, entreprenørielle og politiske faktorer som bør tas i betraktning i dannelsen av en markedsforventning.
Disclaimer:
Denne informasjonen er verken et investeringsråd eller en investerings- eller investeringsstrategianbefaling, men en annonse. Den fullstendige informasjonen om handelsproduktene (verdipapirene) nevnt her, spesielt strukturen og risikoene knyttet til en investering, er beskrevet i basisprospektet, sammen med eventuelle tillegg, samt de endelige vilkårene. Grunnprospektet og de endelige vilkårene utgjør de eneste bindende salgsdokumentene for verdipapirene og er tilgjengelige under produktlenkene. Det anbefales at potensielle investorer leser disse dokumentene før de tar noen investeringsbeslutning. Dokumentene og nøkkelinformasjonsdokumentet er publisert på nettsiden til utstederen, Vontobel Financial Products GmbH, Bockenheimer Landstrasse 24, 60323 Frankfurt am Main, Tyskland, på prospectus.vontobel.com og er gratis tilgjengelig fra utstederen. Godkjenningen av prospektet skal ikke forstås som en godkjenning av verdipapirene. Verdipapirene er produkter som ikke er enkle og kan være vanskelige å forstå. Denne informasjonen inkluderer eller er relatert til tall for tidligere resultater. Tidligere resultater er ikke en pålitelig indikator på fremtidig ytelse.