When is Microsoft cheap?


Last week offered a substantial share price rise until Wednesday and a rebound. The S&P 500 was up 0.25 percent, and the Nasdaq was down 1.54 percent during the week.
Fed chief Powell gave stock markets in the US a boost on Wednesday by saying he is ruling out a 75-point rate hike in September. But on Thursday, US stock markets fell back more than they rose on Wednesday (Nasdaq down 5.0 percent).
There are different views as to what triggered this decline. But investors shifting towards believing in higher interest rates again could be a reason (the Bank of England expressed that there could be 10 percent inflation before it falls back again). Last week the 10-year US Treasury yield climbed another 20 basis points from 2,94 to 3,14 percent.
But there may also be increased liquidity and credit risks discounted by the stock market. One price rise tends to drive the subsequent price rise, and the opposite is true. These are so-called margin calls, i.e., investors who have become overleveraged and need to sell.
On Friday, May 6, the April employment figure from the US came in 428K new jobs against an expected 380K. However, the unemployment rate rose from 3.5 to 3.6 percent. On balance, it did not affect S&P 500 performance that much.
US 10-year treasury yield (in %), one-year chart
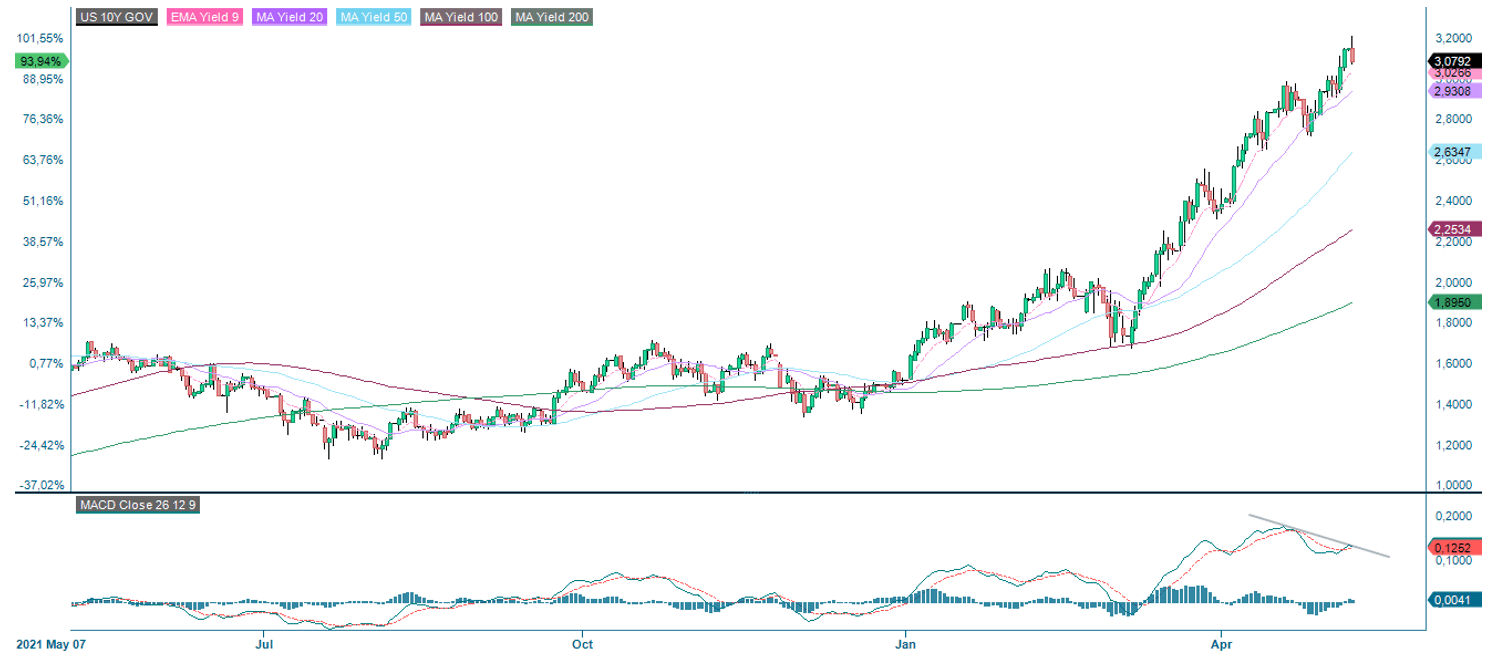
Source: Infront. Note: Past performance is not a reliable indicator of future results.
The US 10-year Treasury yield is back around previous highs from 2018, as seen in the five-year chart below.
US 10-year Treasury yield (in %), five-year chart
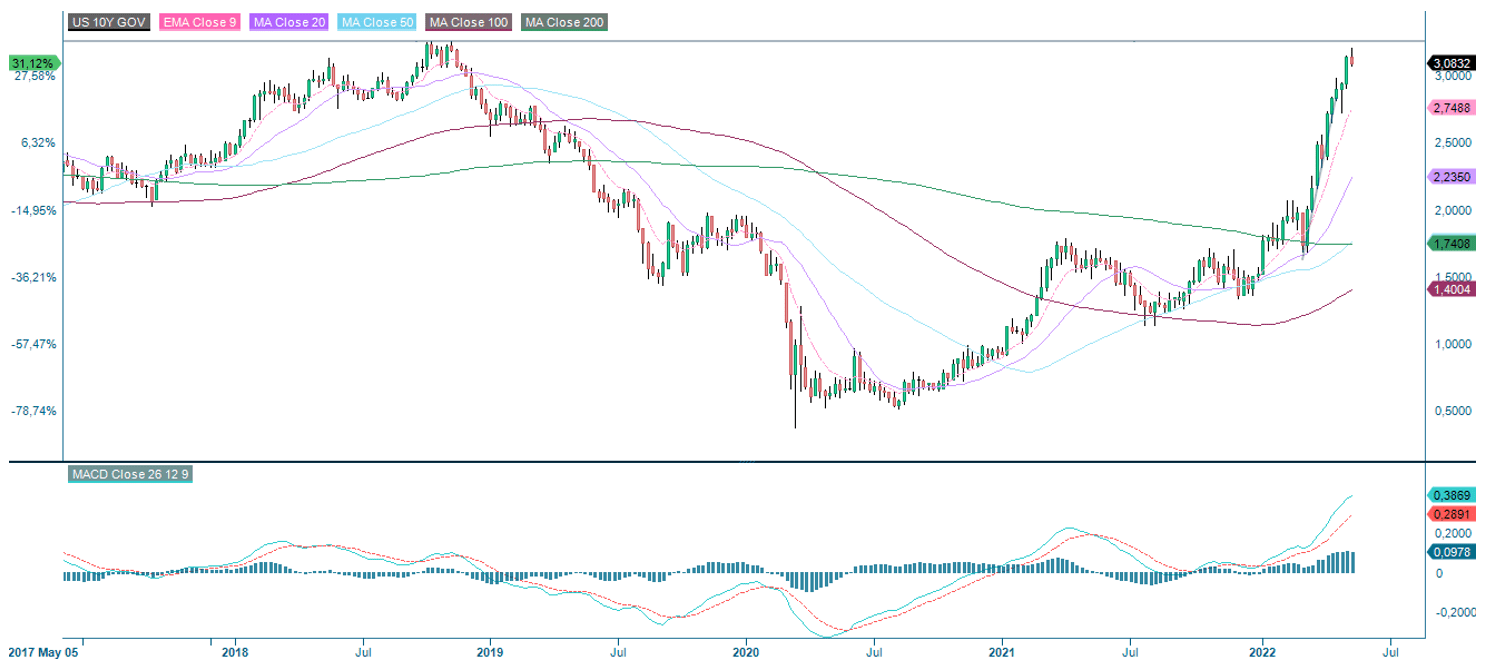
Source: Infront. Note: Past performance is not a reliable indicator of future results.
After the past week, about 87 percent of all S&P 500 companies have reported their Q1 2022 results. Seventy-nine percent of companies have positively surprised earnings, while 74 percent have reported higher revenues than analysts anticipated.
But the stock market has been focused on rising interest rates during this reporting period and has been very subdued in its reception of the interim corporate reports. Over the past five years, the average S&P500 stock has risen 0.8 percent on a positive earnings surprise. But this past quarter, the price reaction is minus 0.1 percent on average, according to FactSet Earnings Insight.
Is Microsoft cheap yet?
As earlier mentioned, the last time we saw rates at this height in the US was during 2018. In 2018, Microsoft shares traded at an average Price/Earnings (P/E) ratio next twelve months (NTM) of 24.8x. Currently, Microsoft is trading at a P/E ratio NTM of 26.9x. That could imply that there is further downside to the valuation of Microsoft, all else equal. See the chart below:
Microsoft P/E ratio NTM (in x), Microsoft average P/E NTM 2018 (in x) and US 10 year yield (in %), December 30 2016 to May 6 2022
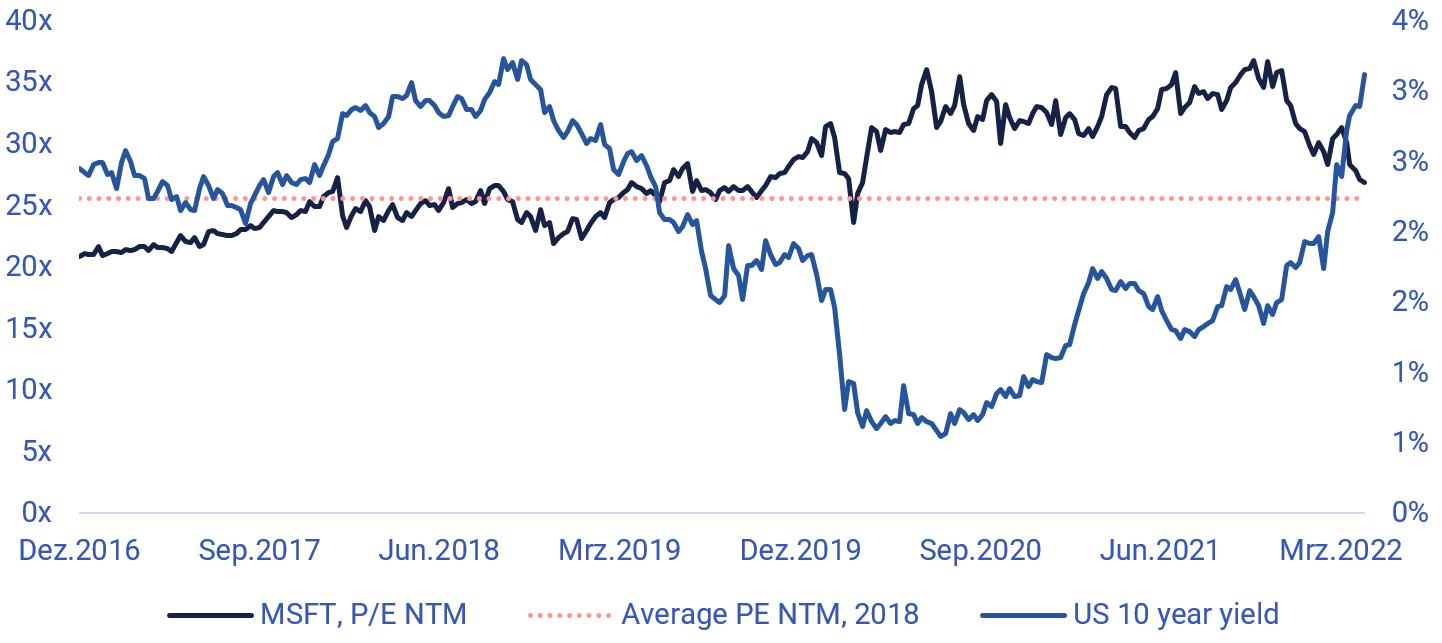
Source: Infront and Carlsquare. Note: Past performance is not a reliable indicator of future results.
Nevertheless, Microsoft sees strong demand, and its cloud business is driving growth. The fundamentals do seem in place. When the P/E ratio starts to approach 20-25x, one may say that Microsoft is beginning to look cheap, all else equal.
Microsoft share price (in USD), one year chart
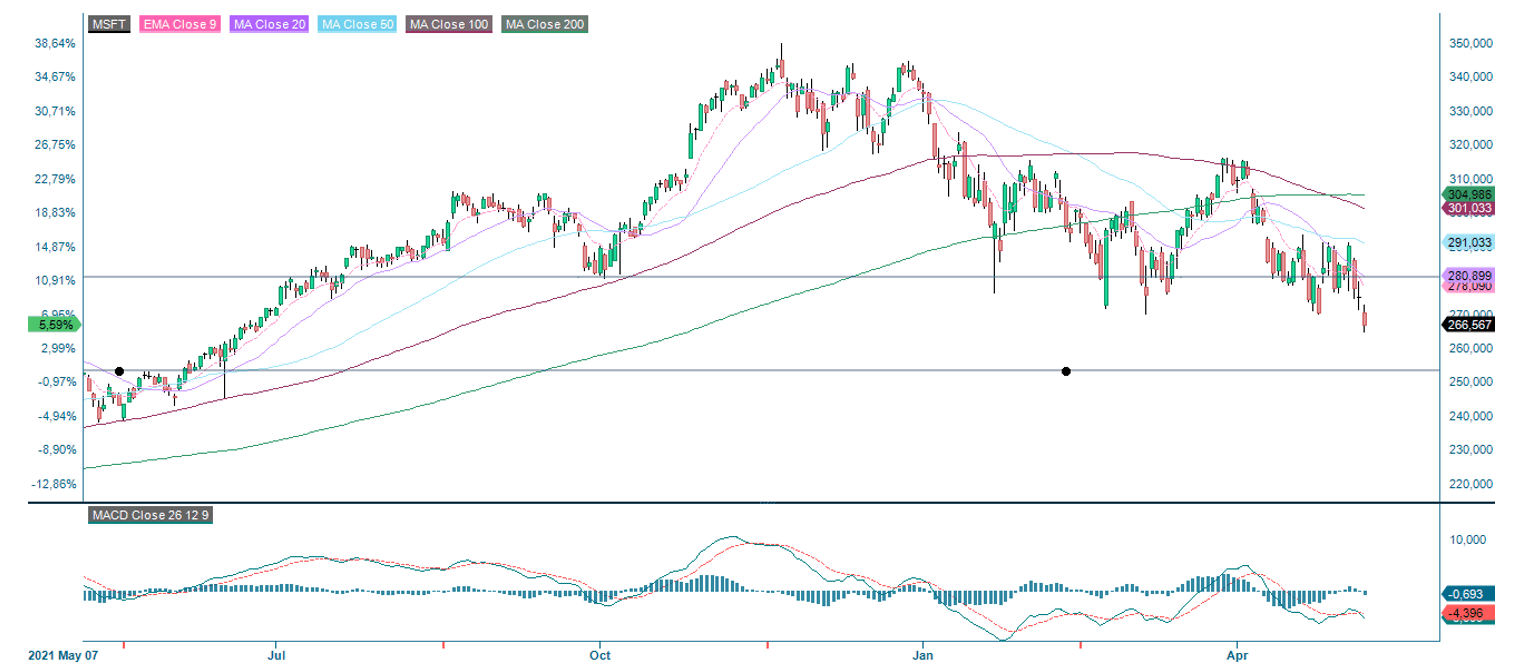
Source: Infront and Carlsquare. Note: Past performance is not a reliable indicator of future results.
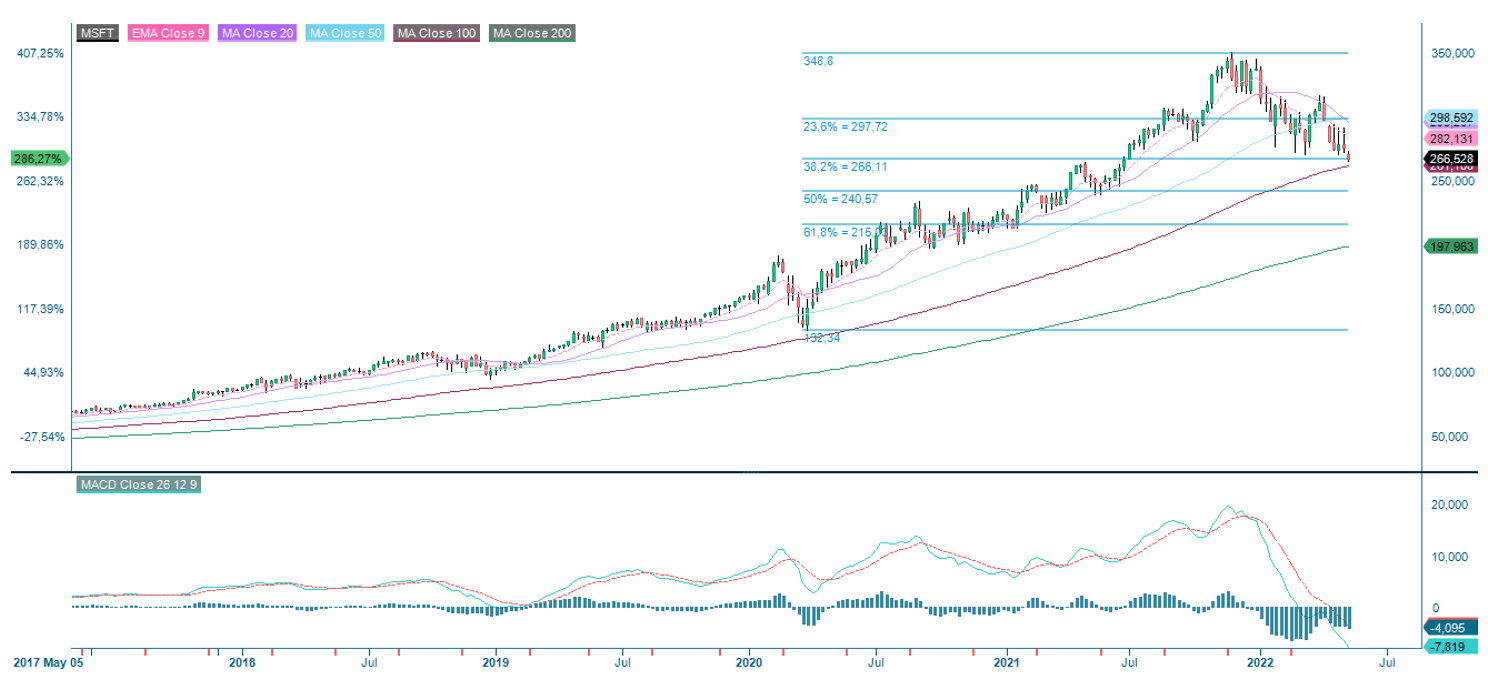
Microsoft share price (in USD), five-year price chart
Risiko
Ekstern forfatter:
Denne informasjonen er utelukkende på gjesteforfatterens ansvar og representerer ikke nødvendigvis oppfatningen til Bank Vontobel Europe AG eller noe annet selskap i Vontobel Group. Den videre utviklingen av indeksen eller et selskap samt aksjekursen avhenger av en lang rekke selskaps-, gruppe- og sektorspesifikke samt økonomiske faktorer. Hver investor må ta hensyn til risikoen for kurstap i investeringsbeslutningen. Vær oppmerksom på at investering i disse produktene ikke vil generere løpende inntekter.
Produktene er ikke kapitalbeskyttet, i verste fall er et totalt tap av investert kapital mulig. Ved insolvens av utstederen og garantisten, bærer investoren risikoen for totaltap av sin investering. I alle fall bør investorer merke seg at tidligere resultater og/eller analytikeres meninger ikke er en tilstrekkelig indikator på fremtidig ytelse. Ytelsen til de underliggende elementene avhenger av en rekke økonomiske, entreprenørielle og politiske faktorer som bør tas i betraktning i dannelsen av en markedsforventning.