VIX on low levels might go up on a weaker Q1 reporting season


The Ukraine war has taken on diminished importance from the perspective of the stock markets. Instead, the focus is shifting towards the upcoming Q1 2022 reporting season, where earnings estimate for the S&P500 companies is coming down. Investors are also watching interest rate developments, with U.S. two- and 10-year yields inverting last week.
On Wednesday, March 30, statistics showed that annual inflation in the Eurozone rose from 5.9 percent as of February 28, 2022, to 7.5 percent on March 30, 2022. The outcome was almost one percentage point higher than anticipated. Energy remains the primary driver of inflation.
Meanwhile, U.S. short-term interest rates have now passed ten-year interest rates. It could indicate an expected economic slow-down within a year. But it could also mean that investors no longer believe that the Fed will be able to fulfill all its rate hike announcements.
Weekly Comparison between the U.S. 5-year and 10-year yields, Week 52/2021 to Week 13/2022
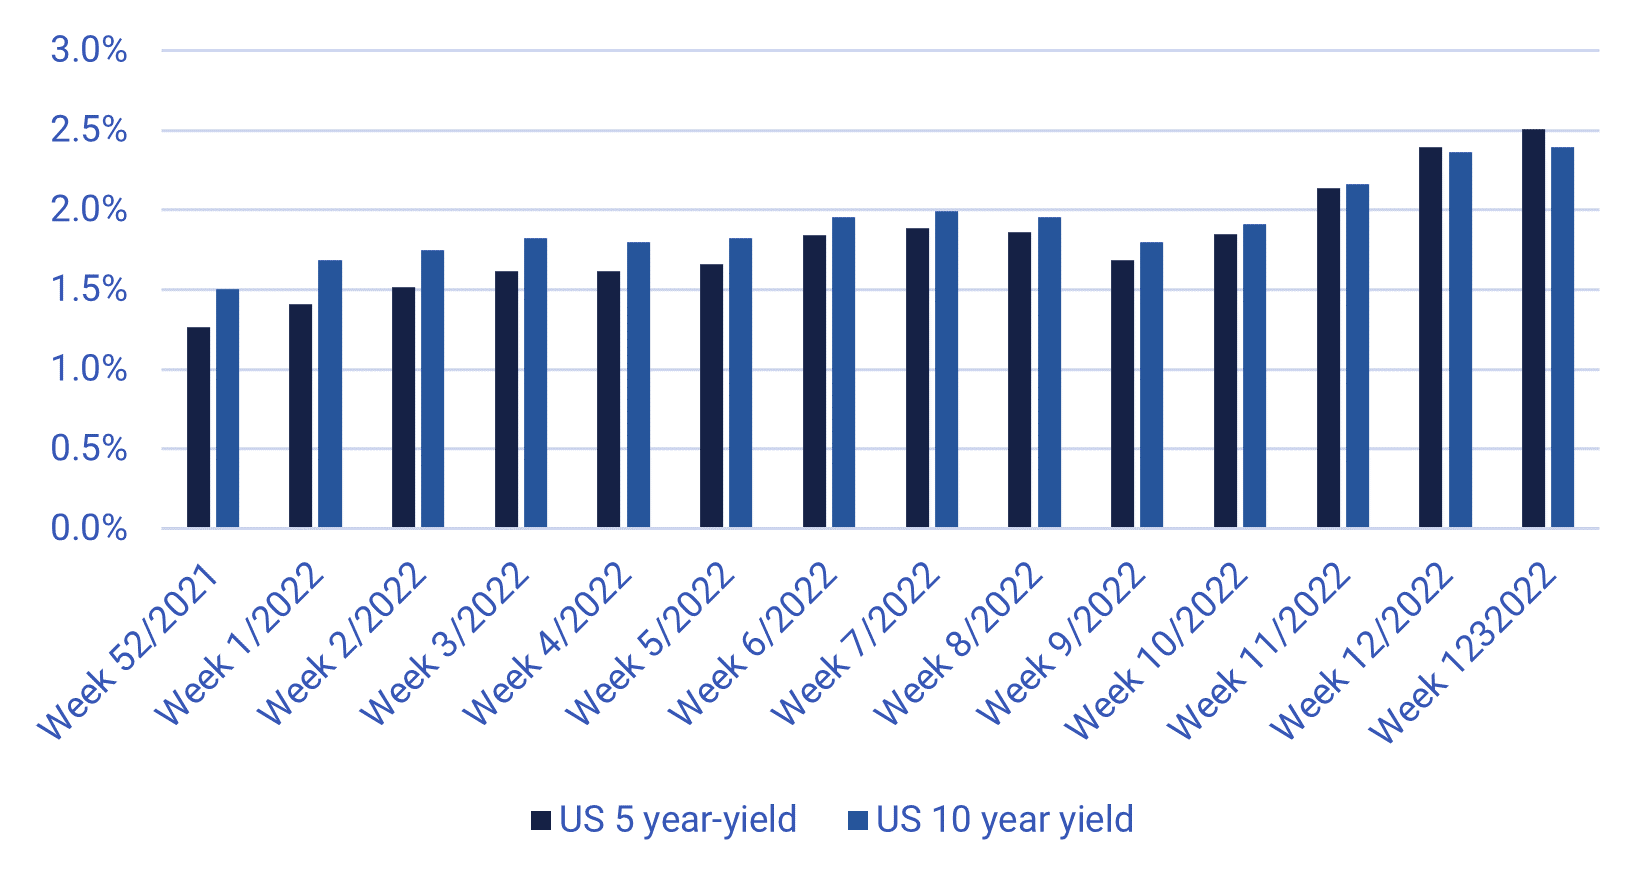
Source: www.riksbank.se
Last week ended on Friday, April 1, with 426,000 new jobs created in the U.S. during March. Although this was below the analyst's forecast of 480,000 new jobs, it is still a decisive outcome. It illustrates that the U.S. economy is still running at a good pace.
Number of 1,000 new jobs in the U.S. April 2021-Mar 2022 – Outcome and Forecast
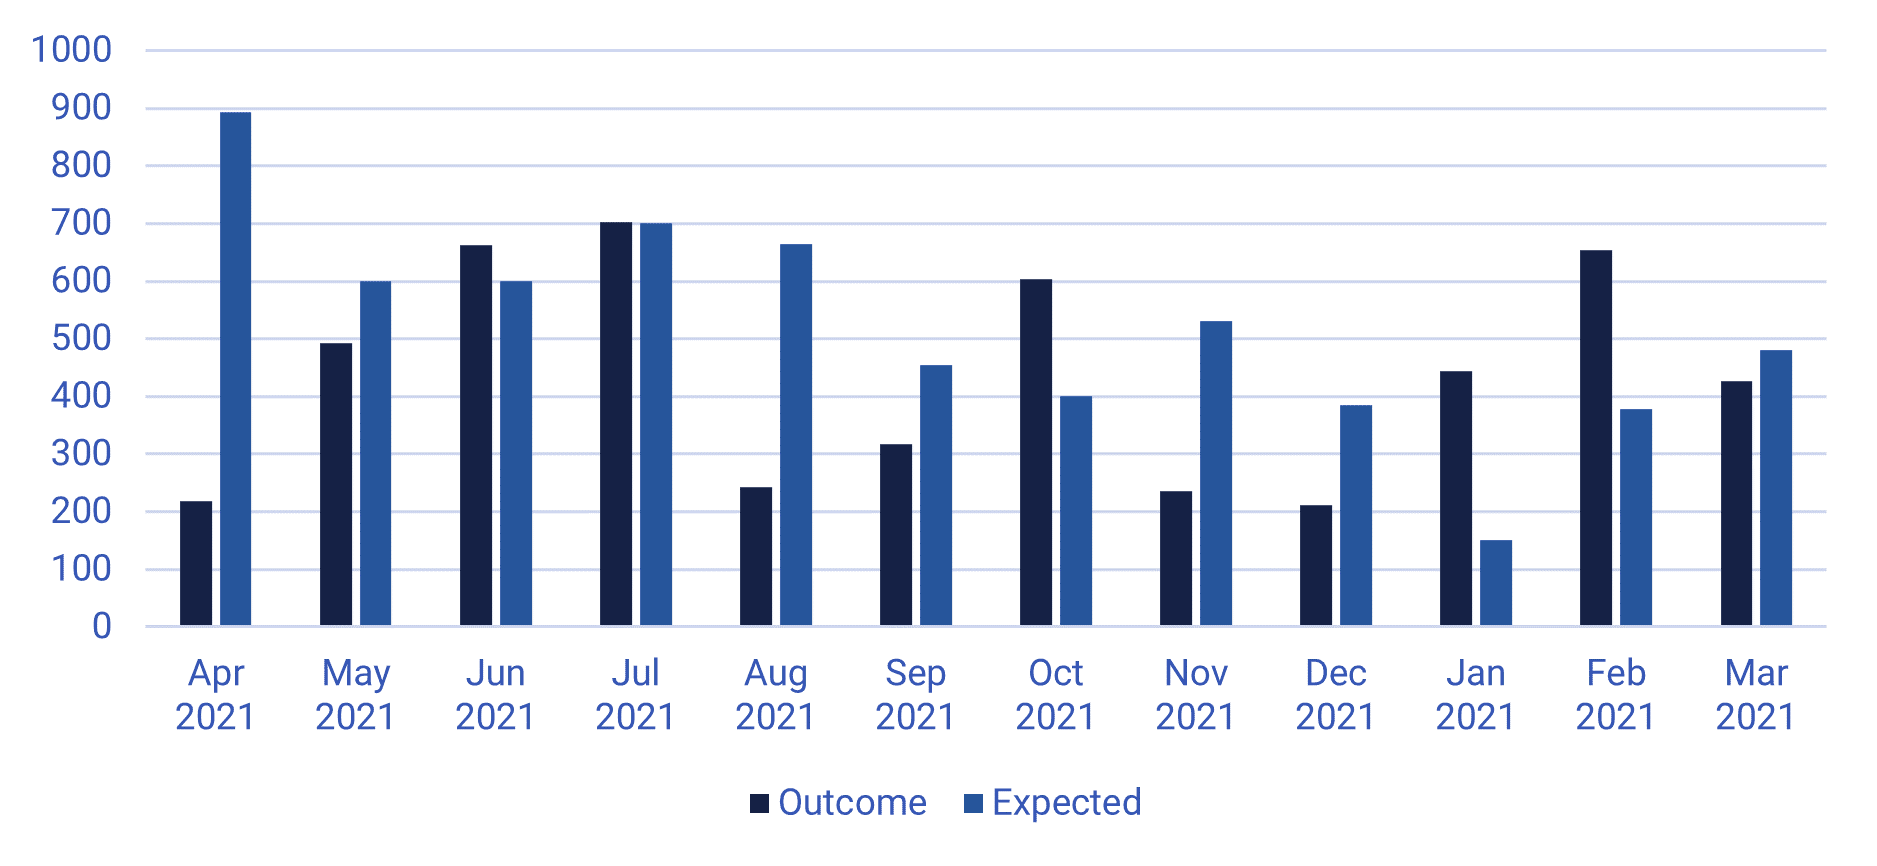
Source: www.investing.com
We saw reasonably limited price movements on the world's stock markets last week. The Shanghai stock exchange was the relative best performer, with the index up about 3%. The worst performer so far this year of the index in the chart below is the OMX30, down 11.7% in 2022. So far this year, the London Stock Exchange (FTSE) has been the best performer. Investors prefer it since the FTSE index has a high proportion of food and pharmaceutical companies with lower cyclical exposure.
Meanwhile, some anecdotal stories suggest that industrial companies in Europe already face a challenging environment. These range from supply disruptions to skyrocketing input and component prices. The latter is also easily linked to the weak performance of the OMX30 index with its many major industrial companies.
Significant stock indices performance on Monday, April 4, 2022, in one week and this year
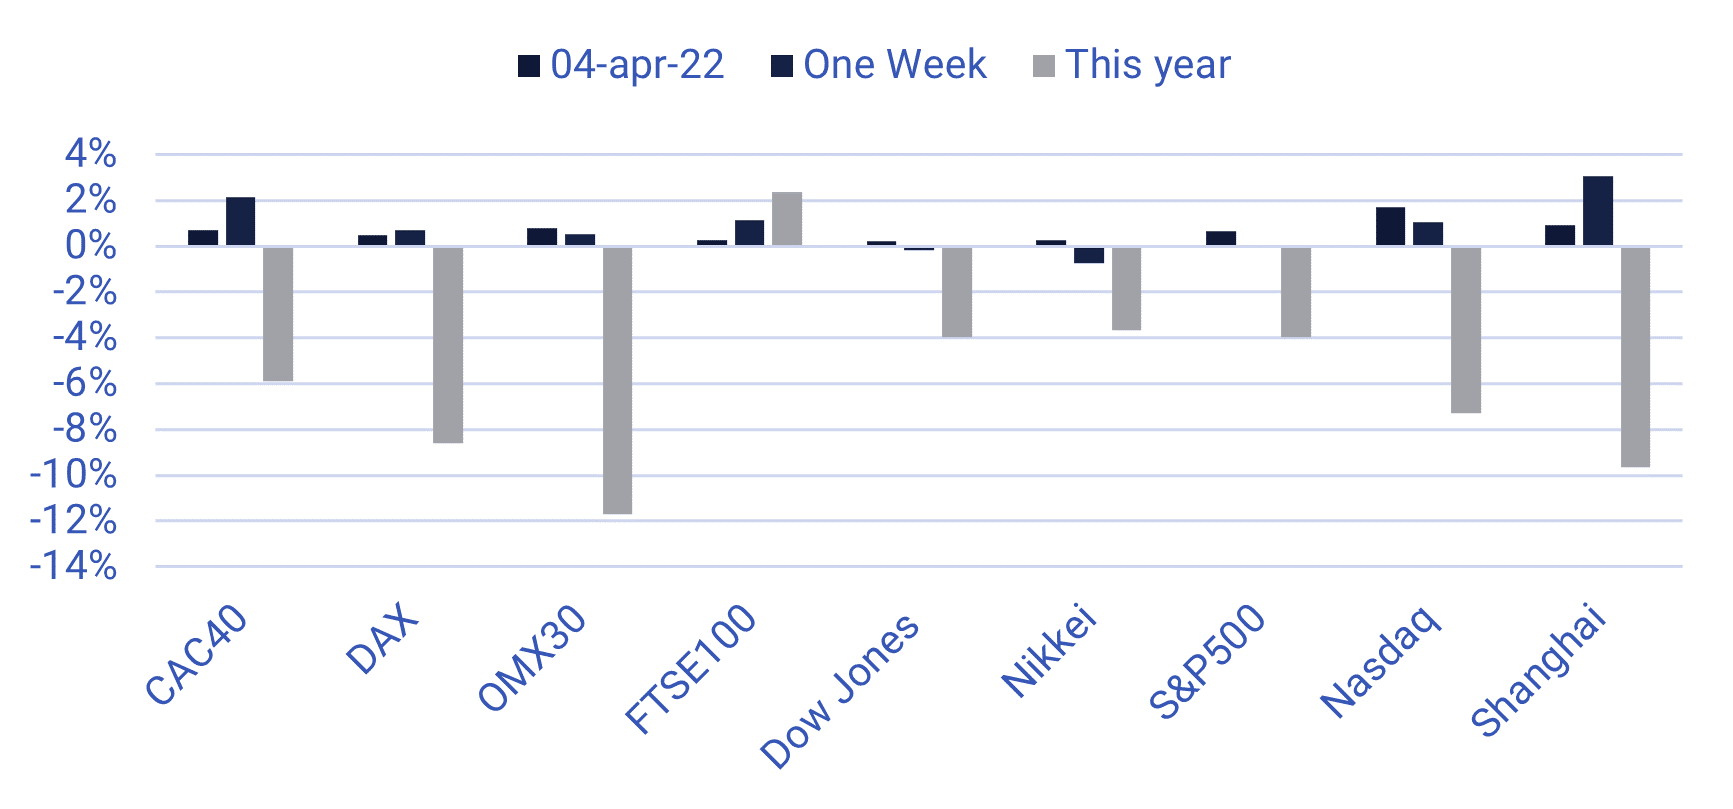
Source: www.di.se, www.cnbc.com
Worse Q1 report outcome could lift the VIX
As we wrote a few weeks ago, the war in Ukraine has now begun to be encapsulated by the stock market.
The company reports for Q1 2022, which will start to arrive in a wide range in just about two weeks, will now likely capture investor interest. Wall Street analysts have revised the forecast earnings growth in Q1 2022 from 5.7 to 4.7 percent since the beginning of the year. That would make it the quarter with the lowest earnings growth since Q4 2020.
According to the expectations, engineering and consumer discretionary companies should reduce their profits by 11% in Q1 2022. The weak and uncertain outlook for the companies in the industrial sector mentioned earlier is the same in the United States as in Europe. However, the sanctions' effects on Russia are more visible in Europe.
The VIX index measures expected volatility in the month ahead. VIX has come down from highs of around 38 just under a month ago to 19.2 at writing. The likelihood of a VIX break to the upside, i.e., a slight increase in expectations of rising volatility, may be considered more significant than a further fallback.
S&P500 Volatiliity (in USD) from October 1, 2021, to April 4, 2022
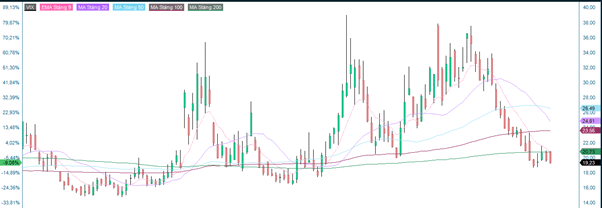
Source: Infront and Carlsquare. Note: Past performance is not a reliable indicator of future results.
Relaterte produkter
The VIX is also at low levels in a longer, five-year perspective. It does not seem entirely justified given the ongoing war between two of Europe's major countries, while the earnings outlook for the U.S. stock market's companies is revised downwards.
S&P500 Volatility (in USD) five-year chart
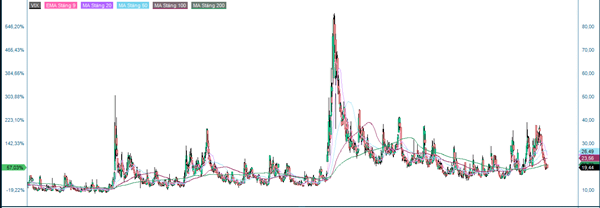
Source: Infront and Carlsquare. Note: Past performance is not a reliable indicator of future results.
The full name for abbreviations used in the previous text:
EMA 9: 9-day exponential moving average
Fibonacci: There are several Fibonacci lines used in technical analysis. Fibonacci numbers are a sequence of numbers in which each successive number is the sum of the two previous numbers.
MA20: 20-day moving average
MA50: 50-day moving average
MA100: 100-day moving average
MA200: 200-day moving average
MACD: Moving average convergence divergence
Risiko
Ekstern forfatter:
Denne informasjonen er utelukkende på gjesteforfatterens ansvar og representerer ikke nødvendigvis oppfatningen til Bank Vontobel Europe AG eller noe annet selskap i Vontobel Group. Den videre utviklingen av indeksen eller et selskap samt aksjekursen avhenger av en lang rekke selskaps-, gruppe- og sektorspesifikke samt økonomiske faktorer. Hver investor må ta hensyn til risikoen for kurstap i investeringsbeslutningen. Vær oppmerksom på at investering i disse produktene ikke vil generere løpende inntekter.
Produktene er ikke kapitalbeskyttet, i verste fall er et totalt tap av investert kapital mulig. Ved insolvens av utstederen og garantisten, bærer investoren risikoen for totaltap av sin investering. I alle fall bør investorer merke seg at tidligere resultater og/eller analytikeres meninger ikke er en tilstrekkelig indikator på fremtidig ytelse. Ytelsen til de underliggende elementene avhenger av en rekke økonomiske, entreprenørielle og politiske faktorer som bør tas i betraktning i dannelsen av en markedsforventning.
Disclaimer:
Denne informasjonen er verken et investeringsråd eller en investerings- eller investeringsstrategianbefaling, men en annonse. Den fullstendige informasjonen om handelsproduktene (verdipapirene) nevnt her, spesielt strukturen og risikoene knyttet til en investering, er beskrevet i basisprospektet, sammen med eventuelle tillegg, samt de endelige vilkårene. Grunnprospektet og de endelige vilkårene utgjør de eneste bindende salgsdokumentene for verdipapirene og er tilgjengelige under produktlenkene. Det anbefales at potensielle investorer leser disse dokumentene før de tar noen investeringsbeslutning. Dokumentene og nøkkelinformasjonsdokumentet er publisert på nettsiden til utstederen, Vontobel Financial Products GmbH, Bockenheimer Landstrasse 24, 60323 Frankfurt am Main, Tyskland, på prospectus.vontobel.com og er gratis tilgjengelig fra utstederen. Godkjenningen av prospektet skal ikke forstås som en godkjenning av verdipapirene. Verdipapirene er produkter som ikke er enkle og kan være vanskelige å forstå. Denne informasjonen inkluderer eller er relatert til tall for tidligere resultater. Tidligere resultater er ikke en pålitelig indikator på fremtidig ytelse.