Epävarmuus tulleista jatkuu


Presidentti Trumpin määräämien tullien kumoaminen Yhdysvaltain korkeimmassa oikeudessa ja Trumpin heti perään asettamat uudet ja entistä korkeammat tullit ovat aiheuttaneet jatkuvaa epävarmuutta sekä yrityksille että osakemarkkinoille. Japanin Nikkei-indeksi on puolestaan kehittynyt vahvasti viimeisten kuuden kuukauden aikana. Kun otetaan huomioon hallitsevan liberaalidemokraattisen puolueen voitto helmikuun parlamenttivaaleissa ja se, että Japanin tärkeimmät vientikumppanit Aasiassa hyötyivät viimeisimmästä tullipäätöksestä, odotamme Japanin jenin vahvistuvan suhteessa Yhdysvaltain dollariin.
Viikon tapaus: Aurinko nousee idästä
Perjantaina 20. helmikuuta Yhdysvaltain korkein oikeus mitätöi presidentti Trumpin huhtikuusta 2025 alkaen muille maille asettamat tullit. Päätös perustui siihen, että tullit ovat perustuslain vastaisia, koska ne määrättiin presidentin asetuksella ilman kongressin hyväksyntää. Korkeimman oikeuden päätöksen myötä suurimpia voittajia tullien ja kaupan osalta ovat Kiina, Intia ja Brasilia ovat, sillä Yhdysvallat oli aiemmin asettanut näille maille korkeampia tulleja.
Trumpin huhtikuun 2025 jälkeen tekemät arvaamattomat muutokset tullipäätöksiin ovat saaneet maailmanlaajuiset sijoittajat vähentämään altistumistaan Yhdysvalloille ja Yhdysvaltain dollarille. Tilanne on johtanut myös siihen, että Euroopan unioni on tehnyt kauppasopimuksen Intian kanssa. Vuonna 2026 Intia on maailman neljänneksi suurin talous.
Alla olevasta tärkeimpien osakeindeksien kurssikaaviosta käy ilmi, että Japanin Nikkei-indeksi on kehittynyt hyvin, kun taas Yhdysvaltain osakeindeksit – Russell 2000 -indeksiä lukuun ottamatta – ovat kehittyneet heikommin kuin Dow Jones World -indeksi. Nikkei nousi huimasti sen jälkeen, kun Sanae Takaichin johtama liberaalidemokraattinen puolue (LDP) saavutti murskavoiton Japanin parlamenttivaaleissa 8. helmikuuta 2026. Vuonna 1955 perustettu LDP on alusta lähtien hallinnut Japania lähes yhtäjaksoisesti ja lisännyt paikkamääräänsä vaaleja edeltäneestä 41 %:sta 68 %:iin.
Maailmanlaajuisten osakeindeksien kehitys tähän mennessä kuluvana vuonna (YTD), kuuden kuukauden aikana ja viiden vuoden aikana, järjestettynä kuuden kuukauden tuoton mukaan

Japanin teollisuussektoria on historiallisesti leimannut merkittävä vientiylijäämä, vaikka sen merkitys onkin viime vuosina vähentynyt. Japanin taloudella on useita haasteita, kuten väestön ikääntyminen ja huomattava julkinen velka. Japanin tärkeimmät vientikohteet ovat Kiina (noin 23 % kokonaisviennistä), Yhdysvallat (noin 18 %), Kaakkois-Aasian ASEAN-maat (noin 14 %), EU (noin 9 %), Taiwan (noin 7 %) ja Etelä-Korea (noin 6 %). Yli puolet Japanin viennistä suuntautuukin Aasiaan, mikä on suotuisa suuntaus nykyisessä taloustilanteessa. Heikko dollari (dollari on laskenut 11 % suhteessa euroon viime vuoden aikana) on ollut historiallisesti myönteinen tekijä kehittyvien maiden talouskasvulle.
Japanin jeni on ollut viime vuosina heikko erityisesti Yhdysvaltain dollariin nähden. Tammikuun 2026 puolivälistä lähtien jeni on kuitenkin vahvistunut hieman suhteessa dollariin. Koska pääoma- ja kauppavirtojen odotetaan suosivan Japania aiempaa enemmän, uskomme, että jenillä on hyvät edellytykset vahvistua suhteessa dollariin.
USD/JPY, yhden vuoden päiväkaavio

USD/JPY, viiden vuoden viikkokaavio

Makrokommentit
On yhä todennäköisempää, että Yhdysvallat on hyökkäämässä Irania vastaan. Arviolta 40–50 % Yhdysvaltain ilmavoimien maailmanlaajuisesta iskukyvystä on parhaillaan keskitettynä Lähi-itään. Yhdysvallat on alkanut evakuoida Yhdysvaltain kansalaisia sotilastukikohdistaan Bahrainissa ja Qatarissa, jotka sijaitsevat lähellä Irania. Brent-raakaöljyn hinta nousi viime viikolla noin 4 dollaria barrelilta. Noin 25 % maailman öljytoimituksista kulkee tällä hetkellä Hormuzinsalmen kautta, ja Yhdysvaltain hyökätessä Iran voisi sulkea salmen.
Brent-raakaöljy (USD/barreli), viiden vuoden kuukausikaavio

Reports
Bayer, HSBC ja Nvidia julkaisevat osavuosikatsauksensa keskiviikkona 25. helmikuuta. Makrotalouden osalta julkaistaan Ruotsin tammikuun tuottajahintaindeksi. Sen jälkeen julkistetaan Saksan maaliskuun kuluttajaluottamusindeksi ja Saksan viimeisen vuosineljänneksen BKT. Ranska julkaisee kotitalouksien luottamusindeksin helmikuulta. Lisäksi euroalueelta saadaan tammikuun kuluttajahintaindeksi. Yhdysvalloista saadaan energiaministeriön viikoittaiset tilastot öljyvarastoista. Lisäksi presidentti Trump pitää puheensa kansakunnan tilasta.
Torstaina 26. lokakuuta osavuosikatsauksensa julkaisevat muun muassa yhdysvaltalaiset Dell Technologies ja Intuit. Torstain makrouutiset alkavat helmikuun suhdannebarometreilla Ruotsista ja Saksasta. Yhdysvalloista saamme viikoittaiset tilastot uusista työttömyyshakemuksista sekä Kansas Cityn Fed -indeksin.
International Airlines Group (IAG) julkaisee osavuosikatsauksensa perjantaina 27. helmikuuta. Makrotalouden osalta ensimmäisinä saadaan tiedot Japanin tammikuun teollisuustuotannosta ja vähittäismyynnistä. Niiden jälkeen julkaistaan Ruotsin tammikuun kauppatase ja viimeisen vuosineljänneksen BKT. Ranska, Saksa ja Espanja julkistavat helmikuun kuluttajahintaindeksilukunsa. Saamme myös Ranskan ja Intian viimeisen vuosineljänneksen BKT:n sekä Saksan helmikuun työttömyysluvut. Lisäksi odotetaan euroalueen kyselytutkimusta kotitalouksien inflaatio-odotuksista. Kanada julkistaa viimeisen vuosineljänneksen BKT:n, Yhdysvallat tammikuun tuottajahintaindeksin, Chicagon ostopäällikköindeksin helmikuulta sekä joulukuun rakennusmenot.
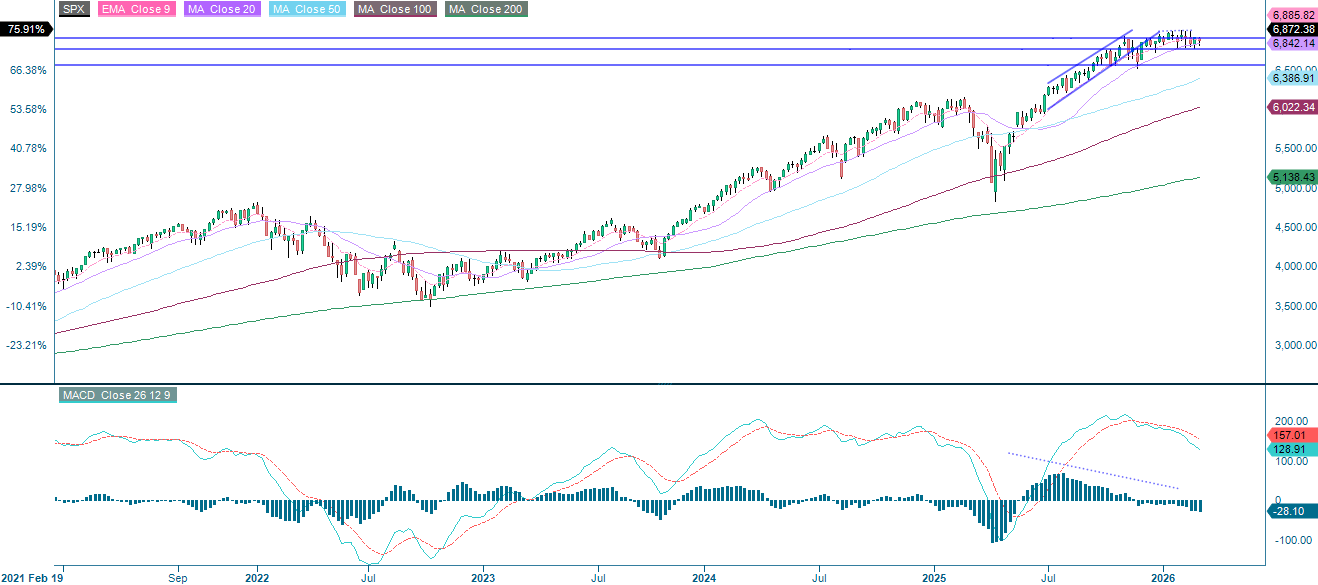
Pelotteleeko Nvidia karhut tiehensä?
Maanantaina S&P 500 -indeksissä näkyi voimakasta volatiliteettia, joka johtui tekoälyn aiheuttamiin häiriöihin ja tulliepävarmuuteen liittyvistä huolista ja päätyi jyrkkään laskuun. 100 päivän liukuvan keskiarvon tienoilla oleva tuki pitää kuitenkin edelleen. MACD-indikaattori osoittaa, että trendi on kallistunut alaspäin – momentum on negatiivinen ja laskeva. RSI on sen sijaan neutraalilla alueella. Seuraava tukitaso on noin 6 700 pisteessä, ja sitä seuraa MA200 6 542 pisteessä. On kuitenkin tärkeää seurata Nvidian viimeisen vuosineljänneksen raporttia, joka julkistetaan Yhdysvaltain pörssin sulkeuduttua keskiviikkona, sillä se voi muuttaa lyhyen aikavälin näkymiä.
Liittyvät tuotteet
S&P 500 (USD), yhden vuoden päiväkaavio

S&P 500 (USD), viiden vuoden viikkokaavio
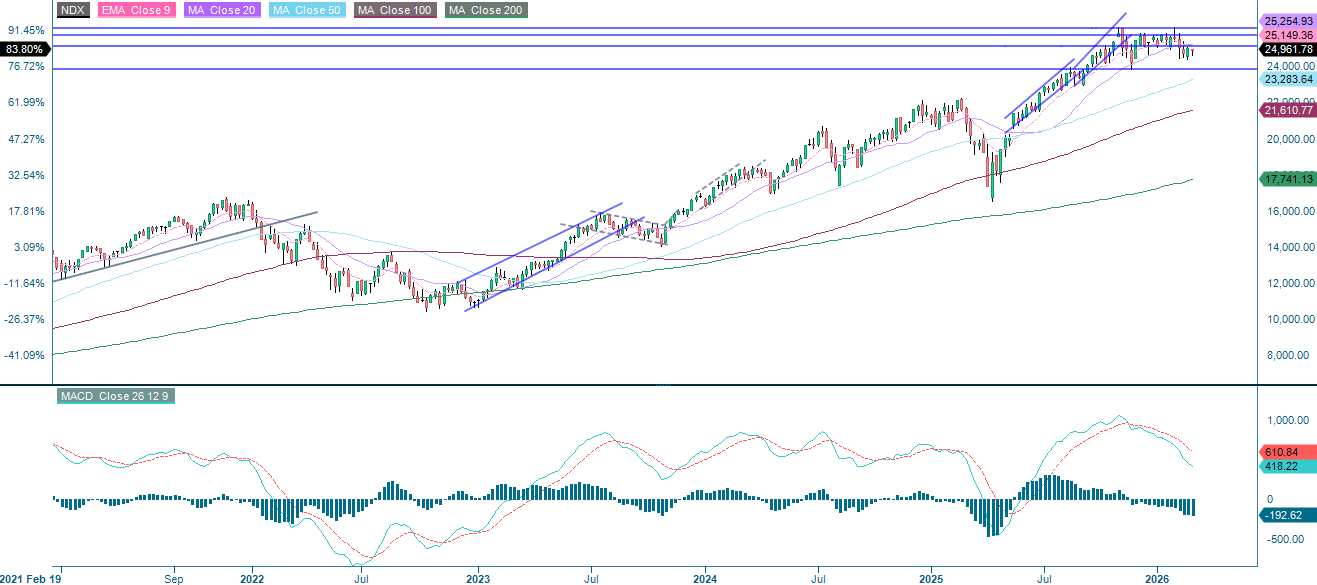
Tekoälyn aiheuttamaan disruptioon liittyvä narratiivi on edelleen erittäin ajankohtainen. NASDAQ-100 pysyy toistaiseksi 24 500 pisteen tukitason yläpuolella. Jos indeksi painuu tämän tason alapuolelle, 24 035 pisteessä olevasta MA200:sta tulee seuraava ilmeinen kohde. Kuten aiemmin mainittiin, Nvidia on ratkaisevan tärkeä yhtiö, jota kannattaa seurata.
Liittyvät tuotteet
NASDAQ-100 (USD), yhden vuoden päiväkaavio

NASDAQ-100 (USD), viiden vuoden viikkokaavio
Samaan aikaan OMXS30 kiitää uusilla ennätystasoilla, mikä johtuu laajoista teollisuusostoista ja Saabin vahvasta kysynnästä Euroopan puolustusalan arvostuksen noustua uudelle tasolle. Tällä hetkellä mikään ei näytä katkaisevan trendiä, vaikka Nvidian heikkous tai negatiiviset tulliotsikot voivatkin hillitä indeksin vauhtia.
OMX30 (SEK), yhden vuoden päiväkaavio

OMX30 (SEK), viiden vuoden viikkokaavio

DAX on palaamassa takaisin kohti MA20:ta, joka on ensimmäinen tukitaso. Euron jatkuva vahvistuminen voi tehdä 24 665 pisteestä tärkeän tason. Murtautuminen sen alapuolelle avaa tien kohti 24 370:n kohdalla olevaa MA100:aa, joka on seuraava kohde alapuolella.
Liittyvät tuotteet
DAX (EUR), yhden vuoden päiväkaavio

DAX (EUR), viiden vuoden viikkokaavio
Edellisessä tekstissä käytettyjen lyhenteiden koko nimi:
EMA 9: 9 päivän eksponentiaalinen liukuva keskiarvo
Fibonacci: Teknisessä analyysissä käytetään useita Fibonacci-linjoja. Fibonaccin luvut ovat sarja, jossa jokainen peräkkäinen luku on kahden edellisen luvun summa.
MA20: 20 päivän liukuva keskiarvo
MA50: 50 päivän liukuva keskiarvo
MA100: 100 päivän liukuva keskiarvo
MA200: 200 päivän liukuva keskiarvo
MACD: Liukuvan keskiarvon konvergenssidivergenssi
Riskit
Credit risk of the issuer:
Investors in the products are exposed to the risk that the Issuer or the Guarantor may not be able to meet its obligations under the products. A total loss of the invested capital is possible. The products are not subject to any deposit protection.
Currency risk:
If the product currency differs from the currency of the underlying asset, the value of a product will also depend on the exchange rate between the respective currencies. As a result, the value of a product can fluctuate significantly.
External author:
This information is in the sole responsibility of the guest author and does not necessarily represent the opinion of Bank Vontobel Europe AG or any other company of the Vontobel Group. The further development of the index or a company as well as its share price depends on a large number of company-, group- and sector-specific as well as economic factors. When forming his investment decision, each investor must take into account the risk of price losses. Please note that investing in these products will not generate ongoing income.
The products are not capital protected, in the worst case a total loss of the invested capital is possible. In the event of insolvency of the issuer and the guarantor, the investor bears the risk of a total loss of his investment. In any case, investors should note that past performance and / or analysts' opinions are no adequate indicator of future performance. The performance of the underlyings depends on a variety of economic, entrepreneurial and political factors that should be taken into account in the formation of a market expectation.
Market risk:
The value of the products can fall significantly below the purchase price due to changes in market factors, especially if the value of the underlying asset falls. The products are not capital-protected
Product costs:
Product and possible financing costs reduce the value of the products.
Risk with leverage products:
Due to the leverage effect, there is an increased risk of loss (risk of total loss) with leverage products, e.g. Bull & Bear Certificates, Warrants and Mini Futures.
Disclaimer:
This information is neither an investment advice nor an investment or investment strategy recommendation, but advertisement. The complete information on the trading products (securities) mentioned herein, in particular the structure and risks associated with an investment, are described in the base prospectus, together with any supplements, as well as the final terms. The base prospectus and final terms constitute the solely binding sales documents for the securities and are available under the product links. It is recommended that potential investors read these documents before making any investment decision. The documents and the key information document are published on the website of the issuer, Vontobel Financial Products GmbH, Bockenheimer Landstrasse 24, 60323 Frankfurt am Main, Germany, on prospectus.vontobel.com and are available from the issuer free of charge. The approval of the prospectus should not be understood as an endorsement of the securities. The securities are products that are not simple and may be difficult to understand. This information includes or relates to figures of past performance. Past performance is not a reliable indicator of future performance.
© Bank Vontobel Europe AG and/or its affiliates. All rights reserved.