Higher interest rates and Nvidia test the market


This week we examine Nvidia's strong share price performance ahead of the company's interim report later this evening. The OMX index has been showing strong momentum of late, which is hard to explain by fundamental factors other than a catch-up rally visavi US indices.
Case of the week: Rally in Nvidia shares faces imminent test
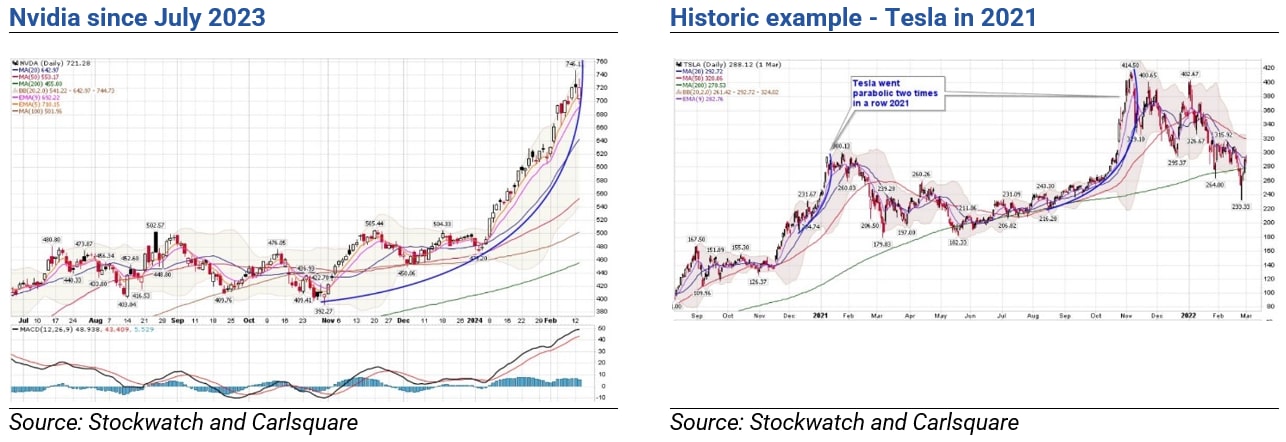
Expectations are high for Nvidia's Q4 2023 report later today (Wednesday 21 February). The company has seen impressive growth. However, the share chart gives some reasons to take a step back, reminding us of Tesla in 2021.
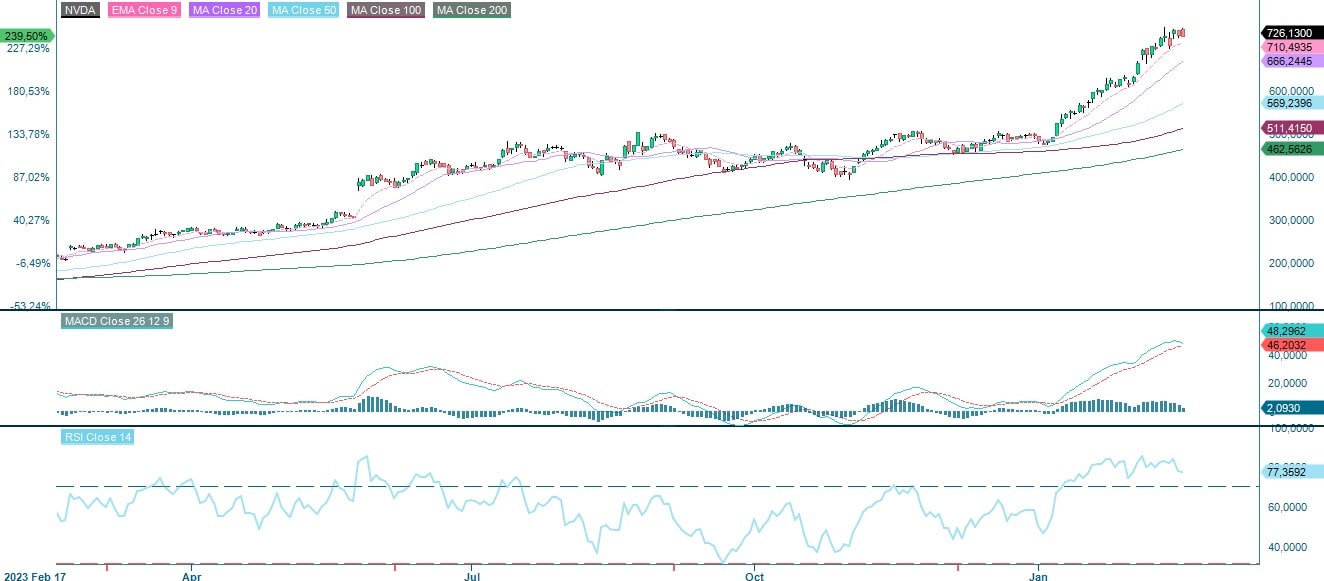
US Equity markets are close to all-time highs, with the S&P500 above 5,000. Arguably, the poster child for the strong performance in the US stock market is chipmaker Nvidia. Of all S&P500 stocks, Nvidia gained the most in 2023 (+239 %). The reason is extraordinarily strong growth due to its dominant position in, e.g. graphics data processing units (GPUs) used in data centres for AI applications.
The Q4 2023 earnings report on February 21 after the US market close will likely be another showcase of extremely high growth, with sales expected to more than triple to USD 20.5bn (5.9). While this kind of growth is hardly sustainable, Nivida has beaten analysts’ sales expectations by a wide margin in the last year.
At first glance, the valuation looks stretched at an EV/Sales multiple of some 19x (2025E). However, the gross margin is increasing on the back of higher pricing for newly introduced chips. In our view, the current earnings multiple of 35x (2025E) is not unreasonable given that expected growth in 2025 is above 50%.
As you can see in the chart below, Nvidia shares have also performed strongly in 2024, up an impressive 46% year to date. However, it appears the shares have now gone parabolic (see below). Typically, a blowout move forebodes a correction. Tesla in 2021 provided a cautionary tale. Tesla went parabolic twice back then when it was the market leader. Both times it ended with a huge setback. Note that the MA200 helped both times.
In a nutshell, even a better-than-expected report might fail to push Nvidia shares markedly higher. In the short-term, some investors might instead opt for profit-taking and “sell on the news”.
Nvidia (USD), one-year daily chart
Nvidia (USD), five-year weekly chart

Macro comments
As of Friday 9 February 2024, around 395 S&P500 companies have reported their fourth quarter results. 75% of S&P companies have reported a positive EPS surprise and 65% have reported a positive revenue surprise.
For the fourth quarter of 2023, earnings growth for S&P500 companies has risen to 3.2%, up from 2.9% a week ago and 1.6% two weeks ago.
For Q1 2024, 59 S&P500 companies have issued negative EPS guidance and 26 S&P500 companies have issued positive earnings guidance.
The top three S&P500 sectors in terms of EPS versus estimates are Information Technology, Energy and Industrials with 89%, 87% and 83%, respectively, beating estimates. Materials, Financials and Real Estate were the worst performers, with only 67%, 61% and 55% of Q4 2023 results beating expectations.
S&P500 actual and expected revenue and EPS growth Q4 2023-Q4 2024

The two-year US Treasury yield has risen by eleven basis points since 12th February to 4.55%. This was mainly due to higher than expected US inflation in January 2024 (3.3% vs. 3.1%).
Carlsquare has compiled the results, revenues and order intake compared to expectations for 86 OMX companies that have submitted their Q4 2023 reports since 18 January 2024. Only 51% of the Q4 results were better than expected, while 49% of the Q4 revenues were better than expected. Technically, however, the OMX has shown strength (see further in this article).
Today, Wednesday 21 February, we have interim reports from Nvidia, Analog Devices, Suncore and Synopsis. On Thursday the 22nd February, Bookings Holdings, EOG Resources and Intuit are due to report. We finish the week with Berkshire Hathaway's interim report on Friday 23rd February.
S&P 5,000
S&P 500 is currently trading close to the psychologically important 5,000 level. Based on positive but falling momentum, a trigger may be needed for the rally to continue. The first resistance on the downside is made up by MA20, currently at 4,950. In case of a break to the downside, 4,830 may be next
S&P 500 (in USD), one-year daily chart

S&P 500 (in USD), weekly five-year chart

Related Products
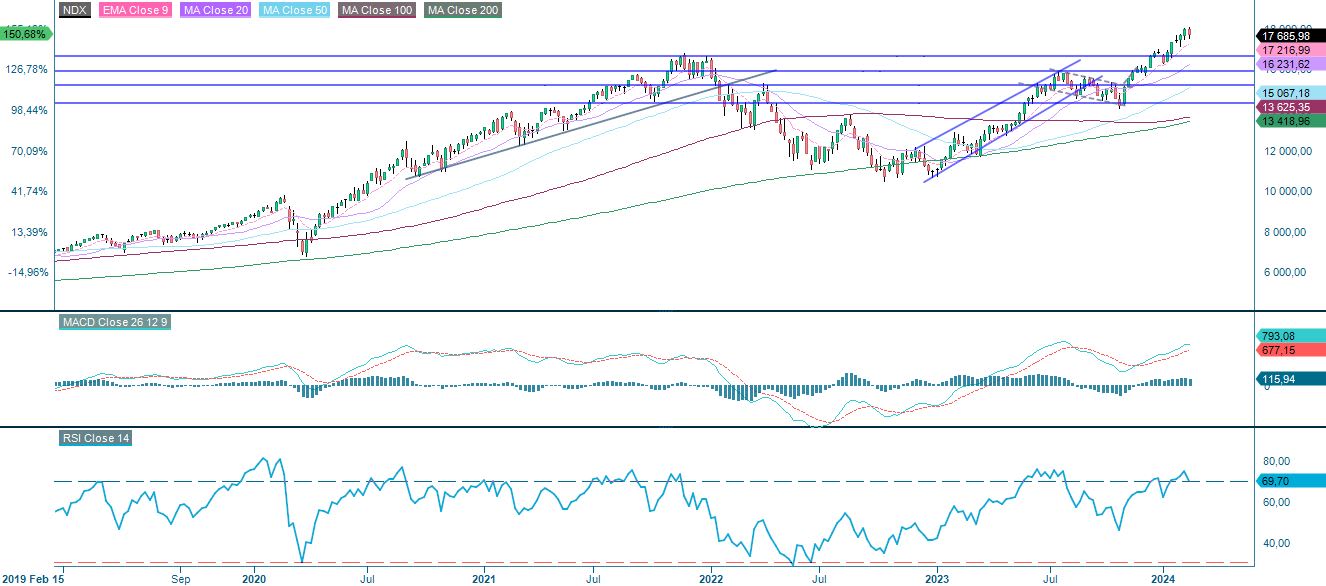
The Nasdaq 100 is approaching its MA20, currently at 17,593. A break below and levels between 17,000 to 17,140 could be next.
Nasdaq 100 (in USD), one-year daily chart

Nasdaq 100 (in USD), weekly five-year chart
It is an interesting setup in the Swedish OMXS30. This as momentum is recovering from slightly positive levels while the index is struck at resistance just above 2,400. A break above and OMXS30 may start to catch up on the US indices, as 2,500 may be next.
OMXS30 (in SEK), one-year daily chart

OMXS30 (in SEK), weekly five-year chart

Maybe OMXS30 can catch up on the German DAX as well that is currently consolidating in a narrow slightly upwards sloping trend.
DAX (in EUR), one-year daily chart

DAX (in EUR), weekly five-year chart

The full name for abbreviations used in the previous text:
EMA 9: 9-day exponential moving average
Fibonacci: There are several Fibonacci lines used in technical analysis. Fibonacci numbers are a sequence in which each successive number is the sum of the two previous numbers.
MA20: 20-day moving average
MA50: 50-day moving average
MA100: 100-day moving average
MA200: 200-day moving average
MACD: Moving average convergence divergence
Risks
External author:
This information is in the sole responsibility of the guest author and does not necessarily represent the opinion of Bank Vontobel Europe AG or any other company of the Vontobel Group. This information is sponsored by Bank Vontobel Europe AG, which may be a counterparty to transactions involving the financial instruments discussed in this information. The further development of the index or a company as well as its share price depends on a large number of company-, group- and sector-specific as well as economic factors. When forming his investment decision, each investor must take into account the risk of price losses. Please note that investing in these products will not generate ongoing income.
The products are not capital protected, in the worst case a total loss of the invested capital is possible. In the event of insolvency of the issuer and the guarantor, the investor bears the risk of a total loss of his investment. In any case, investors should note that past performance and / or analysts' opinions are no adequate indicator of future performance. The performance of the underlyings depends on a variety of economic, entrepreneurial and political factors that should be taken into account in the formation of a market expectation.
Credit risk of the issuer:
Investors in the products are exposed to the risk that the Issuer or the Guarantor may not be able to meet its obligations under the products. A total loss of the invested capital is possible. The products are not subject to any deposit protection.
Market risk:
The value of the products can fall significantly below the purchase price due to changes in market factors, especially if the value of the underlying asset falls. The products are not capital-protected
Risk with leverage products:
Due to the leverage effect, there is an increased risk of loss (risk of total loss) with leverage products, e.g. Bull & Bear Certificates, Warrants and Mini Futures.
Product costs:
Product and possible financing costs reduce the value of the products.
Currency risk:
If the product currency differs from the currency of the underlying asset, the value of a product will also depend on the exchange rate between the respective currencies. As a result, the value of a product can fluctuate significantly.