Do you have the right balance between stocks and precious metals?


Gold price is back above $1900/oz. You didn't get many chances to buy at a discount but if you were quick you could have bought as low as $1810/oz on Friday 6th October.
And about one week later, the price is $1916 (+6%). I think the swings are due to uncertainty about the Fed's rate decision. When investors fear that interest rates will be kept high for a long time, they sell gold, because bonds become relatively more attractive. But when the unrest in Israel looks set to escalate into a global holy war and the interest rate market signals faith in lower interest rates shortly, well then gold suddenly becomes much more interesting again. Incidentally, it is usually a good rule of thumb to sell your gold on particularly turbulent days.
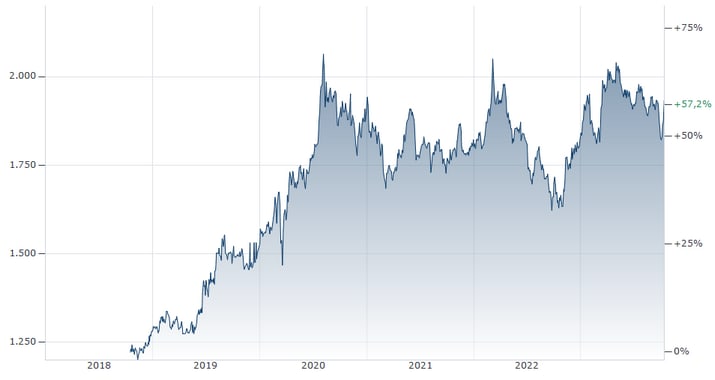
The gold price in USD since the first covid wave of 2020 seems stuck in a sideways movement with a floor of $1700 and a ceiling of $2050. In October, the price was approximately in the middle of the range and with a negative trend. Because despite a sideways or even negative price trend, it could simply be time for gold to set new price records. The last time was in August 2020, followed by an attempt in March 2022 and another time that touched the same level in May of this year (2023). In the three years since the all-time high in August 2020, the world has been hit by several waves of pandemics and huge QE programs (central banks that “print money”) as well as fiscal budget deficits. The amount of money, debt and the general price level have increased very sharply while the price of gold has stagnated. In dollars. In Swedish kronor, for example, on the other hand, the gold price has increased by 35% from the starting point of 500 kroner/gram in August 2020. In Argentina, the gold price has increased by 300% in the same period from 5.4 m/kg to 21.6 m/kg. The gold thus obviously has its supporters and a clear area of use as protection against claw-fingered politicians.
Gold price in USD/oz chart
Related Products
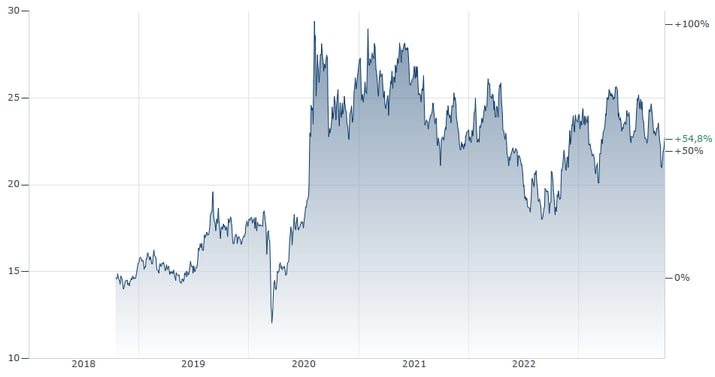
The silver price has developed quite similarly to gold. The price ratio is 85:1 today ($1921 / $22.6). It is a little higher than the barely 80:1 that has been the benchmark for a long time. It is an expression of reduced risk appetite among precious metal investors. When optimism is high, silver usually, after a period of silence, quickly catches up to gold's lead and much more than that. For example, based on the history of the two metals, I would not be surprised if the ratio falls towards 50:1 as interest rates are cut and the price of gold sets new records.
Silver price in USD/oz chart
Related Products
As a hypothetical calculation example, a gold price of USD 2500/oz (+30%) would then simultaneously correspond to a silver price of $50, i.e. just over +100%. Note that this is not a forecast or recommendation to speculate on that outcome. It is just my own scenario analysis for how it has happened several times in the past when the gold price has moved quickly. Take the year 2020 as an example. Silver first fell to $11.75 (and thus stands today 100% higher than that). As gold increased in price by 75% to a record high of $2080, silver rose by 150% to $30 an ounce. However, remember that past performance is not a reliable indicator of future results.
After all the severe shocks (pandemic, inflation, stock market movements, interest rate increases) and stimulus measures, the economy is more out of balance than normal. It increases the risk of setbacks. Of course, there is also some probability that the flow of capital between asset classes causes the stock market index to rise sharply rather than fall. But above all, it is about the economy not being as robust as before all the rapid changes. Just then, it can be smart to position differently from the rest of the market. Cash, bonds, gold and silver are an odd move that most stock investors don't even consider as options.
Related Products
As usual, it is not about replacing the entire portfolio with gold alone, but about thinking in terms of an asset portfolio with, for example, four different pieces. It can be shares, gold, other commodities and trend follower funds (CTAs). Above all, you should bear in mind that you can never know which asset class will do well in the coming year, but if you have four completely different investments, you can sell some of what has done particularly well and buy more of what has lagged behind. However, it is important to be disciplined in such a reweighting strategy. Often, for example, stocks do well for many years in a row and then one would prefer to avoid weighting down stocks every year, so the implementation must be nuanced.
Having said that, in my eyes there could be an unusually good exchange ratio between shares and gold or silver this autumn. The reward is likely to come when a weaker-than-expected economy forces the central banks to pivot towards lower interest rates and more QE. Then you could see a share price crash at the same time as a gold price rush. So you have to be prepared to exchange your expensive gold for even more cheap shares, perhaps a few years later, if the relative price development has gone as desired.
Risks
Disclaimer:
This information is neither an investment advice nor an investment or investment strategy recommendation, but advertisement. The complete information on the products (securities) mentioned herein, in particular the structure and risks associated with an investment, are described in the base prospectus, together with any supplements, as well as the final terms relating to the securities. The base prospectus and final terms constitute the solely binding sales documents for the products mentioned herein. It is recommended that potential investors read these documents before making any investment decision. The documents and the key information document are published on the website of the issuer, Vontobel Financial Products GmbH, Bockenheimer Landstrasse 24, 60323 Frankfurt am Main, Germany, on https://prospectus.vontobel.com and are available from the issuer free of charge. The approval of the prospectus should not be understood as an endorsement of the securities. The securities are products that are not simple and may be difficult to understand. This information includes or relates to figures of past performance. Past performance is not a reliable indicator of future performance. This information may only be distributed or published in countries where such distribution or publication is permitted by applicable law. As stated in the relevant base prospectus, the distribution of the securities mentioned in this information is subject to restrictions in certain jurisdictions. This advertisement may not be reproduced or redistributed without prior permission by Vontobel.
© Bank Vontobel Europe AG and / or affiliated companies. All rights reserved.
External author:
This information is in the sole responsibility of the guest author and does not necessarily represent the opinion of Bank Vontobel Europe AG or any other company of the Vontobel Group. This information is sponsored by Bank Vontobel Europe AG, which may be a counterparty to transactions involving the financial instruments discussed in this information. The further development of the index or a company as well as its share price depends on a large number of company-, group- and sector-specific as well as economic factors. When forming his investment decision, each investor must take into account the risk of price losses. Please note that investing in these products will not generate ongoing income.
The products are not capital protected, in the worst case a total loss of the invested capital is possible. In the event of insolvency of the issuer and the guarantor, the investor bears the risk of a total loss of his investment. In any case, investors should note that past performance and / or analysts' opinions are no adequate indicator of future performance. The performance of the underlyings depends on a variety of economic, entrepreneurial and political factors that should be taken into account in the formation of a market expectation.