Lower US interest rates provide soft buy signals


This week we focus on the potential for a rise in the price of platinum linked to increased demand from the automotive industry. The war between Israel and Hamas has led to increased market risk awareness, but also lower interest rates in the US. Technically, soft buy signals have emerged on most indices.
Case of the week: Platinum, a bright light in the fall darkness
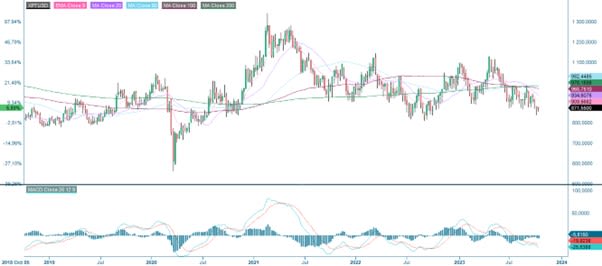
The platinum price has fallen by around 20% so far in 2023. However, there is pent-up demand for platinum due to a shift from palladium in automotive catalytic converters, giving the platinum price upside potential from current low levels.
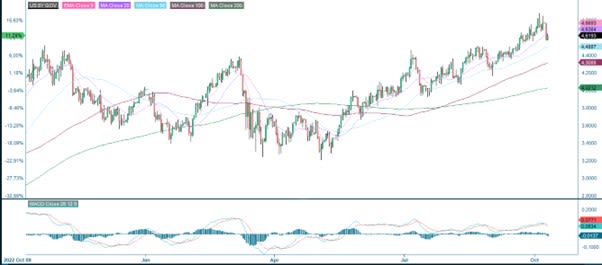
Since the beginning of 2023, the platinum price has experienced a notable decline, dropping from around 1,100 USD/ounce at the beginning of the year to approximately 870 USD/ounce as of October 9, 2023.
The primary demand for platinum is found in the automotive sector accounting for some 31 to 46% of total platinum demand in recent years. Platinum's usage in various industrial applications places it as the second-largest demand sector, making up nearly 26-36% of the total demand in recent years. Additionally, annual jewelry demand has consistently been around 23-30% of the total demand, with investment demand ranging between 10 and 20% over several years.
In 2022, the mined platinum supply was only 5 million ounces. The supply deficit has continued through 2023 following low production levels from primary producer South-Africa. According to a recent report by the Worl Platinum Investment Council (WPIC), the demand for platinum in the automotive sector in current year is projected to reach its highest levels since 2017, leading to a platinum deficit of over one million ounces (which is one-fifth of its total mined supply in 2022) for 2023. In the automotive sector, palladium and platinum serve as catalytic converters, Hence, platinum can serve as an alternative to palladium in numerous applications within the sector. Given the fact that palladium is far rarer than platinum, the palladium price (approximately 1 170 USD/ounce) exceeds the platinum price.
The report further indicates that automotive demand for platinum is expected to reach 3.3 million ounces in 2023, a 13% increase over 2017 levels. This surge in automotive demand is primarily fueled by the shift from palladium to platinum, initiated in the past year. It is projected to increase by 615,000 ounces in 2023, along with higher loadings. Additionally, a boost in vehicle production during the second quarter of 2023 contributed to this growth. The impact of semiconductor shortages and other supply chain challenges that affected the industry due to the pandemic and the Ukraine conflict appeared to have diminished significantly.
WPIC notably pointed out a 14% enhancement in light vehicle production and an 18% surge in heavy-duty vehicle production in the second quarter of 2023. Moreover, both China and Japan experienced remarkable growth in vehicle production during this timeframe. Japan witnessed a 20% upswing in the production of gasoline and diesel cars in the second quarter of 2023 compared with the corresponding period in 2022.
To summarize: following a shift from palladium to platinum in catalytic converters in the automotive industry, an increase in demand for platinum is anticipated in the automotive industry. This shift is likely motivated by factors including cost considerations and availability, whereas platinum is more available and less pricy than palladium. Furthermore, the platinum supply is limited given low production levels in 2022 and through 2023, fueling further potential upside to the platinum price in the foreseeable future.
Related Products
Platinum (USD/Ounce), one-year daily chart
Platinum (USD/Ounce), five-year weekly chart
Macro comments
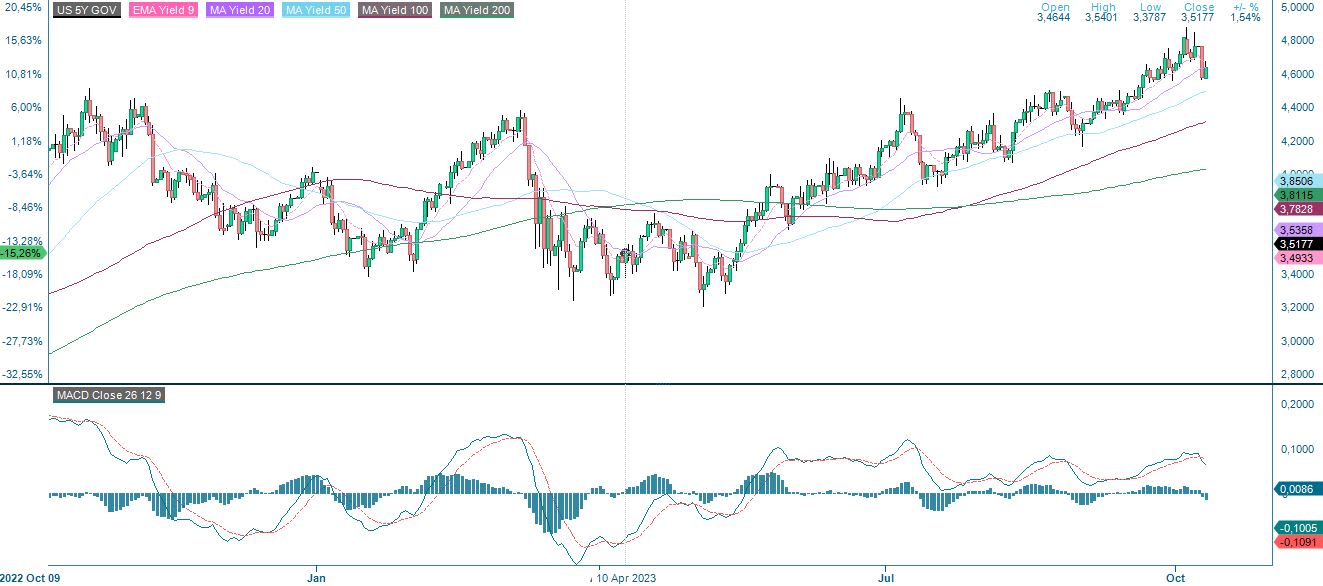
The military clashes between Hamas and Israel, which began on Saturday morning 7th October, threaten to draw more countries into the conflict, including oil-rich Iran. This led to a risk-off mood on the global stock markets on Monday 9 October. At the time of writing, the US two-year Treasury yield has fallen 23 basis points to 4.97% and the ten-year US Treasury yield has fallen 13 basis points to 4.68%. This can be explained by investors "running to safety" by buying US government bonds. At the same time, the market is anticipating that the war between Israel and Hamas could have an impact on the Fed's future interest rate policy. If this will be the case remains to be seen.
US non-farm payrolls rose by 336,000 in September, compared with the average forecast of 170,000. At the same time, the number of jobs created in August was revised down by 8,000 to an increase of 179,000. Average hourly earnings rose by 4.2% year on year, compared to an estimate of 4.3%.
The strong US employment figures give the Fed an argument to continue to communicate that high interest rates should be "higher for longer". This has led to less inverted yield curves (10-year rates have risen more than 2-year rates). The market is pricing in a 30% probability of a rate hike on 1 November and a 45% probability of a hike at the December FOMC meeting.
US 5-year Treasury yield (in %), one-year daily chart
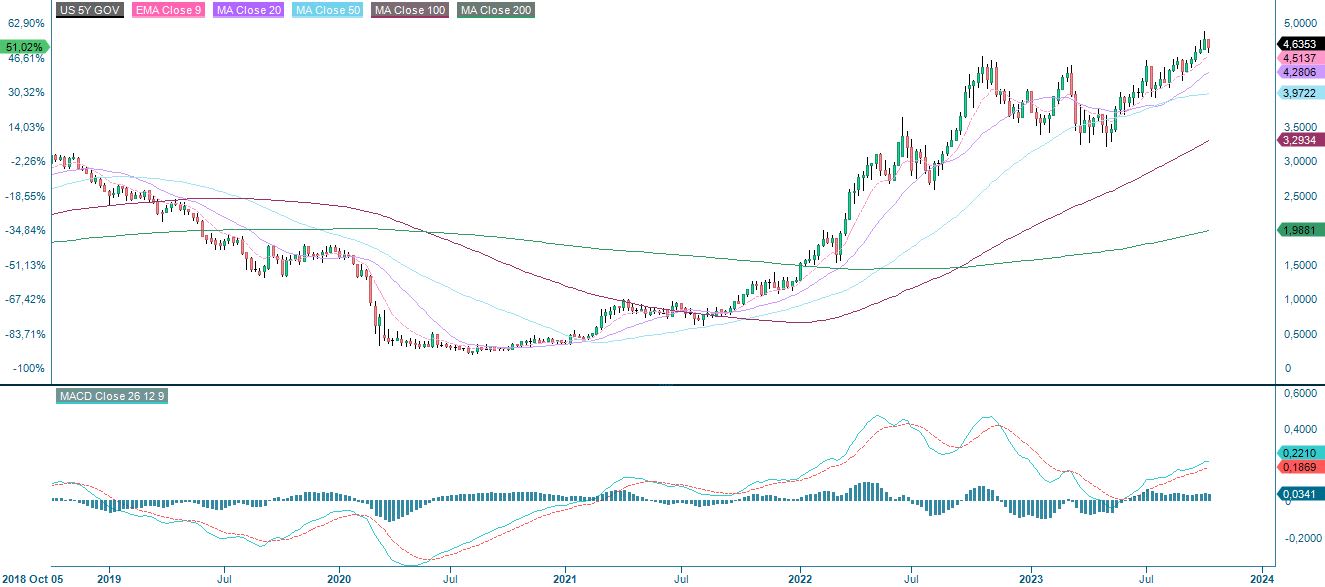
US 5-year Treasury yield (in %), five-year weekly chart
German Consumer Price Index (CPI) for September and US Producer Price Index (PPI) for September will be released on Wednesday 11th of October. In the evening, the minutes of the 20th of September FOMC meeting are due.
Japanese machinery orders for August, UK GDP and industrial production for August and US CPI in September and weekly initial jobless claims are due on Thursday 12th of October. On Thursday there will also be Q3 2023 results posted by Delta Airlines, Fastenal, Infosys, and Walgreen Boots Alliance.
On Friday morning 13th October, China will release its CPI, PPI, and trade balance for September. In Europe, September CPI are due from Sweden, France, and Spain and August Industrial production from the eurozone After lunch, the US will release import prices for September and the Michigan index for October. On Friday 13 October, JP Morgan Chase, Blackrock, Citigroup, PNC Financial, The Progressive, United Health Group and Wells Fargo report their Q3 results. Within the S&P500 financial sector, the best results are expected from insurance companies and somewhat weaker, but still quite good, from banks. Meanwhile, investment banks are on average expected to post negative earnings growth in Q3 2023.
Soft buy signals all over the place. Is Nasdaq 100 set for 16,000?
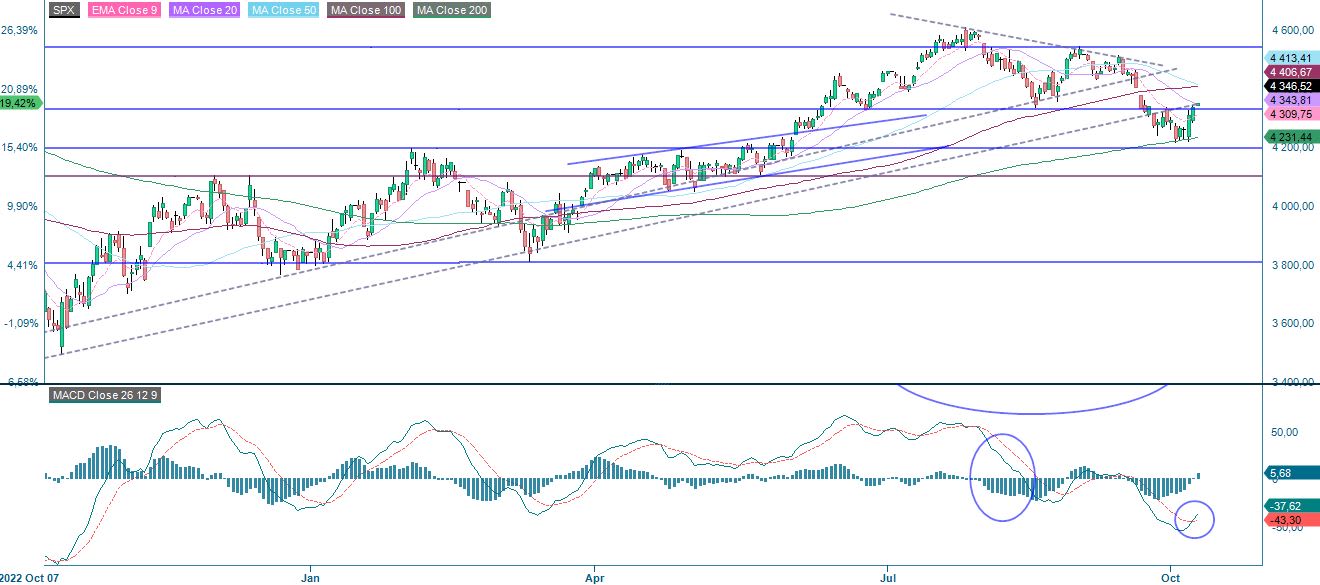
Stocks in the US bounced nicely of the support made up by MA200. S&P 500 is currently trying to retake MA20. A break is good news for the short-term trend as it would go from negative to positive. Note how MACD has generated a soft buy signal. In case of a break on the upside, the next level is just above 4,400 where MA100 and MA50 converge.
S&P 500 (in USD), one-year daily chart
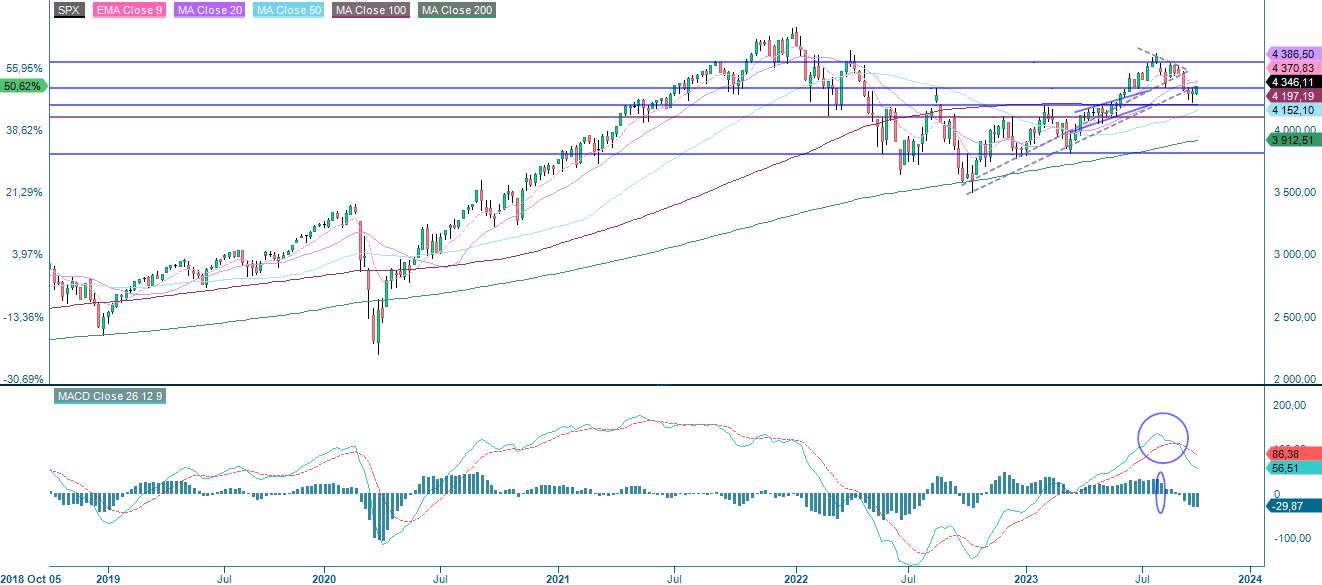
S&P 500 (in USD), weekly five-year chart
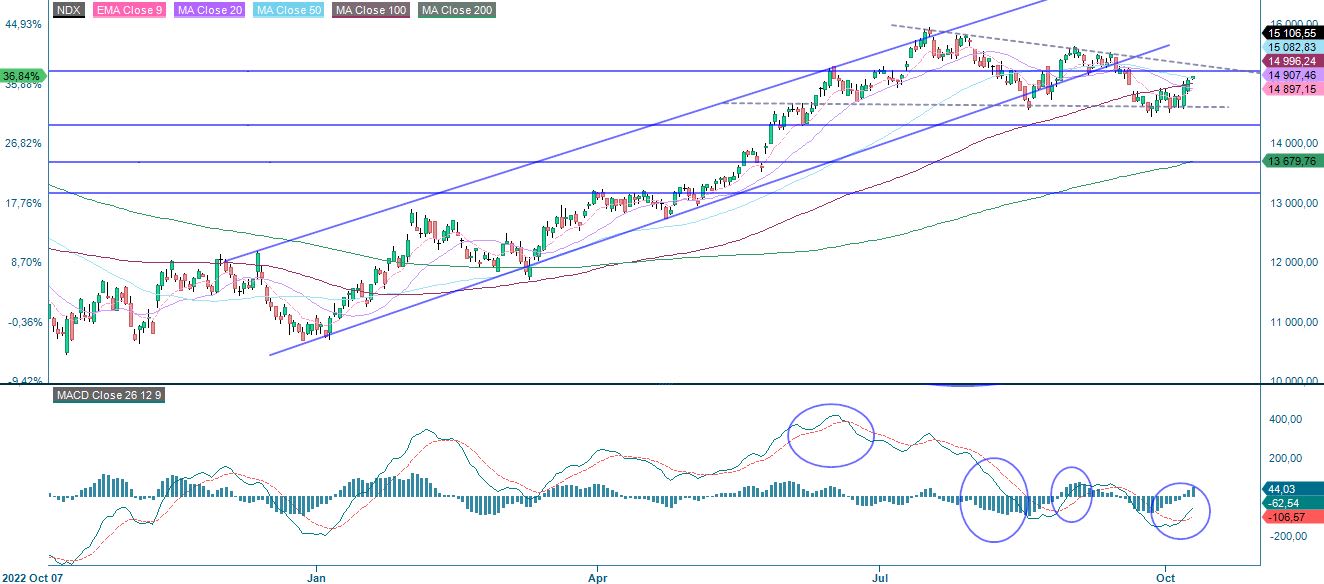
Nasdaq is currently trading above MA20 and MA50. MACD has recently generated a soft buy signal. A breakout from the descending wedge-formation is bullish with a target level around 16,000.
Related Products
Nasdaq 100 (in USD), one-year daily chart
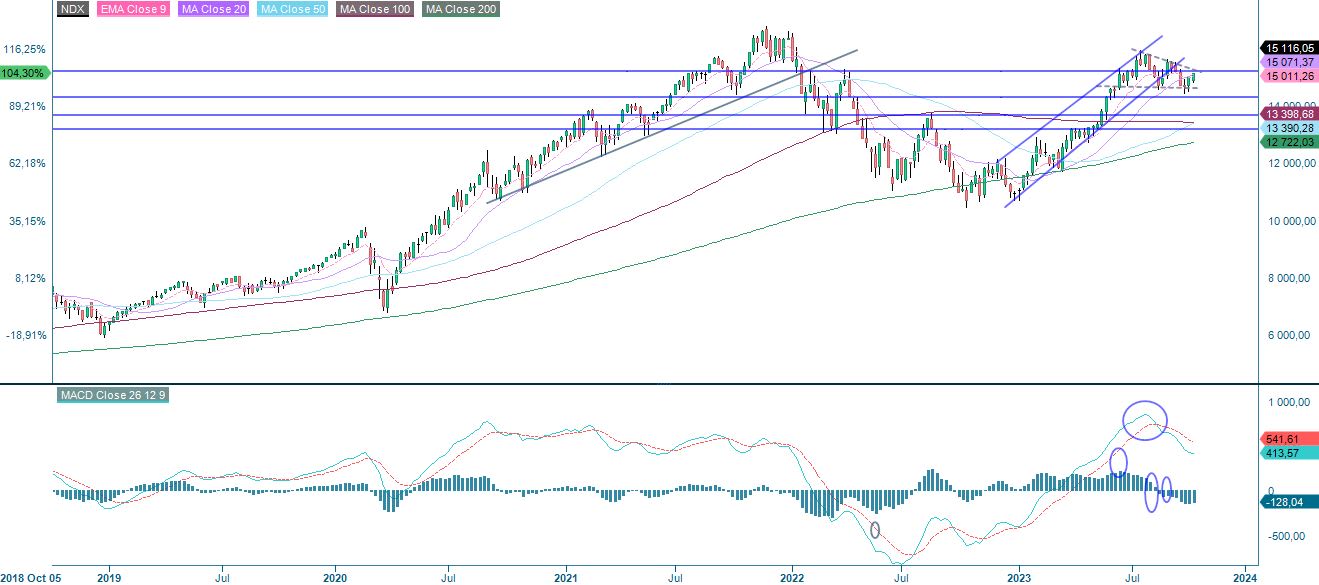
Nasdaq 100 (in USD), weekly five-year chart
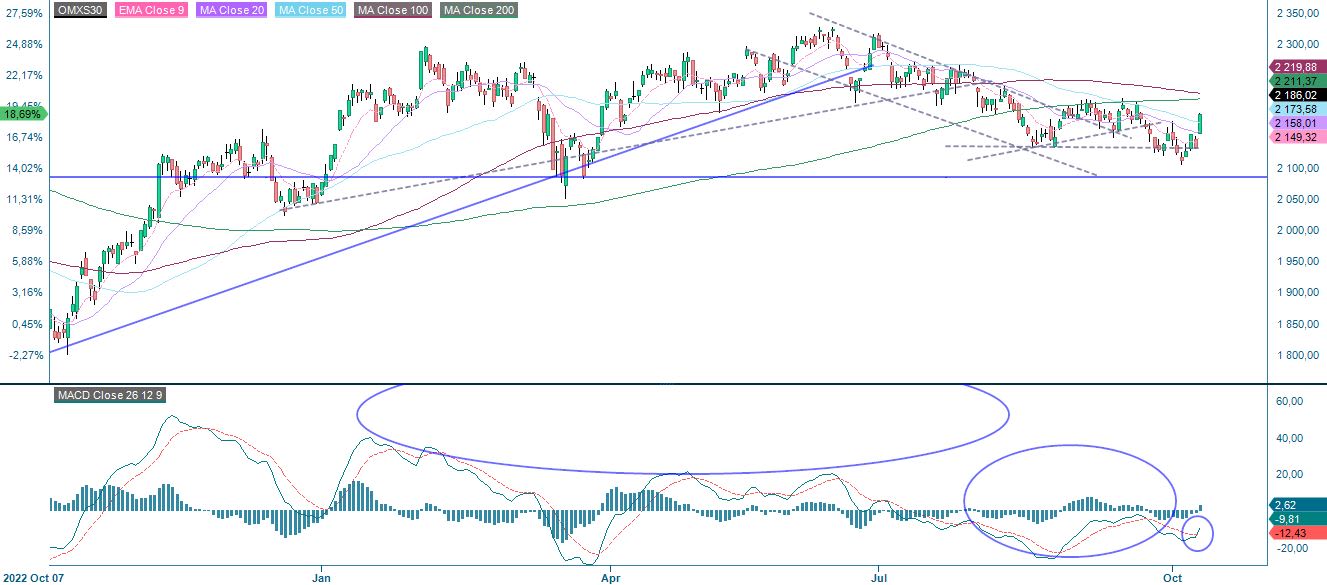
MACD for OMXS30 has also generated a soft buy-signal as the index is trading above its MA50. MA200 just above 2,210 is the next level. A break above MA200 and levels around 2,300 may be tested.
Related Products
OMXS30 (in SEK), one-year daily chart
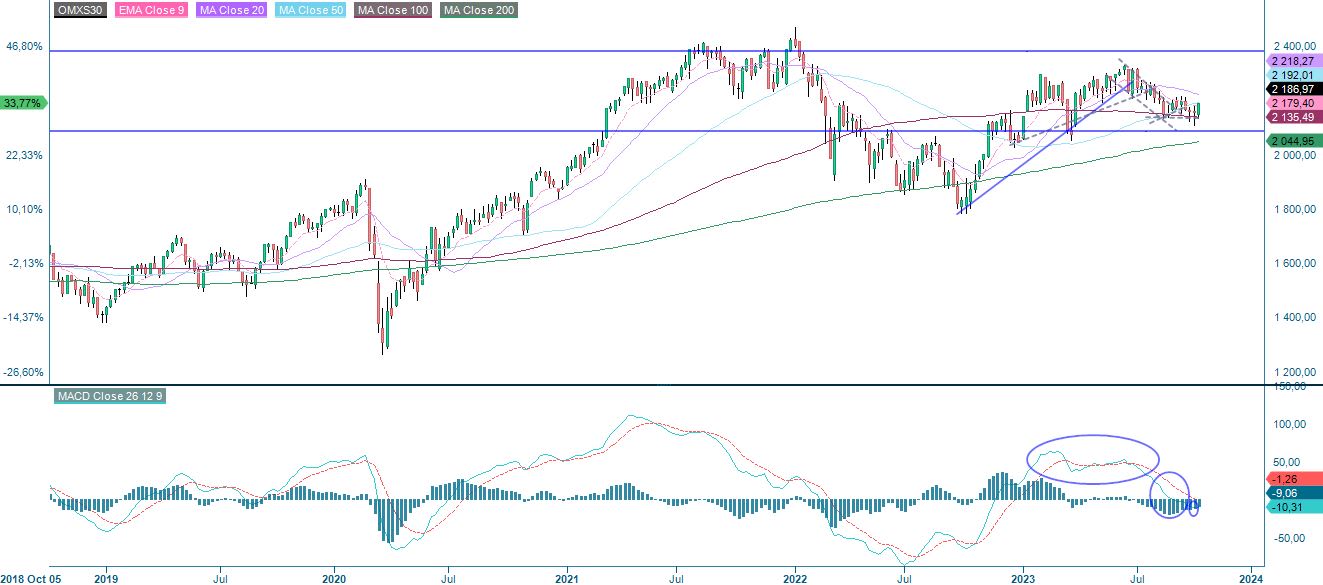
OMXS30 (in SEK), weekly five-year chart
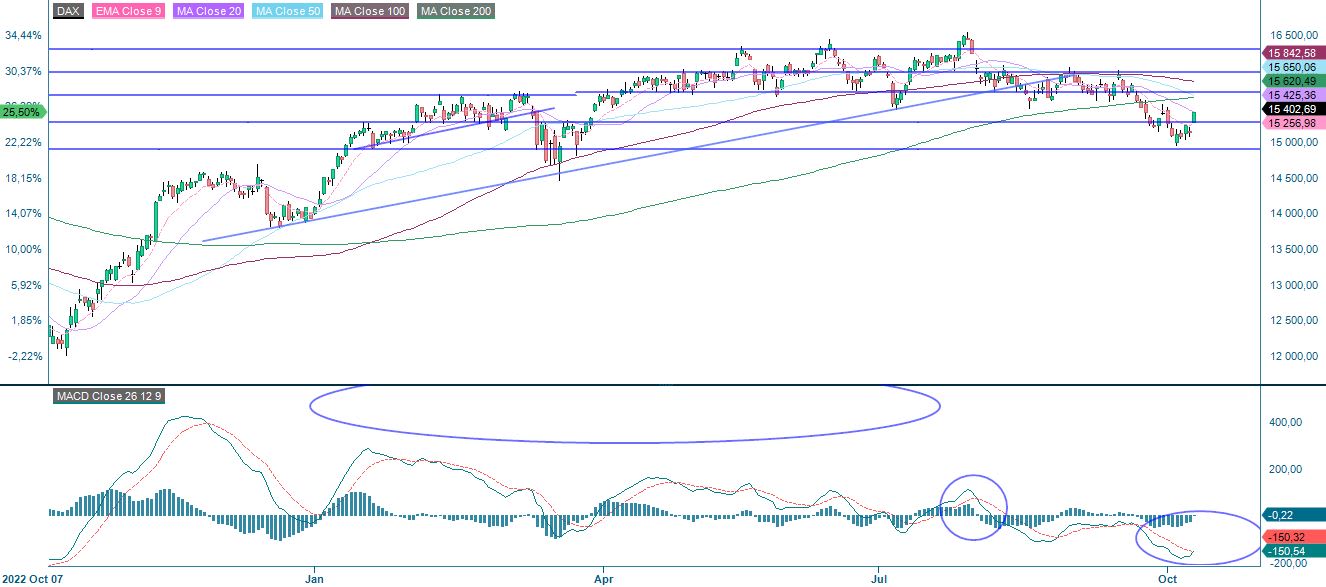
DAX also managed to bounce of the support and is currently testing MA20. A break on the upside and levels around 15,620-15,660 may be next. MACD is close to be generating a soft buy-signal.
DAX (in EUR), one-year daily chart
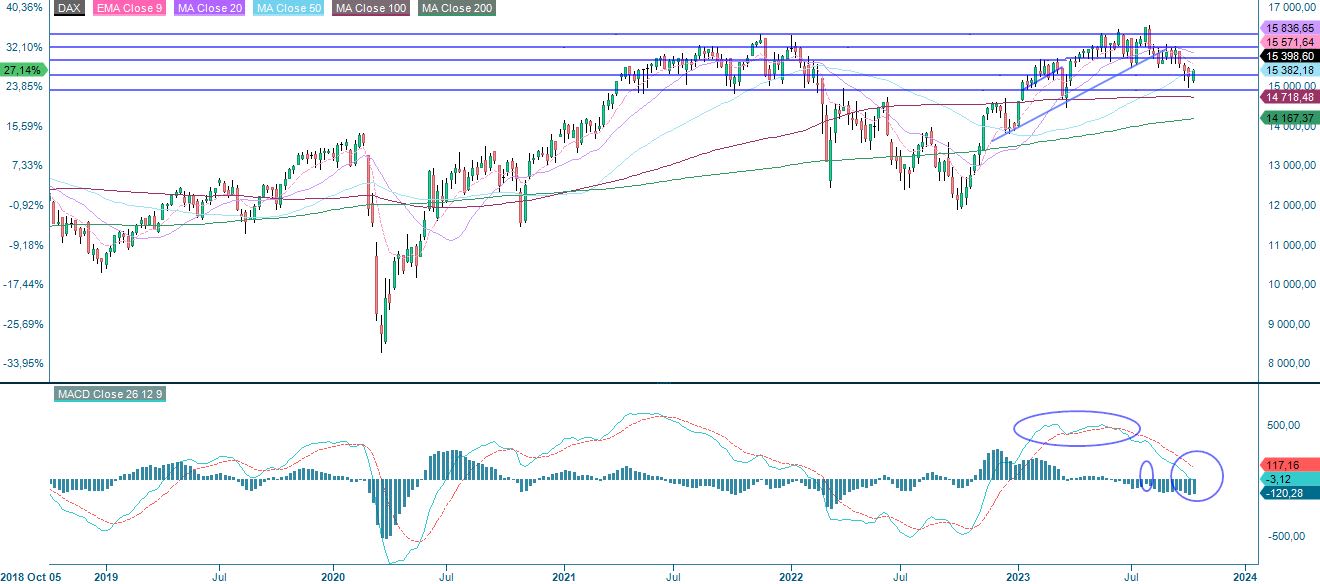
DAX (in EUR), weekly five-year chart
The full name for abbreviations used in the previous text:
EMA 9: 9-day exponential moving average
Fibonacci: There are several Fibonacci lines used in technical analysis. Fibonacci numbers are a sequence in which each successive number is the sum of the two previous numbers.
MA20: 20-day moving average
MA50: 50-day moving average
MA100: 100-day moving average
MA200: 200-day moving average
MACD: Moving average convergence divergence
Risks
External author:
This information is in the sole responsibility of the guest author and does not necessarily represent the opinion of Bank Vontobel Europe AG or any other company of the Vontobel Group. This information is sponsored by Bank Vontobel Europe AG, which may be a counterparty to transactions involving the financial instruments discussed in this information. The further development of the index or a company as well as its share price depends on a large number of company-, group- and sector-specific as well as economic factors. When forming his investment decision, each investor must take into account the risk of price losses. Please note that investing in these products will not generate ongoing income.
The products are not capital protected, in the worst case a total loss of the invested capital is possible. In the event of insolvency of the issuer and the guarantor, the investor bears the risk of a total loss of his investment. In any case, investors should note that past performance and / or analysts' opinions are no adequate indicator of future performance. The performance of the underlyings depends on a variety of economic, entrepreneurial and political factors that should be taken into account in the formation of a market expectation.
Disclaimer:
This information is neither an investment advice nor an investment or investment strategy recommendation, but advertisement. The complete information on the products (securities) mentioned herein, in particular the structure and risks associated with an investment, are described in the base prospectus, together with any supplements, as well as the final terms relating to the securities. The base prospectus and final terms constitute the solely binding sales documents for the products mentioned herein. It is recommended that potential investors read these documents before making any investment decision. The documents and the key information document are published on the website of the issuer, Vontobel Financial Products GmbH, Bockenheimer Landstrasse 24, 60323 Frankfurt am Main, Germany, on https://prospectus.vontobel.com and are available from the issuer free of charge. The approval of the prospectus should not be understood as an endorsement of the securities. The securities are products that are not simple and may be difficult to understand. This information includes or relates to figures of past performance. Past performance is not a reliable indicator of future performance. This information may only be distributed or published in countries where such distribution or publication is permitted by applicable law. As stated in the relevant base prospectus, the distribution of the securities mentioned in this information is subject to restrictions in certain jurisdictions. This advertisement may not be reproduced or redistributed without prior permission by Vontobel.
© Bank Vontobel Europe AG and / or affiliated companies. All rights reserved.