Time to catch up on tech


It took the market some time to digest the ever-so-important US job figures that gave us mixed signals. Meanwhile, the spread between S & P 500 and the equally weighted S & P 500 implies that the tech sector may have done its job. On soft commodities, Soybeans were so 2020 to 2022.
Case of the week: Chinese customs control boosts soybean stocks
Global soybean prices have significantly declined in recent months, falling well below the average levels observed in the past two years. At the moment, we observe an imbalance between the demand and supply. The leading exporters, Brazil and USA, anticipate growing demand, while Chinese imports have experienced a slowdown following stricter import control and more extensive stocks of domestically produced soybeans.
According to the US Department of Agriculture (USDA), Brazil's soybean harvest 2023 is estimated at 155 million tonnes, surpassing the previous record by 11%. The corresponding number in the US is approximately 122.7 tonnes, while Argentina, the third largest exporter, is expected to produce average yields in 2023 (about 44 million tonnes).
The robust harvests expected in the three major soybean exporting countries in 2023-24 could result in a nearly 11% increase in global production compared to the current year, marking the most significant annual gain in seven years.
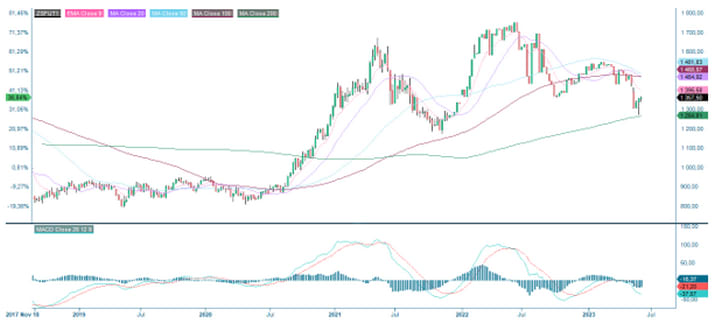
China, the largest importer of soybeans, typically imports between 95 million and 97 million tonnes of soybeans annually, with the majority sourced from Brazil and the United States. Approximately 80% of these imported soybeans produce protein-rich soybean meal, which serves as animal feed, predominantly for China's extensive pork sector. Lately, Chinese customs have toughened quality inspection norms for imported soybeans, with the average duration for vessel inspections surpassing 20 days compared to the usual timeframe of 3-4 days. Combined with the large production numbers in Brazil, USA, and Argentina, we could see a potential build-up of stored soybeans following the Chinese customs delay. Furthermore, the inventory of domestically produced soybeans has increased in China. The stricter import inspection regulations will compel farmers to purchase locally sourced soybeans instead of imported soybeans once their existing stock is depleted, fueling a further possible decline in soybean prices.
Soybean future (CBT$/Bushel), daily one-year price chart

Soybean future (CBT$/Bushel), weekly five-year price chart
General market comments: US job figures are digested by the market, and its good news for stocks
Last week, eyes were set on China's Purchasing Managers' Index (PMI), European inflation, the US debt ceiling and, of course, the US labour market. Nikkei and Nasdaq 100 are the winners, while OMXC20 and OMXH25 have lagged since May 8th 2023. See the chart below where SPXE represent S&P 500 Equal weights.
Persentage development since 08 May, 2023

China's PMI came in at a five-month low, weaker than expected, increasing the uncertainty on the strength of the country’s recovery. The PMI figures sent HSI down, but the index more than recovered nicely on Friday. However, currently, the index seems to be having difficulties breaking the falling trend.
European inflation came in on the soft side. Food prices increased slightly with some exceptions in the details. E.g., in Germany, food prices fell for the second consecutive month. The softening inflation tightens the room for further rate hikes by the ECB. Nevertheless, German 2-year yield is up this week.
The news on the US House of Representatives and the Senate that passed the deal on increasing the debt ceiling was challenging to avoid. However, this was largely already discounted in the market, as no significant rally could be associated with the event.
On Friday, the critical US job figures showed a strong job creation in May of 339k, compared to the expected 180k. Wages increased by 4.3%, in line with expectations. That all support the Fed to continue hiking rates. However, on the other side, the unemployment rate landed at 3.7%, higher than expected at 3.5%. Also, the monthly hourly wage increased sequentially by 0.3%, below expectations of 0.4%.
The initial move on the US markets was also contrary as stocks and interest rates rose. During the beginning of this week, as the job figures have been digested, the probability of a Fed rate hike in June has come down to the current 24%, down from 67% on May 30th. Stocks are up so far this week, while rates are coming down. A soft reading for the ISM service on Monday at 54.9, versus the expected 55.1, may have contributed a tiny notch.
What’s next this week
The macro agenda for the remaining day of the week is relatively thin. Today, OECD will release a new Economic Outlook. In the US, we have Initial jobless claims on Thursday, while Norwegian CPI is due on Friday, 9 June. Next week will be busier with Consumer Price Index (CPI) from the US on Tuesday and the eurozone on Friday.
Time for a catch up on tech
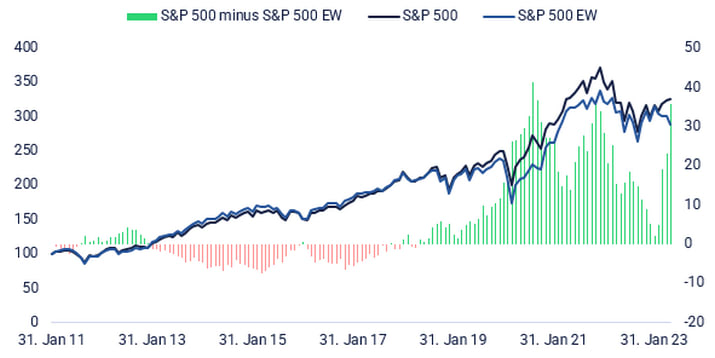
Over the last 30 days, Nasdaq (along with Nikkei) has been the clear winner. The broader S&P 500 is up 3.3% thanks to the heavily weighted tech giants. Worth noticing is that the spread between S&P 500 and equally weighted S&P 500 (S&P 500 EW) is getting close to levels where it bounced back before. See the chart below. It may be time for the rest of the market to catch up. In such a scenario, S&P 500 may outperform Nasdaq.
Stock market development since 31 Dec, 2010. Index = 100
Resistance in S&P 500 is getting closer while Nasdaq is overbought
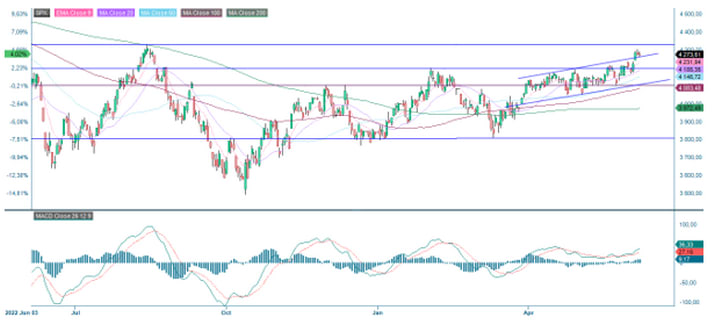
S&P 500 broke up above the ceiling of a short rising trend channel. The previous high from August 2022, around 4,300, remains the first resistance level.
S&P500 price chart (in USD), one-year daily chart
S&P500 price chart (in USD), five-year weekly chart

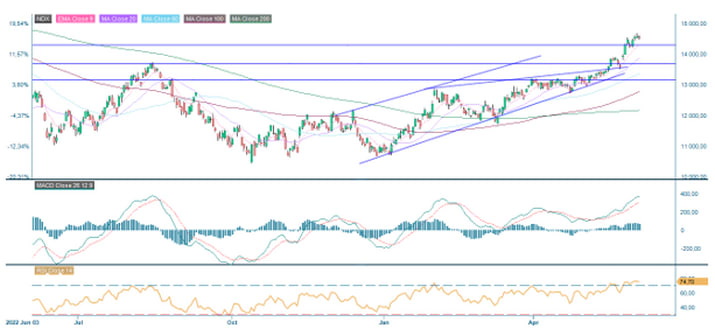
Nasdaq 100 has been trading more or less sideways during the first two days of this week. In the case of regained strength, the next level is around 15,200. Note that the index may be at overbought levels.
Nasdaq 100 (in USD), one-year daily chart
Nasdaq 100 (in USD), weekly five-year chart

OMXS30 is trading close to the ceiling of a slightly rising trend channel. Note that Monday’s trading ended with a scary-looking doji. The negative divergence between the index and MACD remains.
OMXS30 (in SEK), two-year daily chart

With some effort, a bullish flag-like formation can be spotted in the weekly chart.
OMXS30 (in SEK), weekly five-year chart

The German DAX also struggles to find direction under negative divergence with MACD.
DAX (in EUR), two-year daily chart

Note that MACD has generated a soft sell signal in the weekly chart.
DAX (in EUR), weekly five-year chart

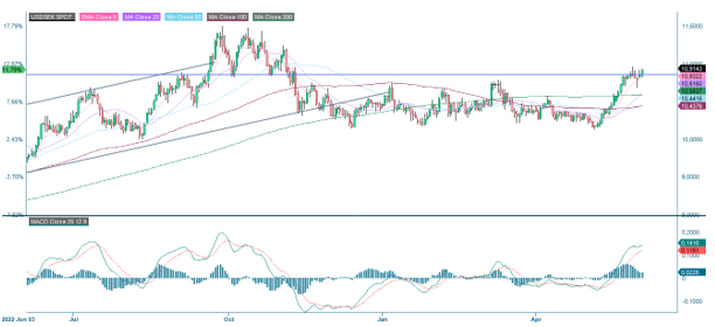
The SEK is in trouble. The chart below shows that the resistance of around 10.85 versus the USD has been broken. Is 11,2 next? Nevertheless, such a scenario would serve OMXS30 well.
USD/SEK, one-year daily graph
The instruments below have the underlying USD per 1 SEK.
EUR/SEK, five-year weekly graph

The full name for abbreviations used in the previous text:
EMA 9: 9-day exponential moving average
Fibonacci: There are several Fibonacci lines used in technical analysis. Fibonacci numbers are a sequence of numbers in which each successive number is the sum of the two previous numbers.
MA20: 20-day moving average
MA50: 50-day moving average
MA100: 100-day moving average
MA200: 200-day moving average
MACD: Moving average convergence divergence
Risks
External author:
This information is in the sole responsibility of the guest author and does not necessarily represent the opinion of Bank Vontobel Europe AG or any other company of the Vontobel Group. This information is sponsored by Bank Vontobel Europe AG, which may be a counterparty to transactions involving the financial instruments discussed in this information. The further development of the index or a company as well as its share price depends on a large number of company-, group- and sector-specific as well as economic factors. When forming his investment decision, each investor must take into account the risk of price losses. Please note that investing in these products will not generate ongoing income.
The products are not capital protected, in the worst case a total loss of the invested capital is possible. In the event of insolvency of the issuer and the guarantor, the investor bears the risk of a total loss of his investment. In any case, investors should note that past performance and / or analysts' opinions are no adequate indicator of future performance. The performance of the underlyings depends on a variety of economic, entrepreneurial and political factors that should be taken into account in the formation of a market expectation.
Disclaimer:
This information is neither an investment advice nor an investment or investment strategy recommendation, but advertisement. The complete information on the products (securities) mentioned herein, in particular the structure and risks associated with an investment, are described in the base prospectus, together with any supplements, as well as the final terms relating to the securities. The base prospectus and final terms constitute the solely binding sales documents for the products mentioned herein. It is recommended that potential investors read these documents before making any investment decision. The documents and the key information document are published on the website of the issuer, Vontobel Financial Products GmbH, Bockenheimer Landstrasse 24, 60323 Frankfurt am Main, Germany, on https://prospectus.vontobel.com and are available from the issuer free of charge. The approval of the prospectus should not be understood as an endorsement of the securities. The securities are products that are not simple and may be difficult to understand. This information includes or relates to figures of past performance. Past performance is not a reliable indicator of future performance. This information may only be distributed or published in countries where such distribution or publication is permitted by applicable law. As stated in the relevant base prospectus, the distribution of the securities mentioned in this information is subject to restrictions in certain jurisdictions. This advertisement may not be reproduced or redistributed without prior permission by Vontobel.
© Bank Vontobel Europe AG and / or affiliated companies. All rights reserved.