Earnings in focus. Intel may benefit from China reopening


US technology giants such as Intel stand to benefit as China reopens. The Nasdaq has begun to perform this week after previously having lagged.
Downward adjusted estimates ahead of the earnings season
The Q4 2022 reporting season has so far left a mixed impression. Ahead of the earnings season, analysts have adjusted the expected earnings growth to negative 4.6 per cent for the S&P 500 companies. That can be compared to estimates from December 2021 of a negative earnings growth of 3.2 per cent.
Now 11 per cent of S&P 500 companies have reported their Q4 2022 results, 67 per cent showed profitability above expectations, while the corresponding revenue figure is 64 per cent. Historically, around 75 per cent of S&P 500 company reports tend to surprise analysts’ forecasts.
Earnings insight gives an insight into the economic situation
The most important question, however, is how much evidence of recession companies are seeing. So far, the answer to the question is some, but not more than the stock market already has discounted.
So far, on average, the S&P 500 companies have decreased their operating margin from 11.9 per cent in Q3 2022 to 11.4 per cent in Q4 2022. Profitability is thus still significantly higher than the lowest level recorded during the Covid pandemic in Q2 2020, when the S&P 500 companies reached an operating margin of only 8.5 per cent. Meanwhile, seven of eleven S&P 500 sectors have recorded declining profitability. Only energy, industrial and utility companies have managed to improve their profitability.
Reports of the giants and Personal Consumption Expenditures price Index (PCE) in focus going forward
Regarding the earnings season, the market will focus on Microsoft and Tesla this week. These quarterly results will likely determine the trend for tech-heavy indices such as the Nasdaq 100.
On Friday, the PCE, i.e., core inflation in the US, will be presented. It is expected to fall from 4.7 to 4.0 per cent yearly. The fact that the inflation rate continues to fall back from previously high levels is crucial for bond yields and, thus, for the market’s yield requirements to decline. Together with economic development, it is an essential general parameter for the future development of the stock markets.
Cyclicals taking the lead
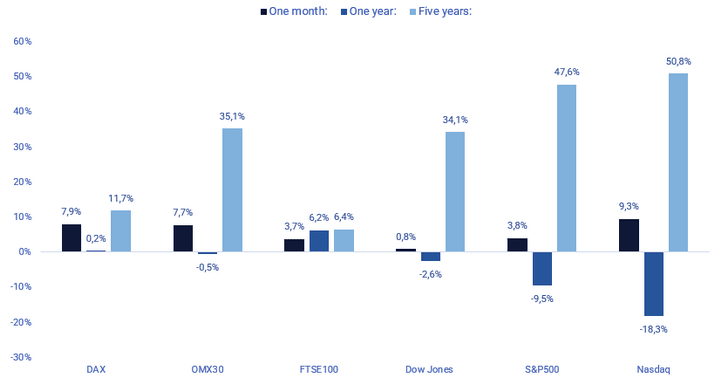
The recovery in Europe’s stock markets has been strong over the past three months, with indices such as the CAC, DAX and OMX up between 15 and 20 per cent. With the Dow Jones index also up around 10 per cent, the common denominator is that equity markets are beginning to discount a recovery for cyclical industries. In contrast, emerging stocks and the technology sector continue to lag, represented by indices such as the Nasdaq 100 and the S&P 500. However, this week we might have begun to see a different pattern, with Nasdaq gaining 9 per cent. One reason is that the US technology sector, with its giants, contrary to the rest of the S&P 500 corporate universe, has a significant revenue exposure to China and other parts of Asia.
Significant stock indices performance in one month, one year and five years
The rise in the world and predominantly European stock markets in the last quarter is strongly linked to the fact that the yield requirement from investors in the form of the 10-year US Treasury bond rate started to fall back from a peak of 4.2 per cent as of 24 October 2022 to 3.5 per cent on 24 January 2023.
US 10-year Treasury yield (%), daily two-year chart

Source: Infront and Carlsquare. Note: Past performance is not a reliable indicator of future results.
OMXS30 and DAX are losing momentum
From a technical perspective, Swedish OMXS30 is trading in a rising trend, close to the ceiling of a shorter rising trend channel. The negative divergence between the index and MACD indicates that OMXS30 is losing momentum. However, several OMXS30 companies are reporting this week, which may further fuel the index.
OMXS30 (in SEK), one-year daily chart
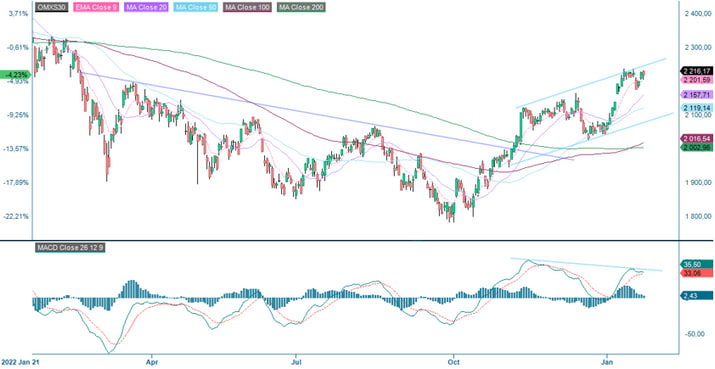
The weekly chart below shows that the index is trading close to resistance in the form of Fibonacci 61.8. However, momentum is positive and rising.
OMXS30 (in SEK), weekly five-year chart

A similar pattern with a negative divergence between MACD and index can be found for the German DAX.
DAX (in EUR), one-year daily chart
Source: Infront and Carlsquare. Note: Past performance is not a reliable indicator of future results.
However, again, the weekly chart shows that the index is trading under a positive and rising momentum.
DAX (in EUR), weekly five-year chart

Nasdaq set for a catch-up
No negative divergence can be found for the Nasdaq 100 index. With falling interest rates, Nasdaq 100 is in good shape to catch up to the European indices. A break above MA200, currently just above 12,000, is an event that signals that that may be the case. However, again, the earnings season can change the outlook.
Nasdaq 100 (in USD), one-year daily chart

The weekly chart below shows that the Nasdaq 100 is trading in a falling wedge under negative but rising momentum. That is yet another good technical setup for a positive move.
Nasdaq 100 (in USD), weekly five-year chart
Source: Infront and Carlsquare. Note: Past performance is not a reliable indicator of future results.
A weakened USD and a reopening of China might lift Intel
Now that the reporting season has kicked off, expectations for 2023 are that US stocks will outperform Europe and Asia with an improved growth outlook in the EU, boosted by a Chinese reopening. With faster economic growth in China and a mild winter in Europe, growth estimates for the Euro area have changed. Goldman Sachs now estimates a 0.6 per cent growth versus the 0.3 per cent consensus. Recent economic data from the US has sent mixed signals, while the growth outlook in China has been improving swiftly. China’s GDP growth expectations have increased from 4.5 per cent to 5.5 per cent in the last two months. As a swifter reopening scenario for China has become more probable, US stocks with significant Asian revenue exposure, such as Qualcomm, NVIDIA, Tesla, and Dupont, have outperformed the rest of the S&P 500 companies with less foreign sales exposure.
When viewing S&P 500 companies, Intel Corp’s share is trading at levels not seen since late 2015. Given their 44 per cent revenue exposure to China and a weakening USD against the Renminbi, the Intel share could get support in Q1-Q2 2023 as the sales outlook improves from the region. Intel will report their Q4 earnings on Thursday, January 26.
Intel Corp (USD), one-year daily chart

Intel Corp (in USD), weekly five-year chart

The full name for abbreviations used in the previous text:
EMA 5: 5-day exponential moving average
EMA 9: 9-day exponential moving average
Fibonacci: There are several Fibonacci lines used in technical analysis.
Fibonacci numbers are a sequence of numbers in which each successive number is
the sum of the two previous numbers.
BB 20,2: Bollinger Bands area flowing MA20 and 2 standard deviations
MA20: 20-day moving average
MA50: 50-day moving average
MA100: 100-day moving average
MA200: 200-day moving average
MACD: Moving average convergence divergence
Risks
Important notice:
This information is neither an investment advice nor an investment or investment strategy recommendation, but advertisement. The complete information on the trading products (securities) mentioned herein, in particular the structure and risks associated with an investment, are described in the base prospectus, together with any supplements, as well as the final terms. The base prospectus and final terms constitute the solely binding sales documents for the securities and are available under the product links. It is recommended that potential investors read these documents before making any investment decision. The documents and the key information document are published on the website of the issuer, Vontobel Financial Products GmbH, Bockenheimer Landstrasse 24, 60323 Frankfurt am Main, Germany, on prospectus.vontobel.com and are available from the issuer free of charge. The approval of the prospectus should not be understood as an endorsement of the securities. The securities are products that are not simple and may be difficult to understand. This information includes or relates to figures of past performance. Past performance is not a reliable indicator of future results.