The US earnings season is ending strongly


This week's case is a follow-up on Rocket Lab, a fast-growing company that provides products and services for the space industry. Since September 2025, the Rocket share price has increased significantly. Given the recent publication of its Q1 2026 report, the timing is right to consider an opposite trade in the stock. Meanwhile, the Q1 2026 reporting season S&P 500 companies in the US has concluded as convincingly as it began.
Case of the week: A rocket that may remain on the ground
As discussed in a previous article on Rocket Lab (NASDAQ: RKLB), published in September 2025, the stock price has steadily increased over the last eight months. Recent contract wins have put Rocket Lab on par with larger companies, such as Lockheed Martin and Northrop Grumman. the hype train is moving full steam ahead. However, it's possible that the hype has surpassed the underlying fundamentals.
Since late 2024, US-based space companies have experienced significant upward trading, driven by increasing government spending and the industry's growing attractiveness. Much of this growth is due to increased support from the US government. In April, Washington's policy became more supportive when the administration proposed a record-high $1.5 trillion FY2027 national defense budget, a 38% real increase compared to FY 2026 spending. DoD documentation highlights a 20% increase in Space Force personnel funding. Additionally, in March, the Bureau of Industry and Security (BIS) and the Directorate of Defense Trade Controls (DDTC) issued a final rule shifted most commercial satellites and components out of the International Traffic in Arms Regulations (ITAR), which took effect on April 14, 2026, and eased licensing for U.S. launch providers and spacecraft suppliers.
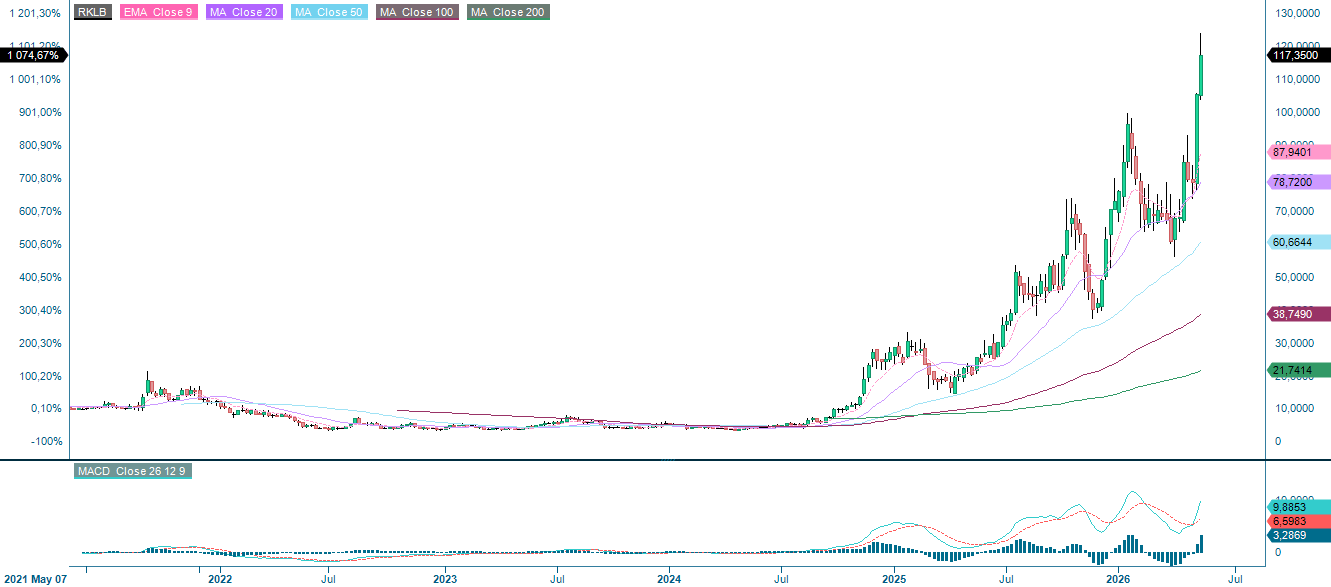
As for Rocket Lab in particular, the Q1 2026 report was released on Thursday evening, May 7. The company revealed record-breaking figures: revenues increased ~64% year over year (YoY) to just over USD 200 million. Compared to the previous quarter, growth was 11.5%, driven mainly by growth in the satellite platforms business and the solar business unit. Furthermore, the company's backlog more than doubled, surpassing USD 2.2 billion. Regarding profitability, adjusted EBITDA remained negative at a margin of -5.9%, although it grew by ~61% year over year. Following the share pullback in late April, Rocket Lab is expected to regain positive trajectory in the short term due to the strong results presented in the Q1 2026 report.
Valuation levels may far exceed actual fundamentals. The market is pricing in sustained high growth and continued revenue generation from new business areas, such as space data centers. However, space-based infrastructure has not been proven at the scale at which the markets are pricing it. No hyperscaler has committed to a procurement program, the economics of in-orbit data processing have yet to be established yet, and the timeline is entirely speculative. The risk is that the market is pricing in a material probability of a business line without a single signed customer, defined product, or validated unit economics model. Further risk lies in competition; the SpaceX IPO could be the biggest worry. When Neutron launches, it will enter a market where SpaceX's Falcon 9 has over a decade of operational reliability, a cost structure that no new entrant can replicate, and a launch cadence of over 100 missions per year. SpaceX is also developing Starship. If Starship achieves full reusability, it could render the medium-lift segment uneconomical for new entrants. Rocket Lab's Electron has carved out a defensible niche in the small launch market. However, this niche is under pressure from competitors, including those in Europe and China. The window for Neutron to establish itself before the competitive landscape becomes overwhelming may be narrower than the market currently anticipates.
In summary, although Rocket Lab displayed solid financial performance in the first half of 2026, significant risks are not reflected in current trading prices and multiples. Rocket Lab is trading well above its European and US-based peers and is already at or near many equity research reports' bull case levels. A short opportunity may be presenting itself, with the optimal time for the trade being when the hype and upward momentum peak following the Q1 2026 report.
Related Products
Rocket Lab (in USD), one-year daily chart

Rocket Lab (in USD), five-year weekly chart
Macro comments
As of Friday, May 8, 89% of all S&P 500 companies had reported their first-quarter 2026 results. According to Earnings Insight, 84% of these companies had positive earnings surprises, and 80% had positive revenue surprises. In Q1 2026, the top three S&P 500 sectors were Information Technology, Health Care, and Consumer Staples, withrespective shares of positive earnings surprises of 94%, 91%, and 88%, respectively.
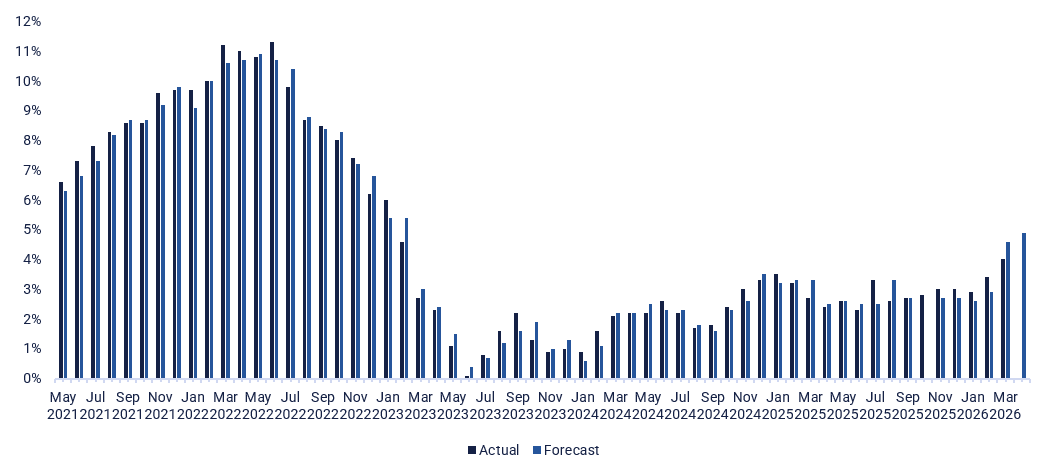
On Wednesday, May 13, we will receive interim reports from German Siemens, U.S. Cisco, Japanese SoftBank and Chinese Alibaba and Tencent. The macroeconomic news begins with Japan's current account balance for March. Next, we will move on to Europe, where we will receive the consumer price index for April from Sweden and France. Industrial production data for March and GDP data for the first quarter from the Eurozone are expected. Monthly oil reports from the IEA and OPEC will soon follow . The U.S. will contribute the producer price index for April (see graph below) and weekly oil stock reports from the Department of Energy.
An interim report from Swedish Klarna (listed in New York) is due Thursday, May 14. This is a public holiday in the Nordic region, so the stock exchanges in Copenhagen, Helsinki, Oslo and Stockholm are closed. Turning to macroeconomic news, we start with the UK's GDP for the first quarter and industrial production in March. Spain will report the consumer price index for April. The US will release retail trade and import prices for April, as well as intial weekly jobless claims and unsold goods inventories for March.
On Friday, May 15, the macro news feed will begin with Japan's producer price index for April. Next will be Germany's wholesale prices and Italy's consumer price index, both of which are for April. After that, we will receive the Empire State Manufacturing Index for May and the industrial production report for April from the U.S.
US Producer Price Index, May 2021-April 2026
A long DAX and a short S&P 500 still looking good
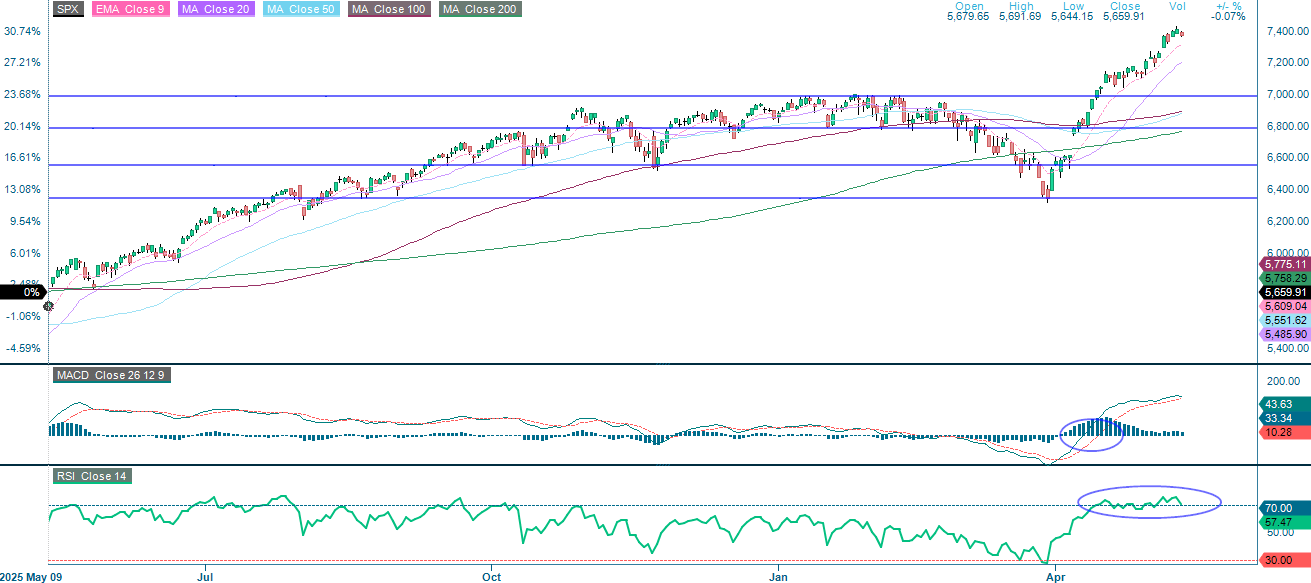
The earnings-fuelled rally that began in April continued to support the S&P 500. As the chart below shows, the RSI remains at overbought levels — a signal that has persisted long enough to test the patience of anyone positioned against the move. Meanwhile, US T-bill yields have risen alongside the oil price, adding a layer of macro complexity to an already overheated market. Timing remains the central challenge, but the short S&P 500, long DAX trade continues to look promising.
Related Products
S&P 500 (in USD), one-year daily chart
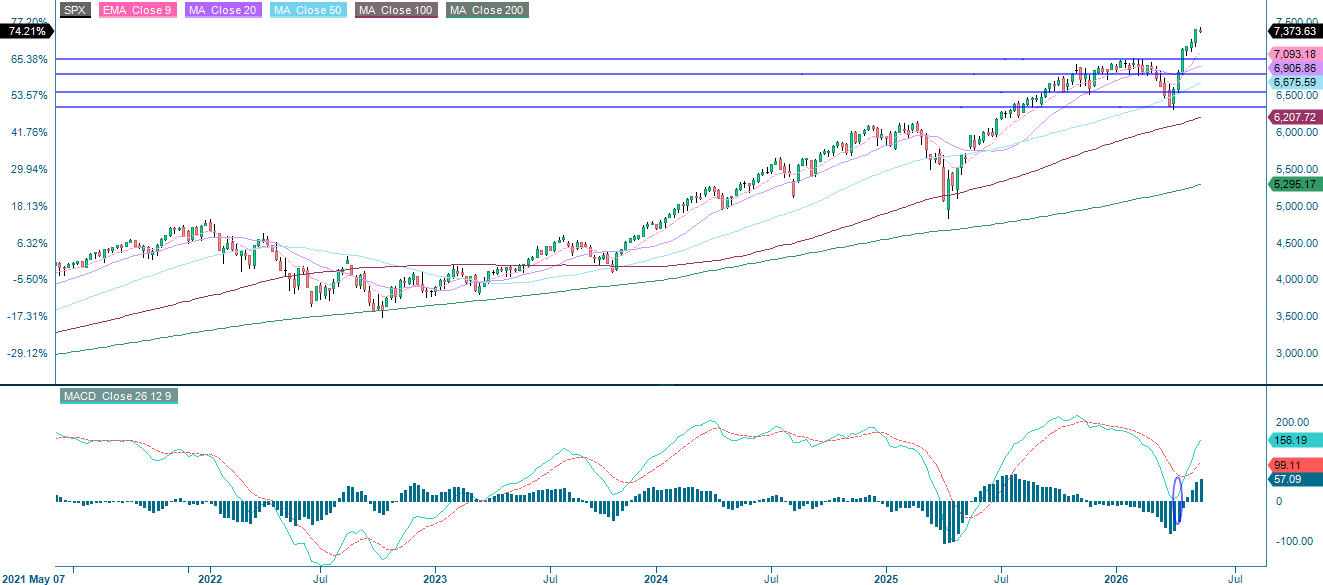
S&P 500 (in USD), five-year weekly chart
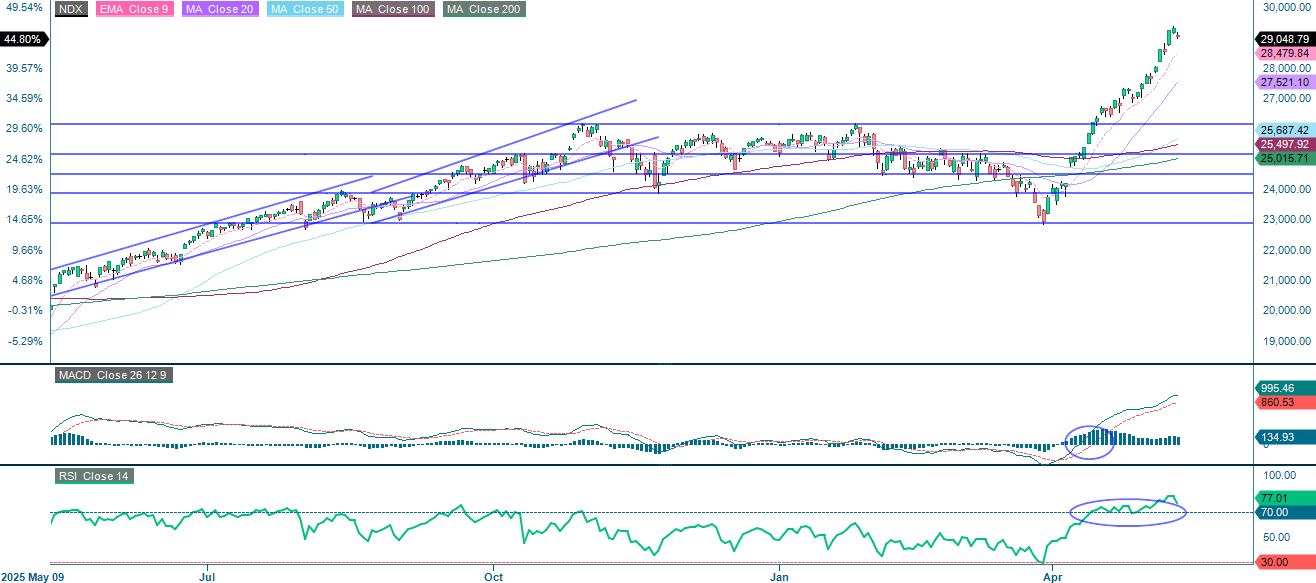
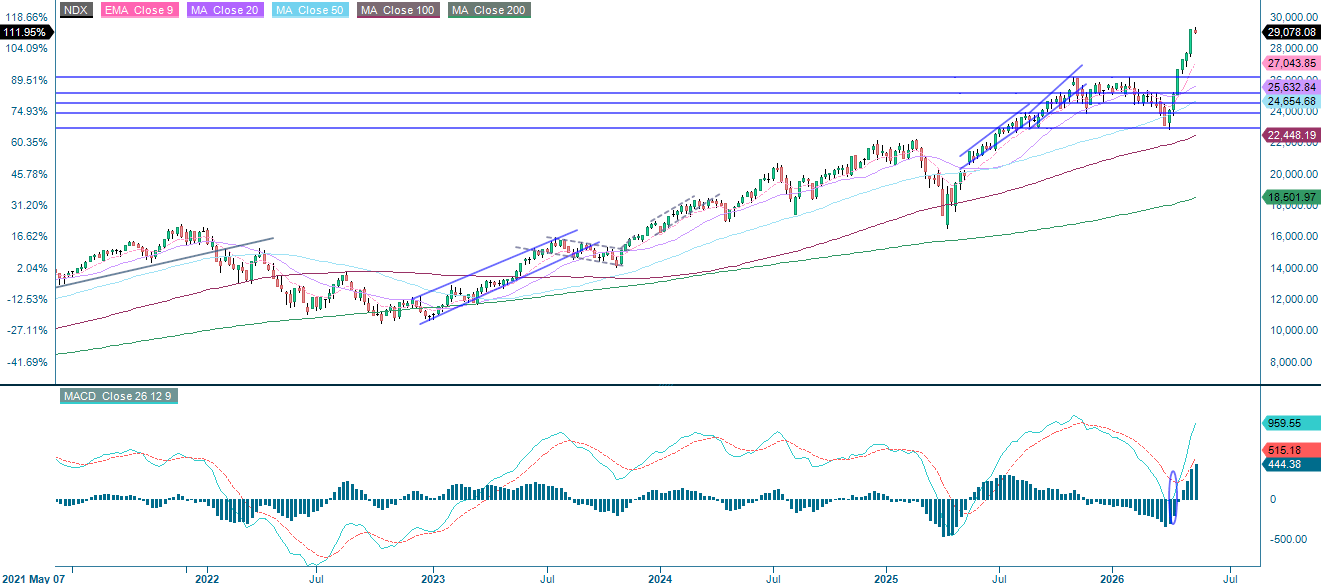
The AI spending boom remained the dominant theme of the period. Nvidia reached a new high, driven by unrelenting investment in AI across the chip sector, which reinforced the NASDAQ-100's position as the favoured means of accessing AI on Wall Street. On Monday, there was a slight pullback in hyperscalers and chip stocks, but the broader picture remains intact. As with the S&P 500, the NASDAQ-100 continues to trade at stretched levels, deemed overbought by most technical measures, yet supported by earnings and structural tailwinds that have so far proven hard to dispute.
Related Products
NASDAQ-100 (in USD), one-year daily chart
NASDAQ-100 (in USD), five-year weekly chart
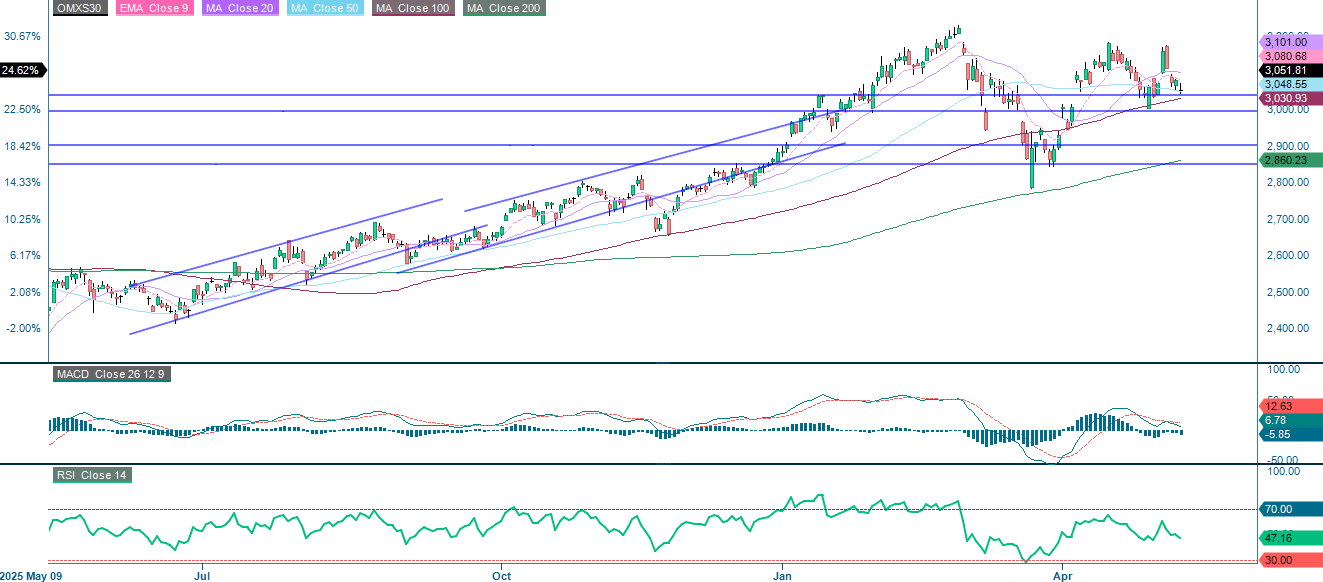
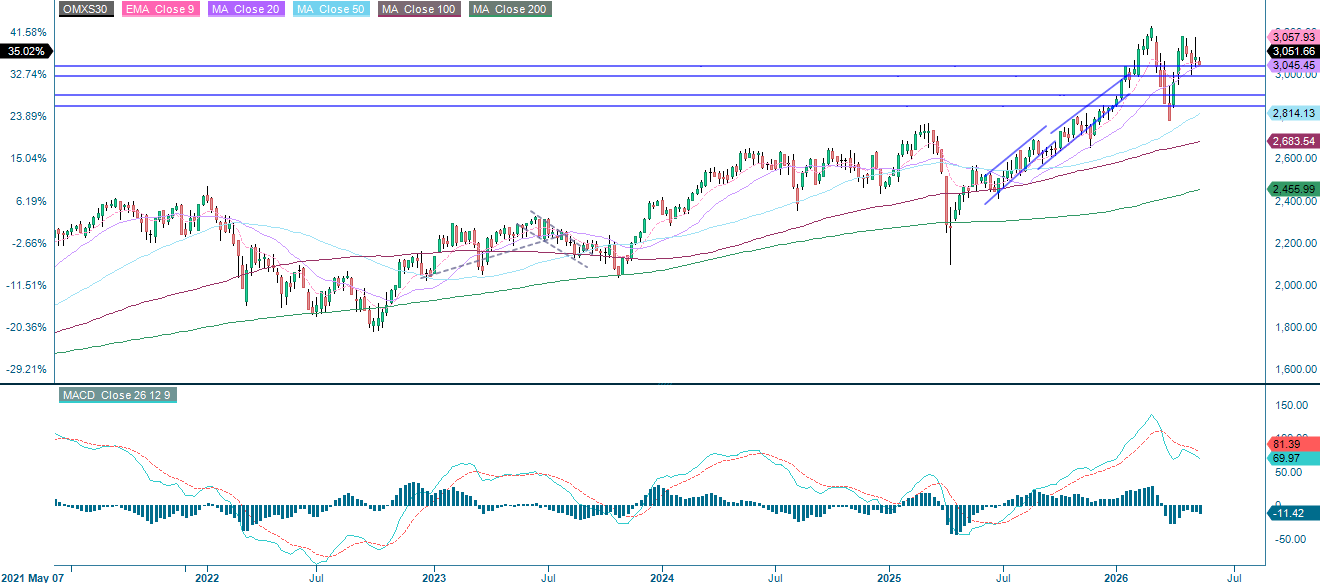
In the absence of clear AI exposure, the OMXS30 has faced consistent challenges and is currently trading close to the support level of 3,000. A clean break to the downside would expose the 2,925 level.
Related Products
OMX30 (in SEK), one-year daily chart
OMX30 (in SEK), five-year weekly chart
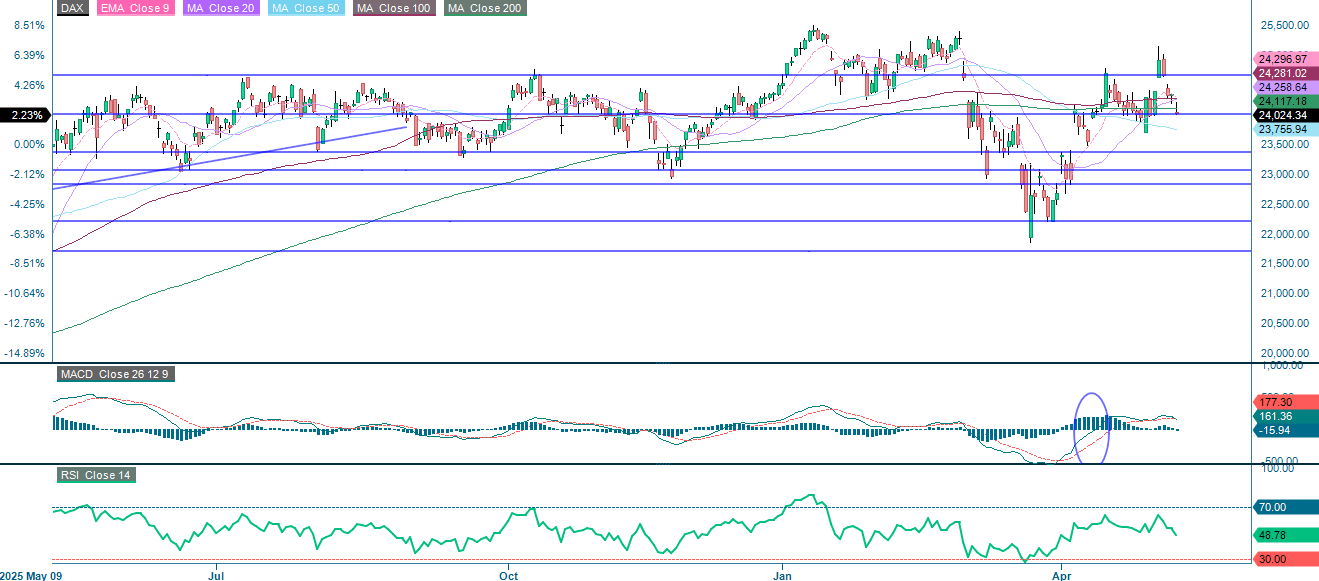
Meanwhile, Germany’s DAX closed above the 100-day moving average (MA100) yesterday, with the next upside level around 24,665. A long DAX and short S&P 500 trade continues to look appealing.
Related Products
DAX (in EUR), one-year daily chart
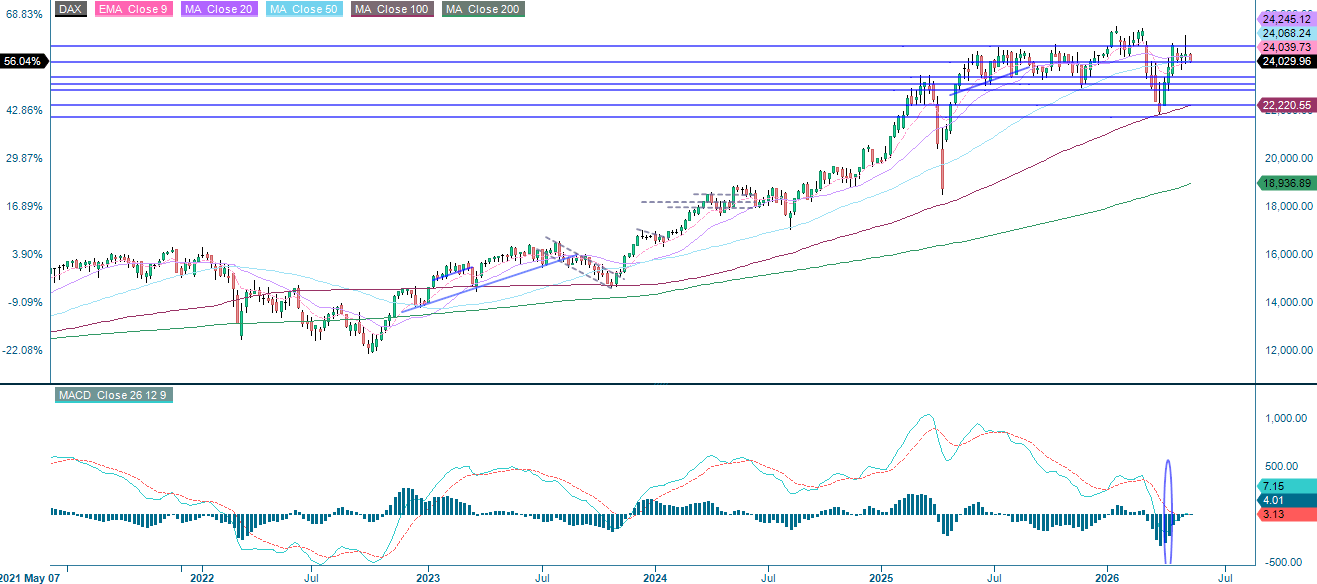
DAX (in EUR), five-year weekly chart
The full name for abbreviations used in the previous text:
EMA 9: 9-day exponential moving average
Fibonacci: There are several Fibonacci lines used in technical analysis. Fibonacci numbers are a sequence in which each successive number is the sum of the two previous numbers.
MA20: 20-day moving average
MA50: 50-day moving average
MA100: 100-day moving average
MA200: 200-day moving average
MACD: Moving average convergence divergence
Risks
Credit risk of the issuer:
Investors in the products are exposed to the risk that the Issuer or the Guarantor may not be able to meet its obligations under the products. A total loss of the invested capital is possible. The products are not subject to any deposit protection.
Currency risk:
If the product currency differs from the currency of the underlying asset, the value of a product will also depend on the exchange rate between the respective currencies. As a result, the value of a product can fluctuate significantly.
Market risk:
The value of the products can fall significantly below the purchase price due to changes in market factors, especially if the value of the underlying asset falls. The products are not capital-protected
Product costs:
Product and possible financing costs reduce the value of the products.
Risk with leverage products:
Due to the leverage effect, there is an increased risk of loss (risk of total loss) with leverage products, e.g. Bull & Bear Certificates, Warrants and Mini Futures.
External author:
This information is in the sole responsibility of the guest author and does not necessarily represent the opinion of Bank Vontobel Europe AG or any other company of the Vontobel Group. This information is sponsored by Bank Vontobel Europe AG, which may be a counterparty to transactions involving the financial instruments discussed in this information. The further development of the index or a company as well as its share price depends on a large number of company-, group- and sector-specific as well as economic factors. When forming his investment decision, each investor must take into account the risk of price losses. Please note that investing in these products will not generate ongoing income.
The products are not capital protected, in the worst case a total loss of the invested capital is possible. In the event of insolvency of the issuer and the guarantor, the investor bears the risk of a total loss of his investment. In any case, investors should note that past performance and / or analysts' opinions are no adequate indicator of future performance. The performance of the underlyings depends on a variety of economic, entrepreneurial and political factors that should be taken into account in the formation of a market expectation.
Disclaimer:
This information is neither an investment advice nor an investment or investment strategy recommendation, but advertisement. The complete information on the products (securities) mentioned herein, in particular the structure and risks associated with an investment, are described in the base prospectus, together with any supplements, as well as the final terms relating to the securities. The base prospectus and final terms constitute the solely binding sales documents for the products mentioned herein. It is recommended that potential investors read these documents before making any investment decision. The documents and the key information document are published on the website of the issuer, Vontobel Financial Products GmbH, Bockenheimer Landstrasse 24, 60323 Frankfurt am Main, Germany, on https://prospectus.vontobel.com and are available from the issuer free of charge. The approval of the prospectus should not be understood as an endorsement of the securities. The securities are products that are not simple and may be difficult to understand. This information includes or relates to figures of past performance. Past performance is not a reliable indicator of future performance. This information may only be distributed or published in countries where such distribution or publication is permitted by applicable law. As stated in the relevant base prospectus, the distribution of the securities mentioned in this information is subject to restrictions in certain jurisdictions. This advertisement may not be reproduced or redistributed without prior permission by Vontobel.
© Bank Vontobel Europe AG and / or affiliated companies. All rights reserved.