Strong Q1 2026 earnings growth for the S&P500


Salesforce seems to be a promising investment opportunity. Its valuation is appealing following the recent decline in its share price. The company also relies on growth in its AI solutions. Earnings in the S&P 500 grew by a record-breaking 27% in the first quarter of 2026, marking the highest level of earnings growth since the fourth quarter of 2021. This week, investors will also watching at the U.S. nonfarm payroll report for April, which will be published on Friday, May 8.
Case of the week: Salesforce sent the agents to work and cashed the cheque
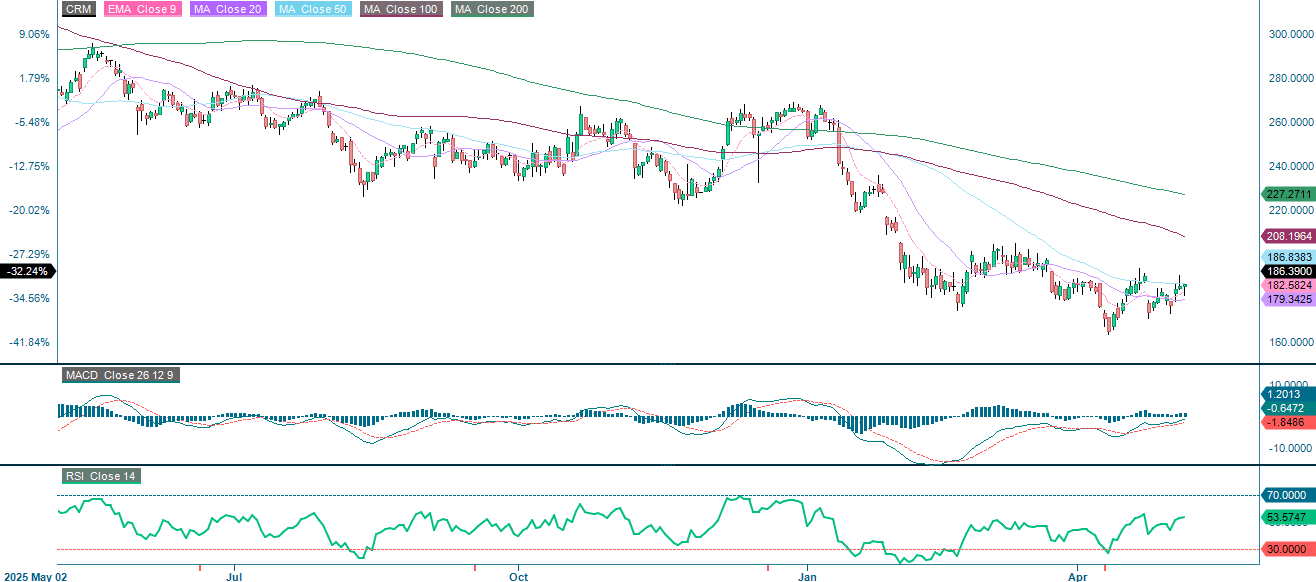
Salesforce has reached a genuine inflection point in its evolution, transitioning from a seat-based software vendor to become a leading commercial platform for enterprise AI. Agentforce, which deploys autonomous AI agents across sales, service and marketing functions, has now left its infancy behind. With $800m in ARR as of Q4 FY2026 — up 169% year on year — and 2.4 billion discrete AI work units delivered since launch, enterprise customers are now conducting live operations through the platform rather than just conducting trials.
The monetization model remains structurally sound. Salesforce earns revenue across three layers: per-conversation usage fees, outcome-based charges tied to results, such as the number of support tickets resolved, and traditional subscription fees for core platform access. The company benefits whether customers are increasing their workforce or replacing it with automation, a rare quality in the current AI market. This commercial durability is evident in the figures: a full-year non-GAAP operating margin of 34.1%, a $50 billion share buyback programme and a quarterly dividend of $0.44 per share, representing a 5.8% year-on-year increase. This is a business that has scaled its AI ambitions without losing financial discipline.
Today, the investment case relies as much on valuation as on growth. Despite achieving a record-high full-year revenue of $41.5 billion, the stock price has declined. This creates an opportunity to invest in a blue-chip franchise with expanding margins, recurring revenue and a strong position in the enterprise AI monetization. For investors willing to overlook at past short-term fluctuations, the risk/reward ratio is appealing.
Related Products
Salesforce Inc (in USD), one-year daily chart
Salesforce Inc (in USD), five-year weekly chart

Macro comments
As of Friday, May 1, 63% of all S&P 500 companies had reported their first-quarter 2026 results. According to Earnings Insight, 84% of these companies had positive earnings surprises, and 81% had positive revenue surprises. The earnings growth rate for S&P 500 companies in Q1 2026 is 27%, the highest rate since Q4 2021.
By Thursday, 30 April, 80 OMX companies had reported their first quarter 2026 results. Of these, 55% exceeded earnings expectations, down from 64% the previous week. Meanwhile, only 41% of companies exceeded revenue expectations, compared to 43% the previous week. The reports were more positive with regard to order intake: four out of seven companies (57%) reported stronger order intake than analysts had estimated prior to the reports.
On Wednesday 6 May, interim reports from Norwegian companies Equinor, Kongsberg and Ørsted, as well as Danish companies Novo Nordisk, Sydbank and Vestas are expected. In Germany, companies submitting quarterly reports include BMW, Continental, Daimler Truck, Klöckner and Zalando, as well as the Dutch company Philips. In the US, companies reporting their quarterly results include Snap, Timken, Walt Disney and Whirlpool. Turning to macroeconmic news, Wednesday's focus is on the services purchasing managers' index for April from China, Sweden, Italy, Spain, France, Germany, the Eurozone and the UK. Sweden will also release its CPI figure for April. The US will release figures on private employment in April and weekly oil inventories from the Department of Energy.
On Thursday 7 May, quarterly reports from Swedish companies Hufvudstaden, Loomis, Meko and Skanska, Finnish company Stora Enso, Norwegian companies Aker BP, DNO and Veidekke, and Danish companies Genmab, GN Store Nord, Maersk and Zealand Pharma will be released. Among the German companies reporting are Rheinmetall, and in the US, McDonald's. The Swedish company Essity is organising a capital markets day. The macroeconomic news agenda begins with Germany's industrial orders in March. The Swedish Riksbank and the Norwegian central bank, Norges Bank, will each release their interest rate announcements. We will also receive Eurozone retail sales figures for March. From the US, we will receive Challenger job cut statistics and weekly initial jobless claims data.
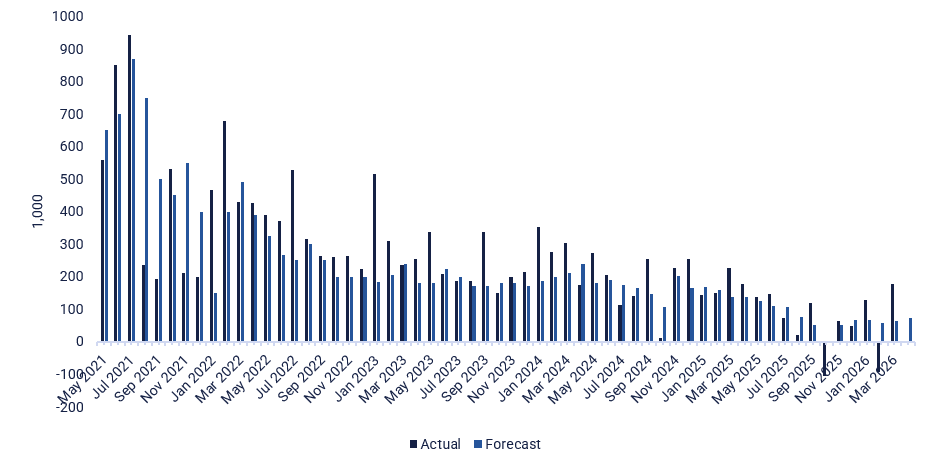
On Friday 8 May, Swedish real estate companies Balder and Sagax will publish their first quarter reports for 2026. Interim reports will also be released by the German bank Commerzbank, andthe Japanese companies Nintendo and Toyota. Friday's macroeconomic news agenda begins with Japan's services purchasing managers' index for April. Next, Germany's industrial production and trade balance for March will be examined. Turning to the US, the most important figure of the week is the non-farm payrolls report for April, for which the consensus expectation is 73,000 new jobs (see graph below). However, the US will also release the Michigan Index for May and wholesale inventories for March.
US non-farm payrolls (1,000 new jobs), May 2021-April 2026
A long DAX and short S&P 500 spread has potential
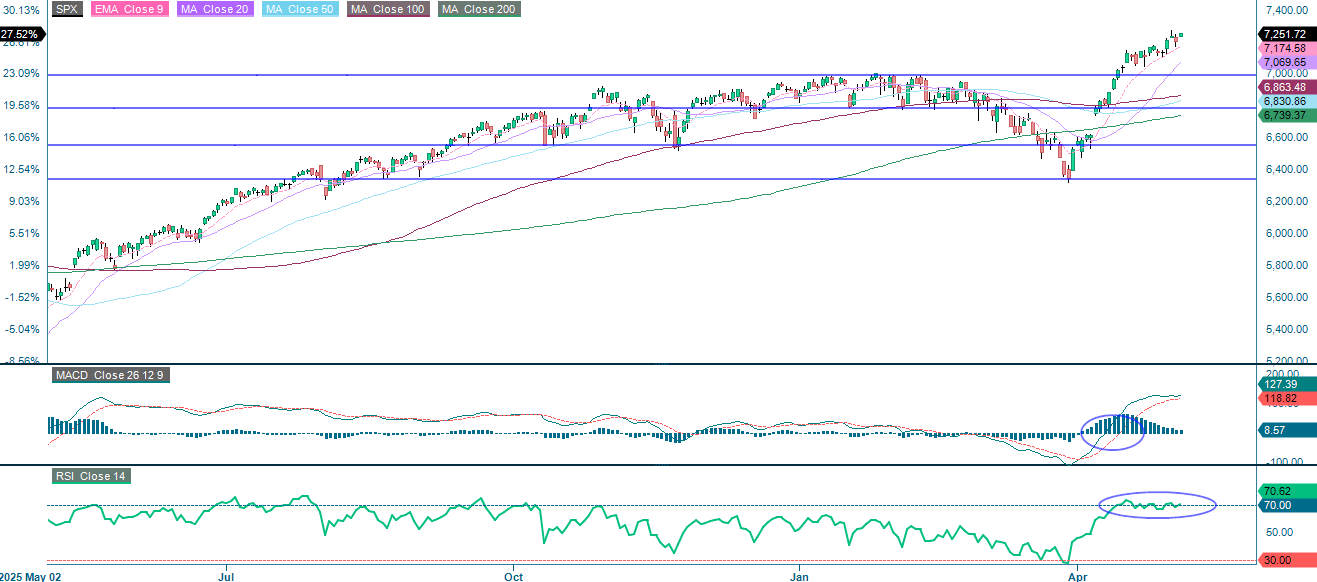
Of the S&P 500 companies that have reported Q1 2026 results, approximately 90% have beaten EPS estimates. This is the highest beat rate since Q4 2021. This widespread earnings strength has clearly driven the recent rally. However, as the chart below shows, RSI remains in overbought territory. This is not a sell signal in isolation, but it does indicate where sentiment stands. EMA9, followed by MA20, serves as support on the downside. A break below the 7,000 level comes into play.
Related Products
S&P 500 (in USD), one-year daily chart
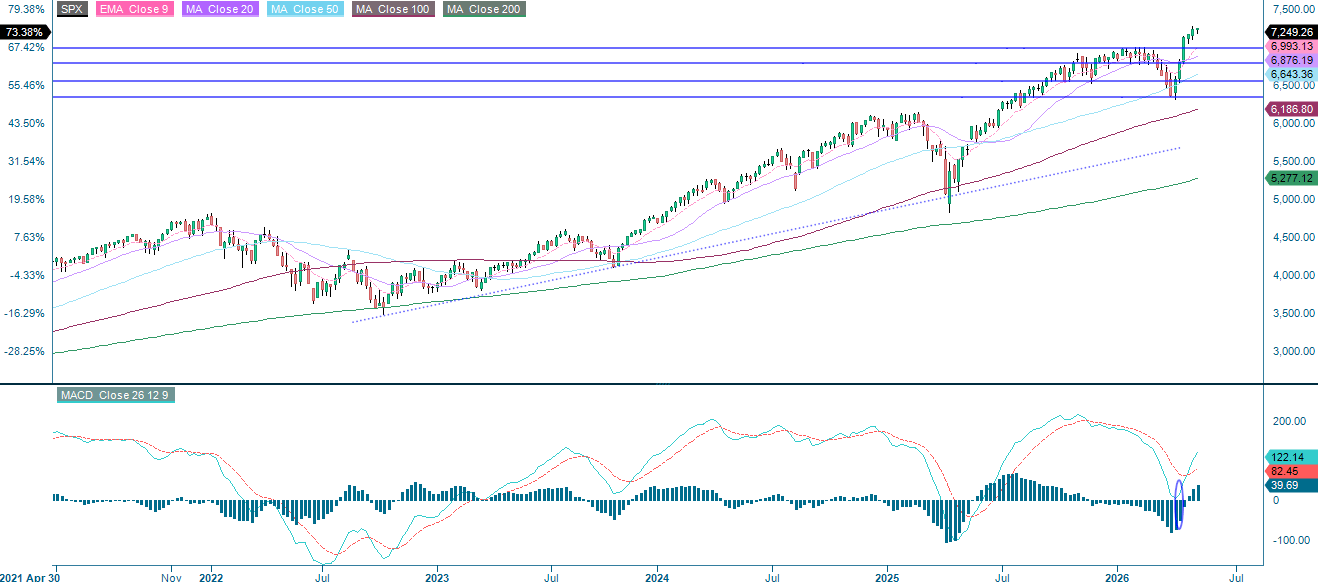
S&P 500 (in USD), five-year weekly chart
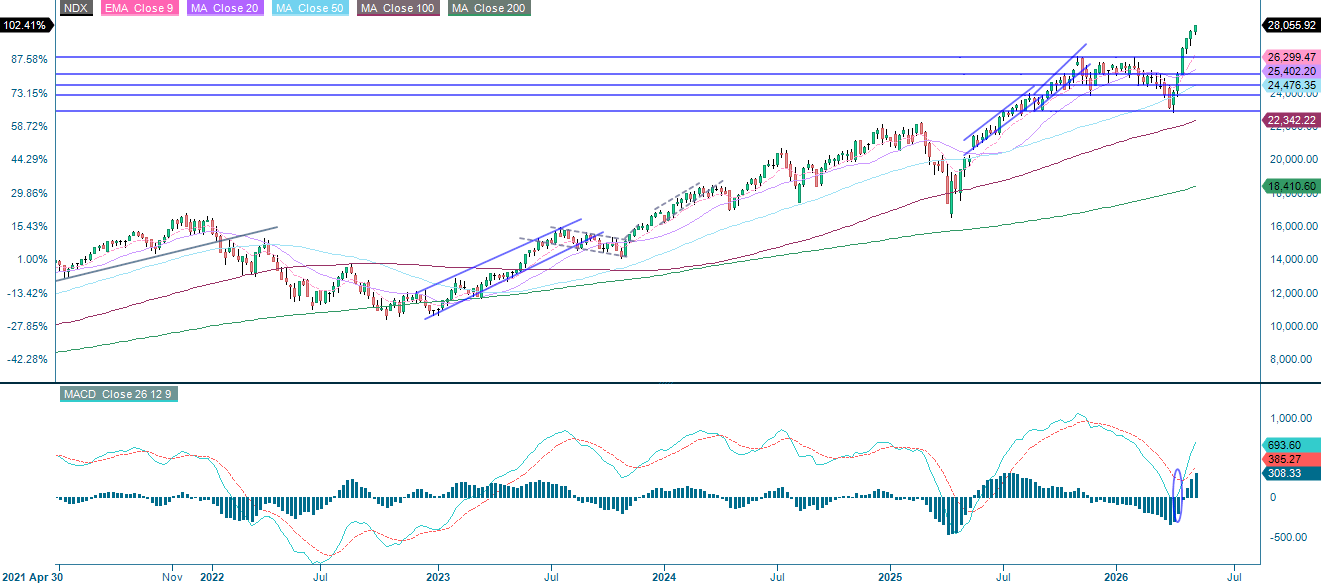
Strong first-quarter results from major constituents, including Amazon and Alphabet, were the primary catalyst that lifted the tech-heavy index and set it on track for its fifth consecutive weekly gain. Once again, the RSI is in overbought territory, while the EMA9 and MA20 serve as support levels on the downside.
Related Products
NASDAQ-100 (in USD), one-year daily chart

NASDAQ-100 (in USD), five-year weekly chart
The Middle East conflict and elevated oil prices sparked a widespread risk-off movement, pushing the export-oriented OMXS30 index downward. The MA100 is holding as support on the downside, though the MA20 still needs to be reclaimed. Breaking above that level would open the door to a retest of previous highs.
Related Products
OMX30 (in SEK), one-year daily chart
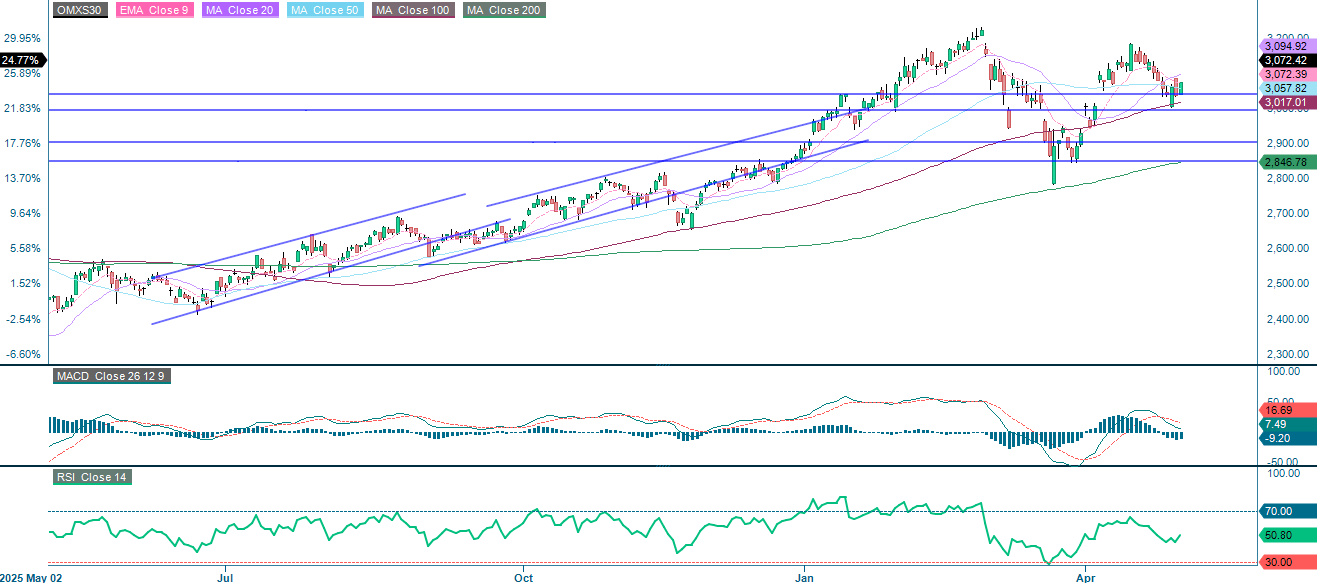
OMX30 (in SEK), five-year weekly chart

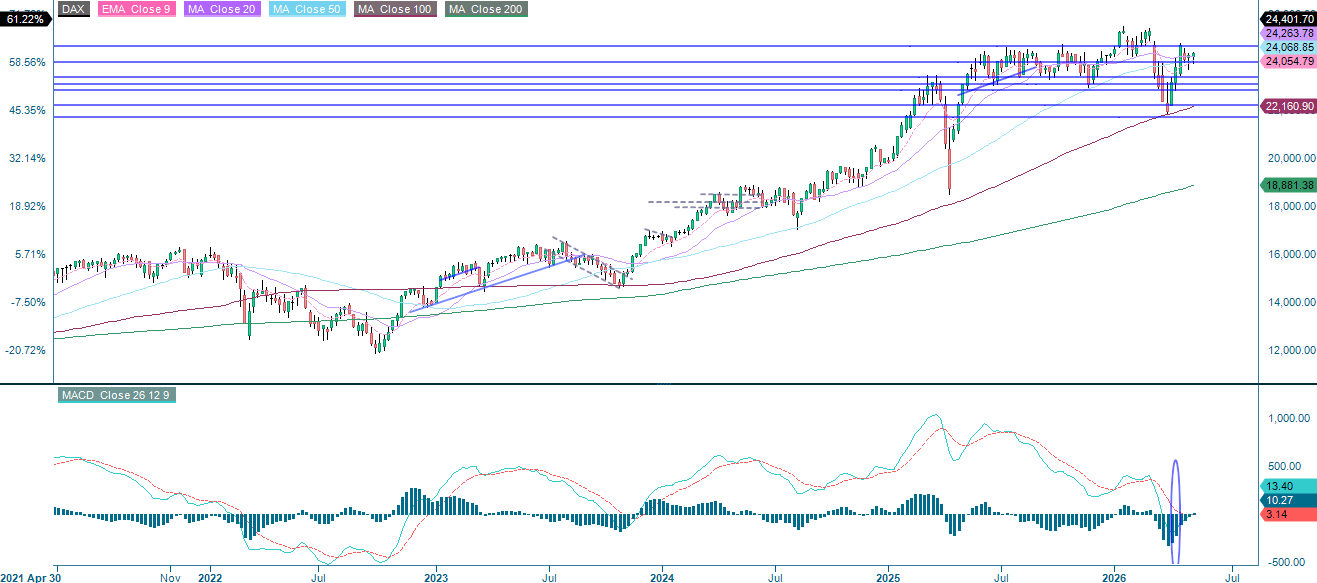
Meanwhile, the DAX in Germany closed above MA100 yesterday, and the next upside level is around 24,665. A long DAX and short S&P 500 trade still seems attractive.
Related Products
DAX (in EUR), one-year daily chart
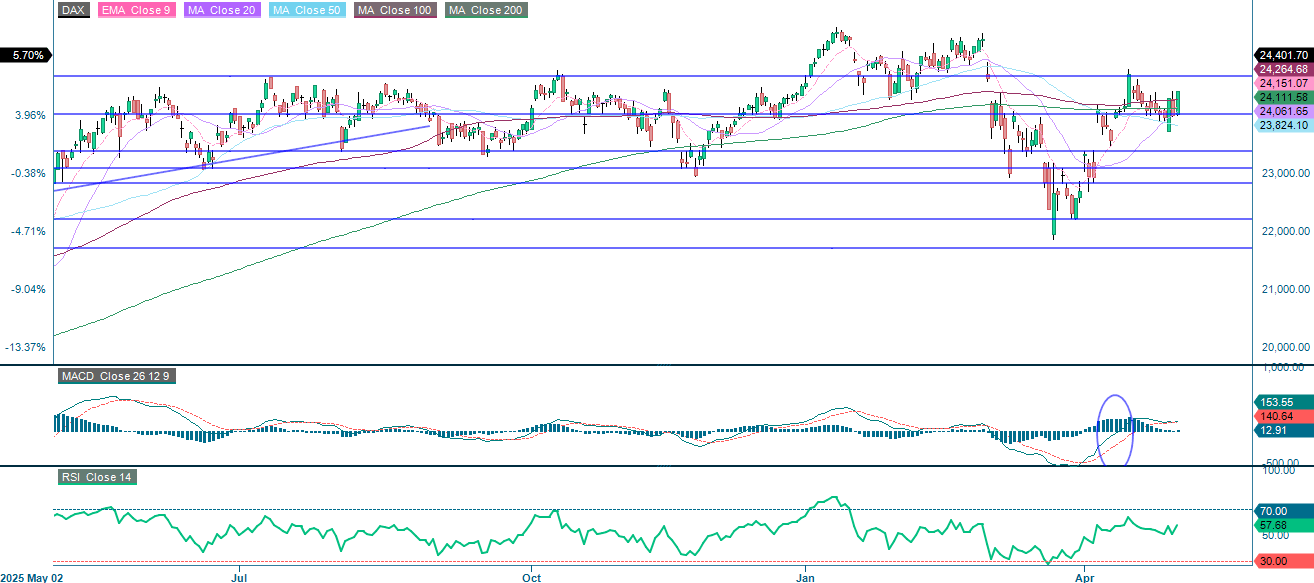
DAX (in EUR), five-year weekly chart
The full name for abbreviations used in the previous text:
EMA 9: 9-day exponential moving average
Fibonacci: There are several Fibonacci lines used in technical analysis. Fibonacci numbers are a sequence in which each successive number is the sum of the two previous numbers.
MA20: 20-day moving average
MA50: 50-day moving average
MA100: 100-day moving average
MA200: 200-day moving average
MACD: Moving average convergence divergence
Risks
Credit risk of the issuer:
Investors in the products are exposed to the risk that the Issuer or the Guarantor may not be able to meet its obligations under the products. A total loss of the invested capital is possible. The products are not subject to any deposit protection.
Currency risk:
If the product currency differs from the currency of the underlying asset, the value of a product will also depend on the exchange rate between the respective currencies. As a result, the value of a product can fluctuate significantly.
Market risk:
The value of the products can fall significantly below the purchase price due to changes in market factors, especially if the value of the underlying asset falls. The products are not capital-protected
Product costs:
Product and possible financing costs reduce the value of the products.
Risk with leverage products:
Due to the leverage effect, there is an increased risk of loss (risk of total loss) with leverage products, e.g. Bull & Bear Certificates, Warrants and Mini Futures.
External author:
This information is in the sole responsibility of the guest author and does not necessarily represent the opinion of Bank Vontobel Europe AG or any other company of the Vontobel Group. This information is sponsored by Bank Vontobel Europe AG, which may be a counterparty to transactions involving the financial instruments discussed in this information. The further development of the index or a company as well as its share price depends on a large number of company-, group- and sector-specific as well as economic factors. When forming his investment decision, each investor must take into account the risk of price losses. Please note that investing in these products will not generate ongoing income.
The products are not capital protected, in the worst case a total loss of the invested capital is possible. In the event of insolvency of the issuer and the guarantor, the investor bears the risk of a total loss of his investment. In any case, investors should note that past performance and / or analysts' opinions are no adequate indicator of future performance. The performance of the underlyings depends on a variety of economic, entrepreneurial and political factors that should be taken into account in the formation of a market expectation.
Disclaimer:
This information is neither an investment advice nor an investment or investment strategy recommendation, but advertisement. The complete information on the products (securities) mentioned herein, in particular the structure and risks associated with an investment, are described in the base prospectus, together with any supplements, as well as the final terms relating to the securities. The base prospectus and final terms constitute the solely binding sales documents for the products mentioned herein. It is recommended that potential investors read these documents before making any investment decision. The documents and the key information document are published on the website of the issuer, Vontobel Financial Products GmbH, Bockenheimer Landstrasse 24, 60323 Frankfurt am Main, Germany, on https://prospectus.vontobel.com and are available from the issuer free of charge. The approval of the prospectus should not be understood as an endorsement of the securities. The securities are products that are not simple and may be difficult to understand. This information includes or relates to figures of past performance. Past performance is not a reliable indicator of future performance. This information may only be distributed or published in countries where such distribution or publication is permitted by applicable law. As stated in the relevant base prospectus, the distribution of the securities mentioned in this information is subject to restrictions in certain jurisdictions. This advertisement may not be reproduced or redistributed without prior permission by Vontobel.
© Bank Vontobel Europe AG and / or affiliated companies. All rights reserved.