Market sentiment has improved


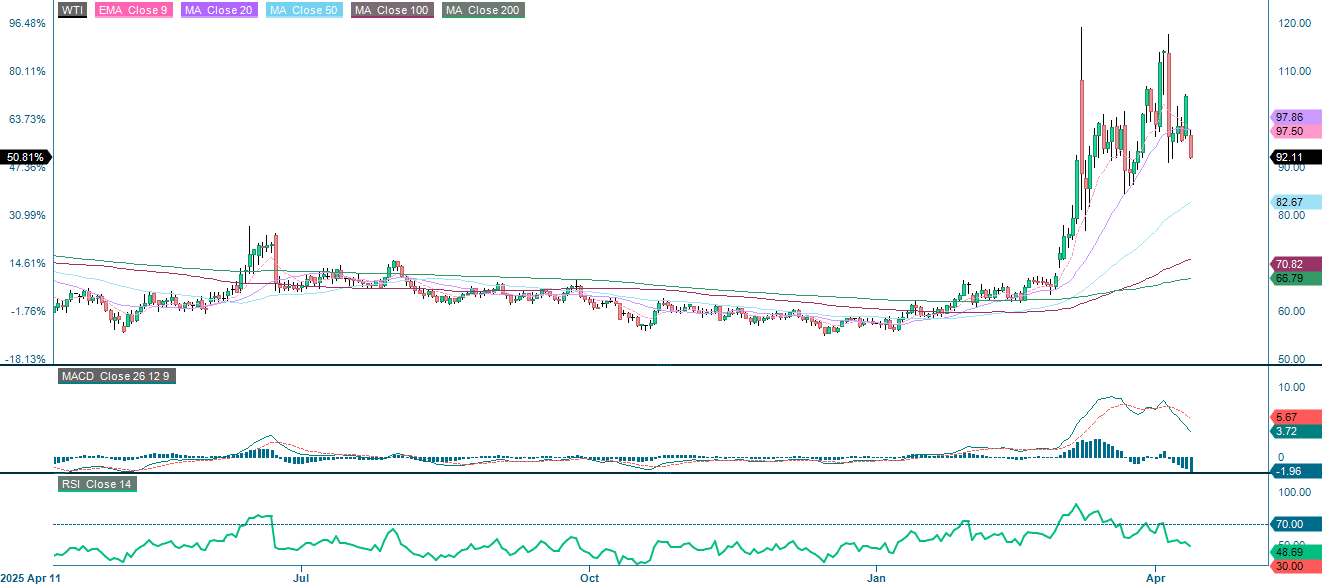
This week's case concerns WTI oil. The conflict in Iran has knocked out about 8% of the global oil supply. Add to that the attacks on Russian oil-producing facilities in Ukraine, and the United States could emerge as a winner in this dimension of the conflict. Sentiment in the stock market has turned more positive, as evidenced by the decline in the VIX.
Case of the week: Take advantage of the dip in the WTI oil price
In mid-April 2026, WTI oil prices increased by around 60% as the closure of the Strait of Hormuz knocked out 7.9 million barrels per day (bpd) of OPEC+ supply in March, which is about 7.7% of global consumption. This is the largest involuntary disruption since 1973.
The United States and Canada are the only major oil- and gas-exporting countries whose facilities have not been damaged by war. Recently, Ukraine's military caused significant damage to Russian oil production facilities in the Baltic Sea. This damage is estimated to account for additional 2% of the global oil supply.
The bull case for WTI oil boils down to an unbridgeable gap. Saudi pipeline workarounds fall well short of the lost seaborne volumes. Refinery runs increase seasonally through May, adding 1.5–2.0 million barrels per day (bpd) of demand on top of the deficit. A weaker Us dollar helps non-U.S. buyers. Inventories were already below the five-year average prior to the crisis. Meanwhile, WTI dipped on ceasefire headlines last week, yet it has increased since late February. The market does not believe that diplomacy can resolve the physical shortfall.
Today’s EIA inventory data will show if U.S. stocks are falling quickly enough to confirm the global deficit, which could trigger a rise in WTI oil prices. Another potential trigger is the Islamabad talks. A credible framework for reopening the Strait would quickly deflate the geopolitical premium.
Related Products
WTI oil spot (USD per barrel), one-year daily chart
WTI oil spot (USD per barrel), five-year weekly chart

Macro comments
On Wednesday morning 8 April (Central European Time), the deadline for President Trump's threat against Iran expired. Shortly thereafter, it was then announced that the United States and Iran had agreed to a two-week ceasefire. Initially, stock markets (especially in Asia and Europe) surged upon hearing the news. However, optimism waned when Iran attempted to close the Strait of Hormuz less than a day after opening it. This occured because Israel violated Iran’s tenth ceasefire demand by attacking Hezbollah in Lebanon. Pessimists were vindicated when the American delegation, led by Vice President Vance, returned home on Saturday, 11 April, after 20 hours of unsuccessful peace talks in Islamabad, Pakistan. However, new peace talks seem to be on the horizon. After all, neither the United States nor Iran can afford a long war. The VIX (see chart below) appears to reflect investors' hopes for a return to normal.
Related Products
VIX (USD). Five-year weekly chart

On Wednesday, April 15, interim reports from Bank of America, ASML Holding, Morgan Stanley and the Progressive in the U.S are expected. The main macroeconomic news in Europe is France's CPI for March and the Eurozone's industrial production for February. Then, from the U.S., import prices for March, the NY Empire State Manufacturing Index, and the NAHB Housing Market Index, will be released, all for April, as well as weekly oil inventory statistics from the Department of Energy and the Federal Reserve's Beige Book.
The following companies are scheduled to release interim reports on Thursday, April 16: Kinnevik (Sweden), Aker BP (Norway), Abbott Laboratories, Charles Schwab, Netflix, PepsiCo, and Prologis (all USA), as well as Taiwan Semiconductor (Taiwan). Turning to the macro agenda, we start with Japan's machinery orders in February. This is followed by Chinese house prices, GDP for Q1, industrial production, retail sales, unemployment and fixed investment, all for March. Next are the UK's GDP and industrial production figures for February. Italy and the Eurozone will report CPI for March. The US will contribute the Philadelphia Fed Manufacturing Index for April, as well as weekly jobless claims and industrial production figures for March.
On Friday, April 17, Swedish companies Ericsson and Autoliv will report their first-quarter 2026 results. Turning to the macro statistics, the Eurozone will report its current and trade balances for February.
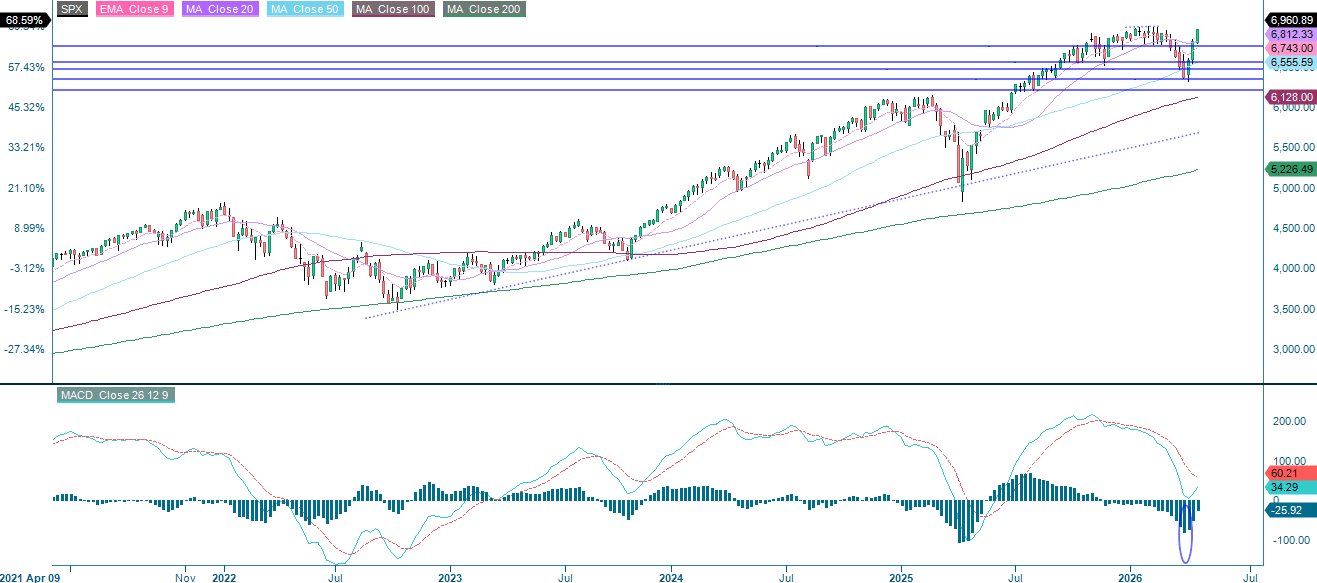
Is it time to realise some profits?
A rapid shift in Iran war sentiment has been the key driver of the S&P 500, which is currently approaching previous highs of around 7,000. Conversely, the RSI is approaching overbought levels. While this is not necessarily a sell signal, it may nevertheless be a good opportunity to realise some profits.
Related Products
S&P 500 (in USD), one-year daily chart

S&P 500 (in USD), five-year weekly chart
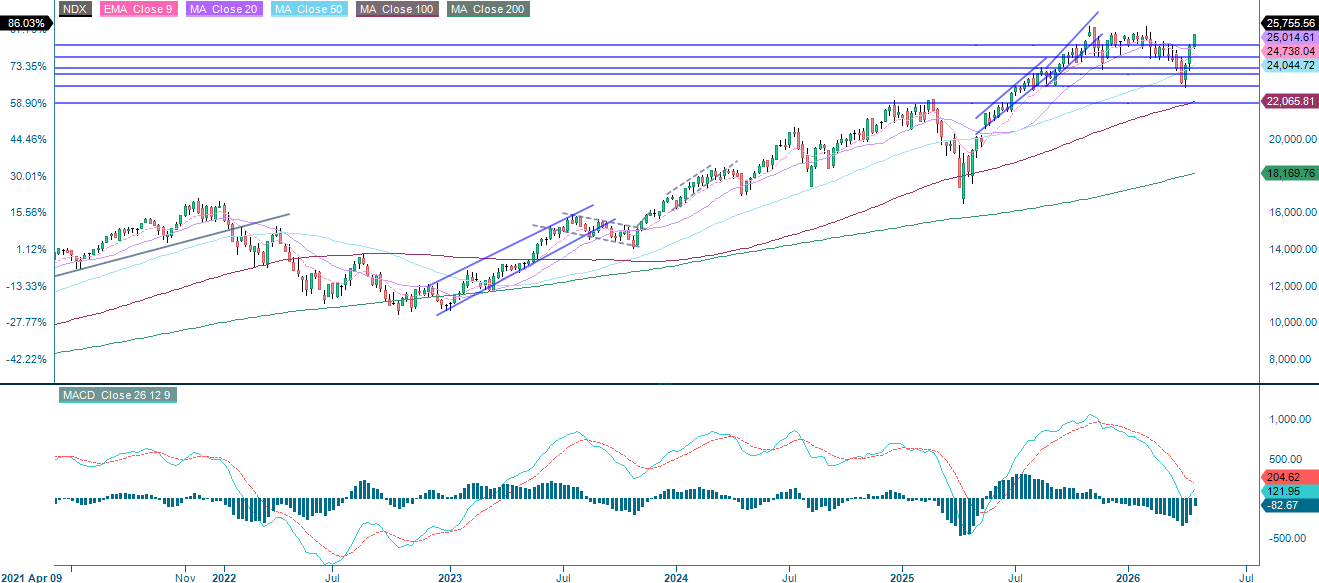
The NASDAQ-100 has once again outperformed the broader S&P 500, with previous highs of around 26,150 now within reach. However, uncertainty surrounding the Iran crisis will persist while the RSI approaches overbought levels. Now may therefore be a good time to realise some profits.
Related Products
NASDAQ-100 (in USD), one-year daily chart

NASDAQ-100 (in USD), five-year weekly chart
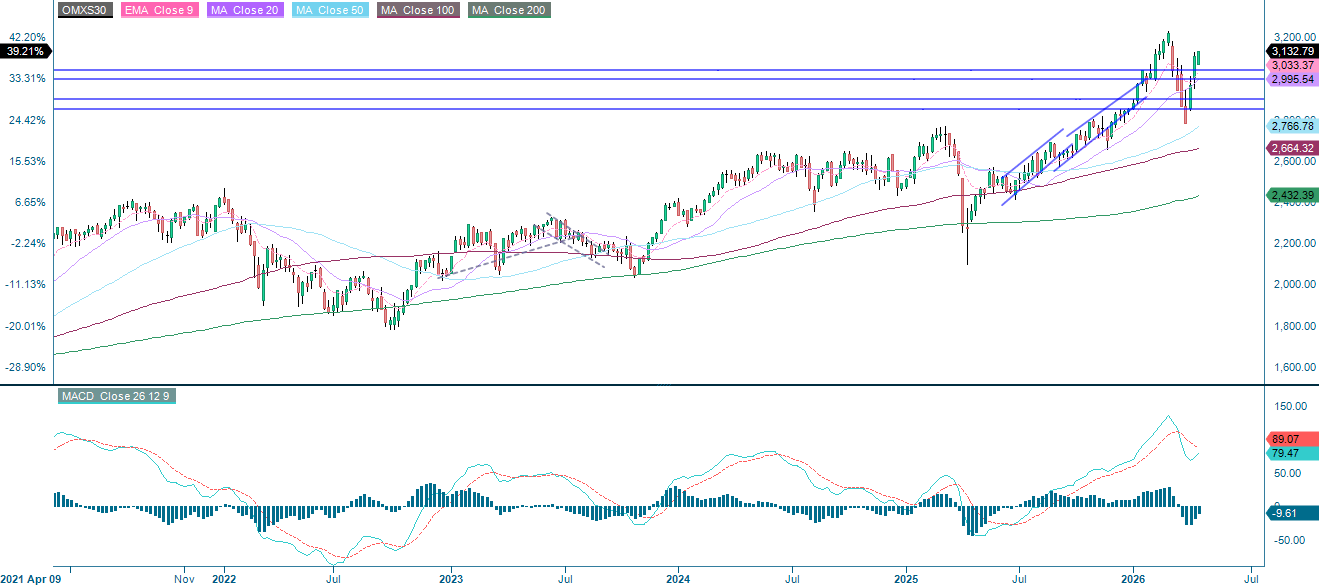
In Sweden, the OMXS30 index is currently trading above 3,000 and testing the 3,120-resistance level. Meanwhile, the MACD indicator has generated a buy signal. If general market sentiment remains positive, the next level of resistance is 3,225.
Related Products
OMX30 (in SEK), one-year daily chart

OMX30 (in SEK), five-year weekly chart
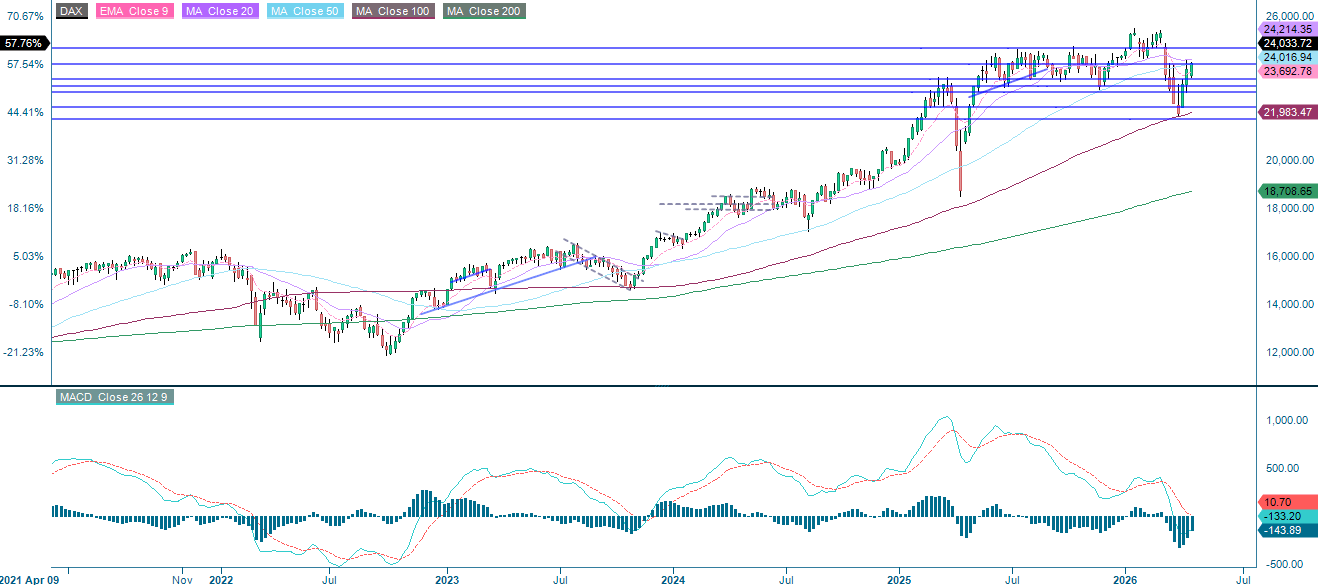
The DAX is stuck below the MA200 and MA100 and is hovering around the 24,000-resistance level. Note the MACD, which has generated a buy signal. A break above 24,665 may be next. Support on the downside lies at around 23,560 and 23,365.
Related Products
DAX (in EUR), one-year daily chart

DAX (in EUR), five-year weekly chart
The full name for abbreviations used in the previous text:
EMA 9: 9-Day Exponential Moving Average
Fibonacci: There are several Fibonacci lines used in technical analysis. Fibonacci numbers are a sequence in which each successive number is the sum of the two previous numbers.
MA20: 20-Day Moving Average
MA50: 50-Day Moving Average
MA100: 100-Day Moving Average
MA200: 200-Day Moving Average
MACD: Moving Average Convergence Divergence
Risks
Credit risk of the issuer:
Investors in the products are exposed to the risk that the Issuer or the Guarantor may not be able to meet its obligations under the products. A total loss of the invested capital is possible. The products are not subject to any deposit protection.
Currency risk:
If the product currency differs from the currency of the underlying asset, the value of a product will also depend on the exchange rate between the respective currencies. As a result, the value of a product can fluctuate significantly.
Market risk:
The value of the products can fall significantly below the purchase price due to changes in market factors, especially if the value of the underlying asset falls. The products are not capital-protected
Product costs:
Product and possible financing costs reduce the value of the products.
Risk with leverage products:
Due to the leverage effect, there is an increased risk of loss (risk of total loss) with leverage products, e.g. Bull & Bear Certificates, Warrants and Mini Futures.
External author:
This information is in the sole responsibility of the guest author and does not necessarily represent the opinion of Bank Vontobel Europe AG or any other company of the Vontobel Group. This information is sponsored by Bank Vontobel Europe AG, which may be a counterparty to transactions involving the financial instruments discussed in this information. The further development of the index or a company as well as its share price depends on a large number of company-, group- and sector-specific as well as economic factors. When forming his investment decision, each investor must take into account the risk of price losses. Please note that investing in these products will not generate ongoing income.
The products are not capital protected, in the worst case a total loss of the invested capital is possible. In the event of insolvency of the issuer and the guarantor, the investor bears the risk of a total loss of his investment. In any case, investors should note that past performance and / or analysts' opinions are no adequate indicator of future performance. The performance of the underlyings depends on a variety of economic, entrepreneurial and political factors that should be taken into account in the formation of a market expectation.
Disclaimer:
This information is neither an investment advice nor an investment or investment strategy recommendation, but advertisement. The complete information on the products (securities) mentioned herein, in particular the structure and risks associated with an investment, are described in the base prospectus, together with any supplements, as well as the final terms relating to the securities. The base prospectus and final terms constitute the solely binding sales documents for the products mentioned herein. It is recommended that potential investors read these documents before making any investment decision. The documents and the key information document are published on the website of the issuer, Vontobel Financial Products GmbH, Bockenheimer Landstrasse 24, 60323 Frankfurt am Main, Germany, on https://prospectus.vontobel.com and are available from the issuer free of charge. The approval of the prospectus should not be understood as an endorsement of the securities. The securities are products that are not simple and may be difficult to understand. This information includes or relates to figures of past performance. Past performance is not a reliable indicator of future performance. This information may only be distributed or published in countries where such distribution or publication is permitted by applicable law. As stated in the relevant base prospectus, the distribution of the securities mentioned in this information is subject to restrictions in certain jurisdictions. This advertisement may not be reproduced or redistributed without prior permission by Vontobel.
© Bank Vontobel Europe AG and / or affiliated companies. All rights reserved.