The market is discounting a longer war


This week's case is about Eli Lilly. Its lucrative weight-loss drug products are less affected by wartime cycles. Investors, meanwhile are looking for signs of de-escalation in the US-Iran military conflict before adopting a more optimistic view of the stock market.
Case of the week: Eli Lilly has reached a crossroads
Eli Lilly has established itself as a leader in the lucrative weight-loss drug market. Its flagship products, Mounjaro and Zepbound, have experienced phenomenal growth. In the fourth quarter of 2025, Lilly's revenue surged 43% to $19.3 billion, largely due to strong sales of these two drugs. Consequently, Eli Lilly has swiftly gained market share from Novo Nordisk's Ozempic and Wegovy products.
The most significant near-term catalyst for Eli Lilly's stock is likely the anticipated approval and launch of its oral glucagon-like peptide-1 (GLP-1) drug, orforglipron. The company has submitted orforglipron for regulatory approval in the U.S., Japan, and the EU for the treatment of obesity and type 2 diabetes. The FDA is expected to make a decision in the second quarter of 2026, and some reports suggest that the PDUFA date is April 10, 2026. Phase 3 trials of orforglipron have demonstrated superior glycemic control compared to oral semaglutide in head-to-head trials. Interestingly, while "Wegovy in a pill" has been a very successful launch for Novo Nordisk in the U.S., subscription data so far suggests that it has not yet cannibalized obesity injectables. Instead, the introduction of oral obesity drugs appears to have accelerated market volume growth, at least in the short term. Furthermore, the expansion of Medicare coverage for obesity drugs, expected to begin in July 2026, will increase the number of patients who can access Lilly's products, which could lead to increased revenue.
Based on the company’s current guidance of a "non-GAAP EPS in the range of $33.50 to $35.00," the price-earnings ratio for 2026E is 25 to 26 times, compared to approximately 34 times in March 2025. Although the valuation has decreased, it remains significantly higher than that of most other "Big Pharma" companies. This premium valuation, which is arguably driven by strong growth prospects relative to the sector overall, poses a potential downside risk to the stock if general market turbulence persists.
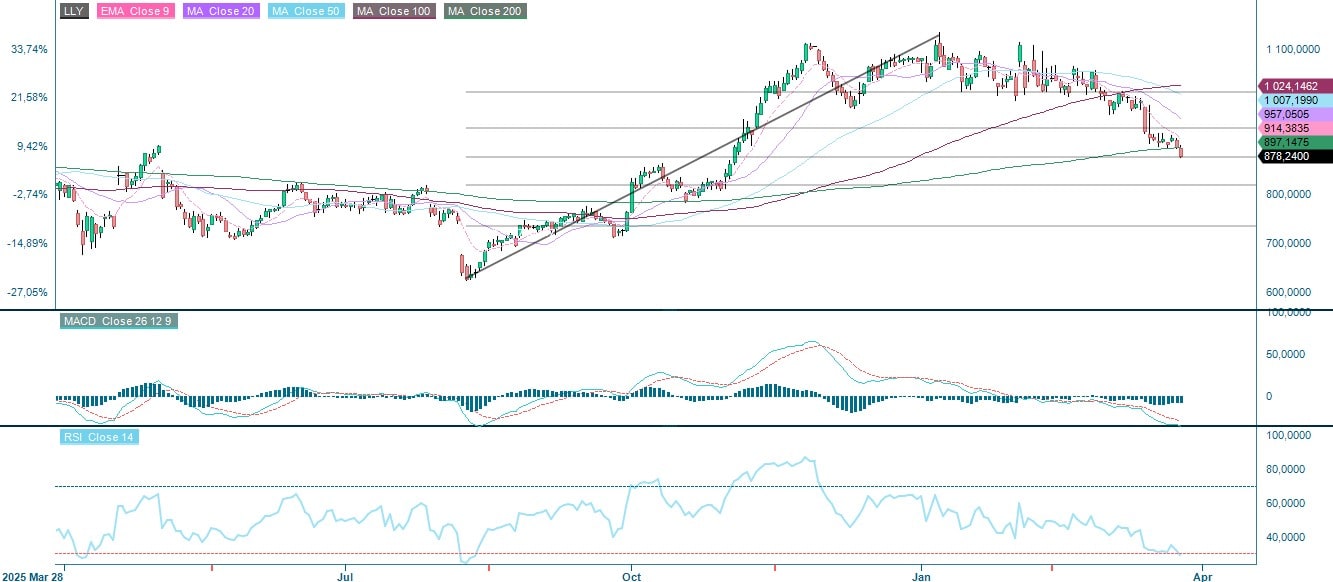
Since the 80+ percent rally between August 2025 and January 2026, the Eli Lilly share price has fallen by about half. It is currently trading slightly below the MA200 level, at just under $900 per share. This level is a crossroads for Eli Lilly. Will its shares stage a comeback, or will it embark on a negative long-term negative trend? The expected near-term news flow will likely influence its direction.
Related Products
Eli Lilly (LLY) in USD, one-year daily chart
Eli Lilly (LLY) in USD, five-year weekly chart

Macro comments
Over the past month, there has been a strong negative correlation between the stock market and the oil price. The same applies to market interest rates. We expect this situation to persist until there are clear signs of a decrease in hostilities between the United States and Iran.
On Wednesday, April 1, the macro news feed will focus on March manufacturing PMI reports from Japan, Sweden, Spain, Italy, France, Germany, the Eurozone, the United Kingdom, Brazil, and the United States. Also from the United States are the following: - ADP private employment in March, retail sales in February, business inventories in January, and weekly oil inventories from the Department of Energy.
On Thursday, April 2, Volvo Cars will release its car sales figures for March. In terms of macro reporting, the following are scheduled: the Challenger job cut statistics for March in the United States are scheduled, as well as the February trade balance and the weekly initial jobless claims data.
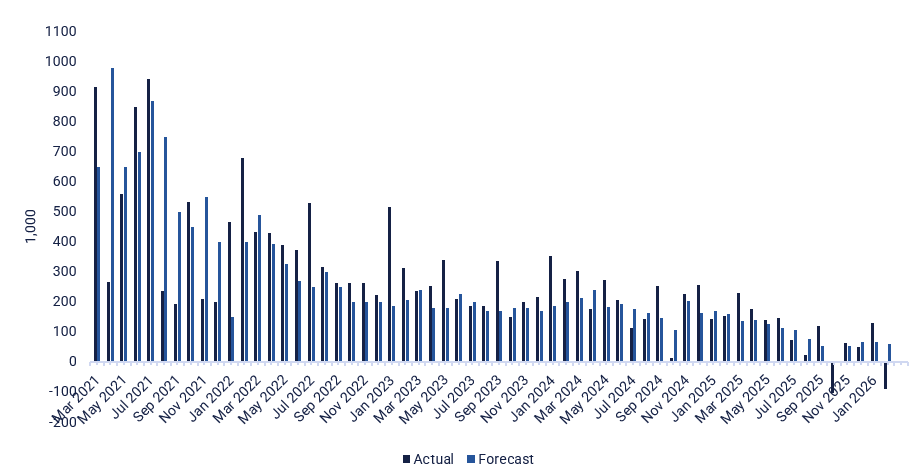
Good Friday falls on Friday, April 3 this year. It is a holiday in most European countries, as well as in Australia, Canada, Hong Kong, India, Latin America, New Zealand, Singapore, South Africa, and the United States. Some macro figures are scheduled for release this Friday, including the Service Purchasing Managers' Index for March from Japan, China, and the United States. France will publish its industrial production figures for February. The U.S. will release its nonfarm payroll figures for March (see the graph below).
U.S. Nonfarm Payrolls (Number of New Jobs) , five-year monthly chart
Signals of a de-escalation can relieve some pressure on equities
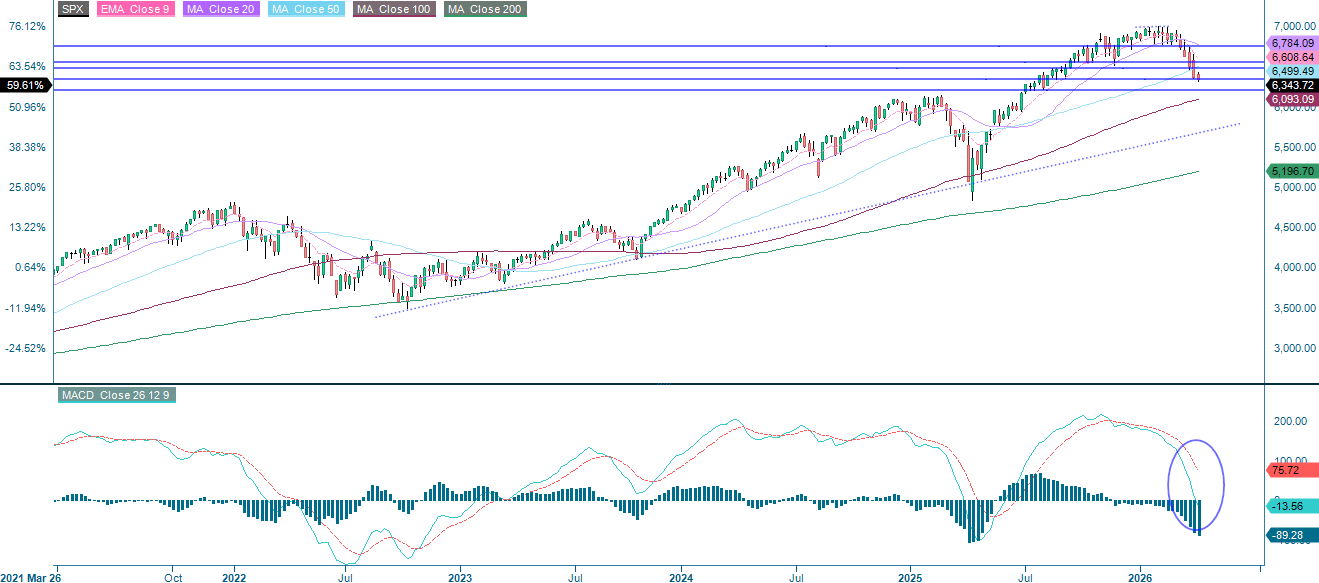
Surging oil prices due to escalating tensions between the U.S. and Iran, as well as disruptions around the Strait of Hormuz, have negatively impacted overall sentiment. As the chart below shows, the S&P 500 closed Monday's session near the 6,340 support level. The next support levels below that are 6,275 and 6,200. Oil prices have since pulled back in response to de-escalation signals of de-escalation, which should relieve some pressure on equities. The first resistance level is around 6,475.
Related Products
S&P 500 (in USD), one-year daily chart

S&P 500 (in USD), five-year weekly chart
As of Monday’s close, the NASDAQ-100 had fallen 9.1% year-to-date, compared to the S&P 500’s 7.3% decline. This underperformance reflects, in part, the sharp sell-off of semiconductors triggered by Alphabet's compute-efficiency AI research, which forced a devaluation of chip stocks. The index finished near the 22,900-support level, with the next downside levels at 22,400 and 22,000. The first level of resistance sits around 23,585.
Related Products
NASDAQ-100 (in USD), one-year daily chart

NASDAQ-100 (in USD), five-year weekly chart

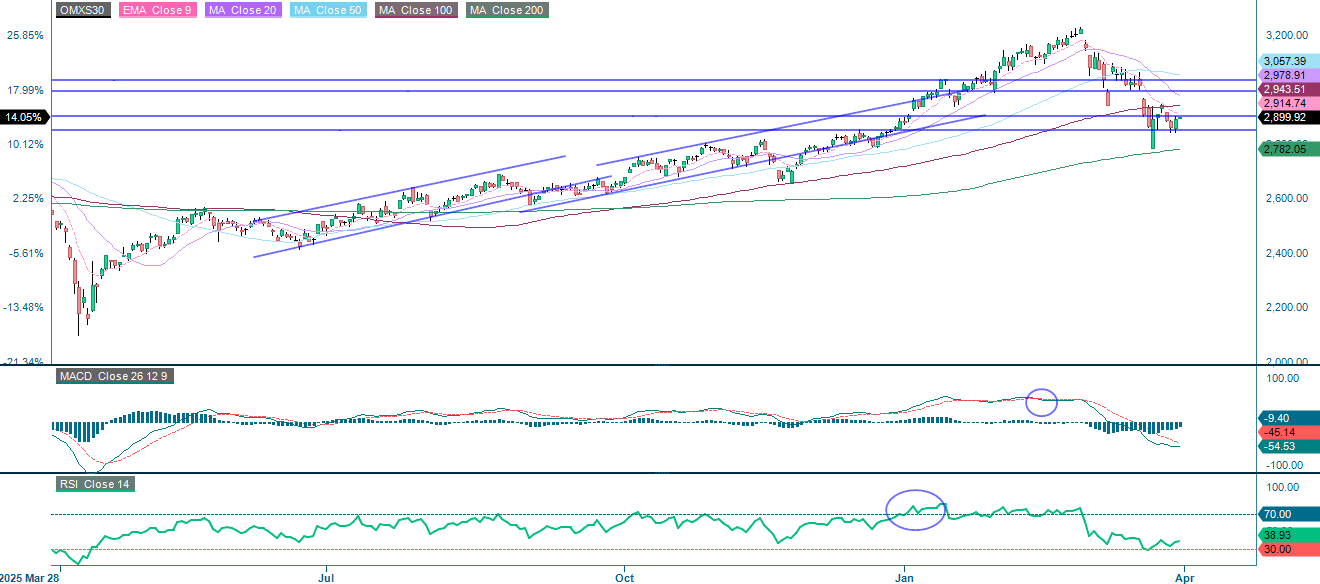
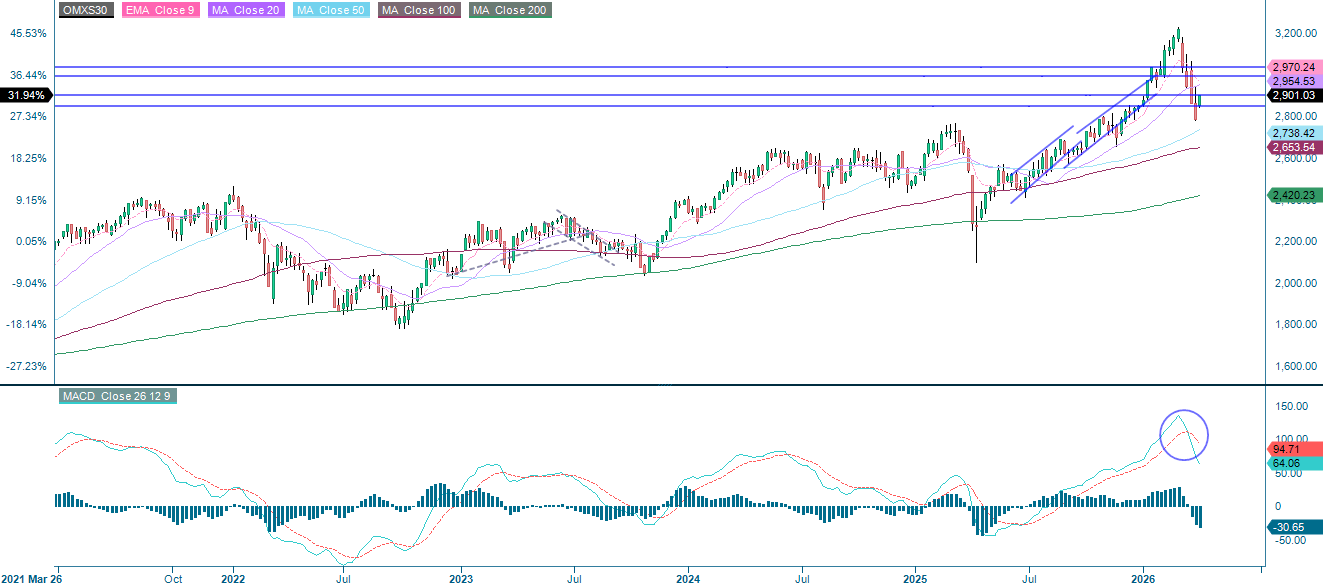
In response to de-escalation signals and falling oil prices, the OMXS30 is up 0.4%, though it is trading into resistance near 2,900. Breaking above that level would put the MA100 at 2,944 in play, with the MA20 at 2,979 as the next level.
Related Products
OMX30 (in SEK), one-year daily chart
OMX30 (in SEK), five-year weekly chart
Meanwhile, the DAX in Germany is trading down 0.3%. The index needs to recover the EMA9 level of 22,732 before the resistance level of 22,825 comes into play. Support sits at 22,200 and 21,700 on the downside.
Related Products
DAX (in EUR), one-year daily chart

DAX (in EUR), five-year weekly chart

The full name for abbreviations used in the previous text:
EMA 9: 9-day exponential moving average
Fibonacci: There are several Fibonacci lines used in technical analysis. Fibonacci numbers are a sequence in which each successive number is the sum of the two previous numbers.
MA20: 20-day moving average
MA50: 50-day moving average
MA100: 100-day moving average
MA200: 200-day moving average
MACD: Moving average convergence divergence
Risks
Credit risk of the issuer:
Investors in the products are exposed to the risk that the Issuer or the Guarantor may not be able to meet its obligations under the products. A total loss of the invested capital is possible. The products are not subject to any deposit protection.
Currency risk:
If the product currency differs from the currency of the underlying asset, the value of a product will also depend on the exchange rate between the respective currencies. As a result, the value of a product can fluctuate significantly.
Market risk:
The value of the products can fall significantly below the purchase price due to changes in market factors, especially if the value of the underlying asset falls. The products are not capital-protected
Product costs:
Product and possible financing costs reduce the value of the products.
Risk with leverage products:
Due to the leverage effect, there is an increased risk of loss (risk of total loss) with leverage products, e.g. Bull & Bear Certificates, Warrants and Mini Futures.
External author:
This information is in the sole responsibility of the guest author and does not necessarily represent the opinion of Bank Vontobel Europe AG or any other company of the Vontobel Group. This information is sponsored by Bank Vontobel Europe AG, which may be a counterparty to transactions involving the financial instruments discussed in this information. The further development of the index or a company as well as its share price depends on a large number of company-, group- and sector-specific as well as economic factors. When forming his investment decision, each investor must take into account the risk of price losses. Please note that investing in these products will not generate ongoing income.
The products are not capital protected, in the worst case a total loss of the invested capital is possible. In the event of insolvency of the issuer and the guarantor, the investor bears the risk of a total loss of his investment. In any case, investors should note that past performance and / or analysts' opinions are no adequate indicator of future performance. The performance of the underlyings depends on a variety of economic, entrepreneurial and political factors that should be taken into account in the formation of a market expectation.
Disclaimer:
This information is neither an investment advice nor an investment or investment strategy recommendation, but advertisement. The complete information on the products (securities) mentioned herein, in particular the structure and risks associated with an investment, are described in the base prospectus, together with any supplements, as well as the final terms relating to the securities. The base prospectus and final terms constitute the solely binding sales documents for the products mentioned herein. It is recommended that potential investors read these documents before making any investment decision. The documents and the key information document are published on the website of the issuer, Vontobel Financial Products GmbH, Bockenheimer Landstrasse 24, 60323 Frankfurt am Main, Germany, on https://prospectus.vontobel.com and are available from the issuer free of charge. The approval of the prospectus should not be understood as an endorsement of the securities. The securities are products that are not simple and may be difficult to understand. This information includes or relates to figures of past performance. Past performance is not a reliable indicator of future performance. This information may only be distributed or published in countries where such distribution or publication is permitted by applicable law. As stated in the relevant base prospectus, the distribution of the securities mentioned in this information is subject to restrictions in certain jurisdictions. This advertisement may not be reproduced or redistributed without prior permission by Vontobel.
© Bank Vontobel Europe AG and / or affiliated companies. All rights reserved.