Somewhat cautious stock markets


The ASML investment case is based on a compelling combination of technological irreplaceability, sustained demand, and financial strength. ASML holds a genuine monopoly on extreme ultraviolet (EUV) lithography systems that competitors cannot produce. The main risks are related to geopolitics, high valuation, and cyclicality. As of February 13, 74% of S&P companies had reported positive earnings surprises, with an average revenue growth of 9% in Q4 of 2025. From a technical perspective, the main indices are in wait-and-see mode, with some showing a tendency to soften.
Case of the week: An AI-resistant machine
ASML Holding NV is the world's only manufacturer of extreme ultraviolet (EUV) lithography systems. These machines are essential for producing the most advanced semiconductors, which power artificial intelligence (AI), data centers, and smartphones. Headquartered in the Netherlands, ASML sells approximately 40 EUV units annually at prices exceeding USD 300 million each and supplies every major chipmaker globally. ASML's technology is widely regarded as non-replicable, affording the company an unassailable monopoly over the most critical step in advanced chip manufacturing.
The investment case is based on a compelling combination of technological irreplaceability, long-term demand, and financial strength. ASML holds a genuine monopoly in extreme ultraviolet (EUV) lithography; no competitor can produce these systems. This positions the company as the sole bottleneck for all advanced chip production worldwide. The rapid expansion of AI infrastructure is generating unprecedented demand for cutting-edge semiconductors, which cannot be manufactured without ASML's equipment. This dynamic is evident in the company's record order intake and optimistic 2026 guidance. Furthermore, a backlog exceeding a year's worth of revenue provides exceptional earnings visibility, a quality uncommon among capital equipment businesses. With shares up approximately 30% year-to-date and resistance from the negative AI valuation sentiment, the market is recognizing ASML's central role as Europe's most important technology company and the linchpin of the global semiconductor supply chain.
The main risks are centered on geopolitics, valuation, and cyclicality. Given that China has been a significant end market, export restrictions targeting China could meaningfully reduce unit shipments and near-term revenue. With a Price to Earnings (P/E) NTM of 41x and a P/E 2027E of 32x, the premium valuation leaves little room for error. Any deceleration in semiconductor capital expenditure or AI spending could result in a significant decrease in the stock price.
The next major catalyst is ASML's earnings report on April 15, 2026. The report will provide investors with an update on order intake trends, backlog composition, and full-year guidance. Continued extreme ultraviolet (EUV) demand tied to artificial intelligence (AI) chip production at TSMC, Samsung, and Intel through the first half of 2026 should sustain order flow visibility. Any policy clarity on export restrictions, particularly regarding China, could cause shares to move materially in either direction over the coming months. Broader semiconductor capital expenditure (capex) guidance from major foundry customers during their first quarter earnings will serve as a readthrough for ASML's medium-term demand outlook.
ASML (EUR), one-year daily chart
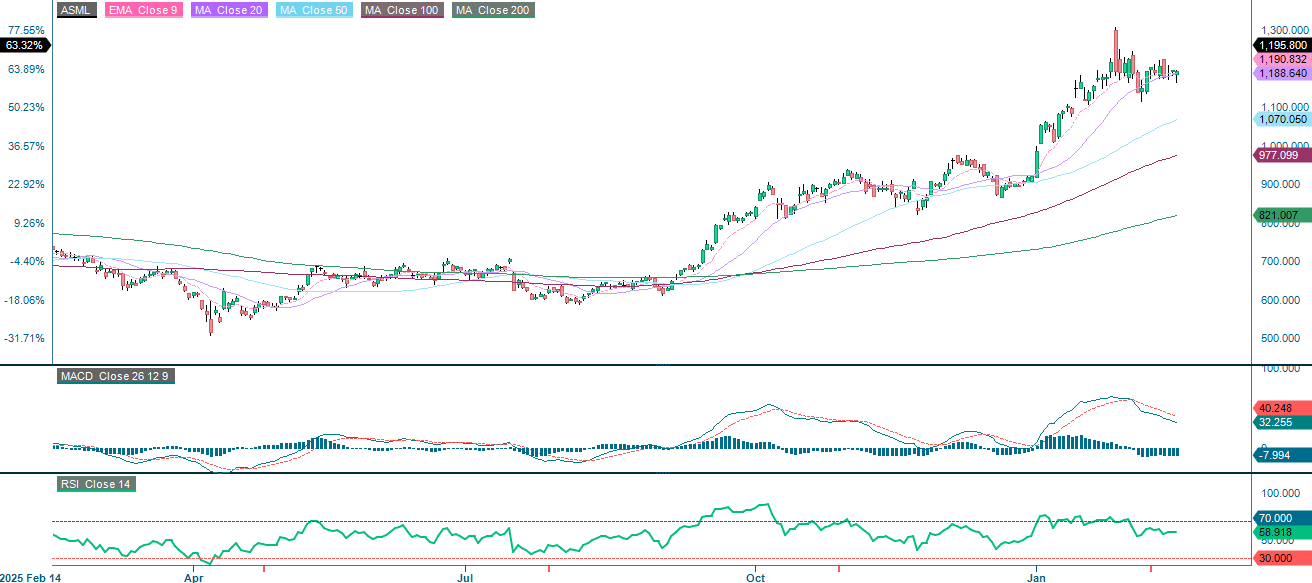
ASML (EUR), five-year weekly chart

Macro comments
Investors currently seem to be somewhat cautious. This is evident from CNN’s Fear & Greed Index, which stands at 36. Values below 50 indicate that investors have more fear than greed.
The S&P 500 earnings season is approaching its end, as marked by Nvidia's report on February 25. As of February 13, 2026, 74% of S&P 500 companies had reported their fourth-quarter 2025 results. According to Earnings Insight, 74% of these companies reported positive earnings surprises and 73% reported positive revenue surprises. On average, S&P 500 companies achieved 9% revenue growth. Communication Services led in terms of positive earnings surprises in Q4 2025 with 94%, followed by Information Technology with 92% and Consumer Staples with 83%.
The following companies will report their quarterly results on Wednesday, February 18: the Swedish companies Bravida, Castellum, Lundbergs, and Scandic Hotels; the Danish company FLSmidth; and the North American companies Analog Devices and Booking Holdings. Today's macroeconomic statistics begin with Japan's January trade balance. Next are the UK's consumer and producer price indexes for January. France's consumer price index for January will also be released today. The U.S. will release December's housing construction and durable goods data, January's industrial production data and weekly oil inventories from the Department of Energy.
Thursday, February 19 is reporting day for the Danish companies ISS and Zealand Pharma. In continental Europe, Air France-KLM and Nestle will report. In North America, Airbus, Deere, Klarna, Rio Tinto and Walmart are scheduled to report. Chinese e-commerce giant Alibaba is also scheduled to report its quarterly earnings on Thursday. Turning to the macro news, we start with Japan's machine orders in December. Next is the Eurozone, with construction sector production in December and the household confidence indicator in February. Next, we have the UK's CBI industrial trends for February. Finally, there is a block of data from the US, including the December trade balance (see graph below), the December trade balance for goods and wholesale inventories, the February Philadelphia Fed Index, weekly initial jobless claims, and the January contracted house purchases.
U.S. Trade Balance (in billions of USD), Five-Year Monthly Chart

On Friday, February 20, the macro news will be dominated by the February Purchasing Managers' Indices from Japan, India, France, Germany, the eurozone, the UK, and the US. January Consumer Price Index (CPI) data will also be released for Japan and Sweden. Germany will publish the January producer price index. The U.S. will contribute Q4 Gross Domestic Product (GDP), private consumption and inflation in December, the Michigan index in February, and existing home sales in November.
Bears are sneaking up in the wake of stretched valuations
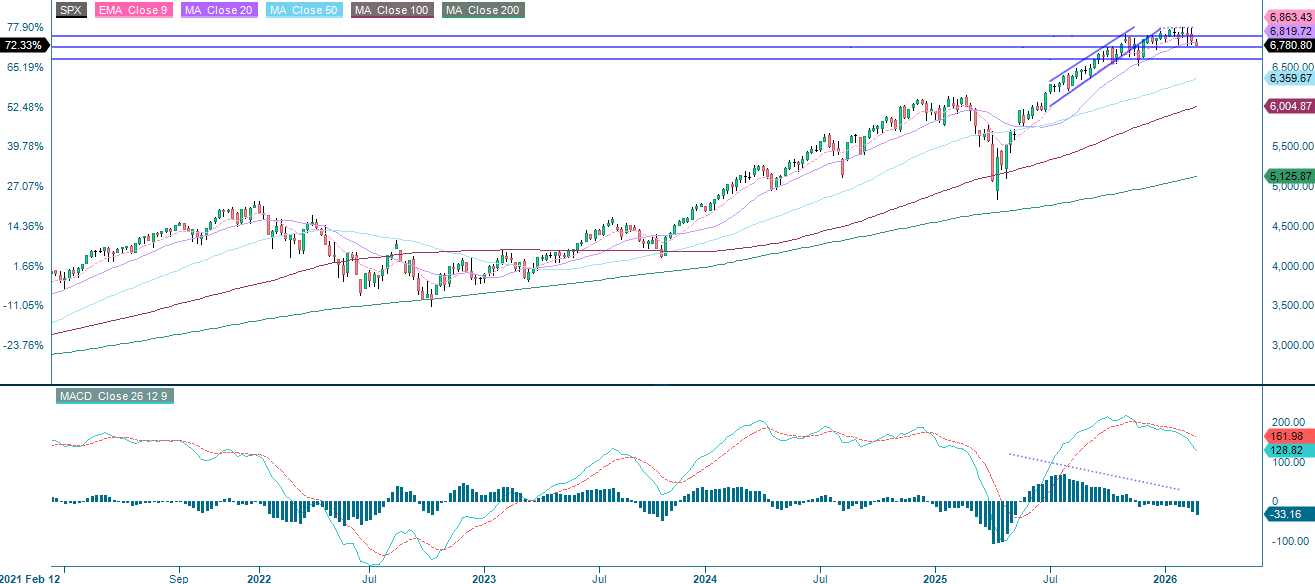
Bears are gaining ground as markets await the court ruling on the legality of Trump's tariffs. The S&P 500 remains within its trading range, though the Moving Average Convergence Divergence (MACD) has just turned negative. A break below 5,760 could lead to a move towards the 5,550 area.
Related Products
S&P 500 (in USD), one-year daily chart

S&P 500 (in USD), five-year weekly chart
The perception of stretched valuations in the AI and software sectors is adding a further layer of caution to the market. As the chart below shows, the MACD for the NASDAQ-100 has moved into negative territory while the Relative Strength Index (RSI) remains neutral. This suggests that the index is more likely to drift lower toward the (200-day Moving Average) MA200, which is currently just above 23,900.
Related Products
NASDAQ-100 (in USD), one-year daily chart
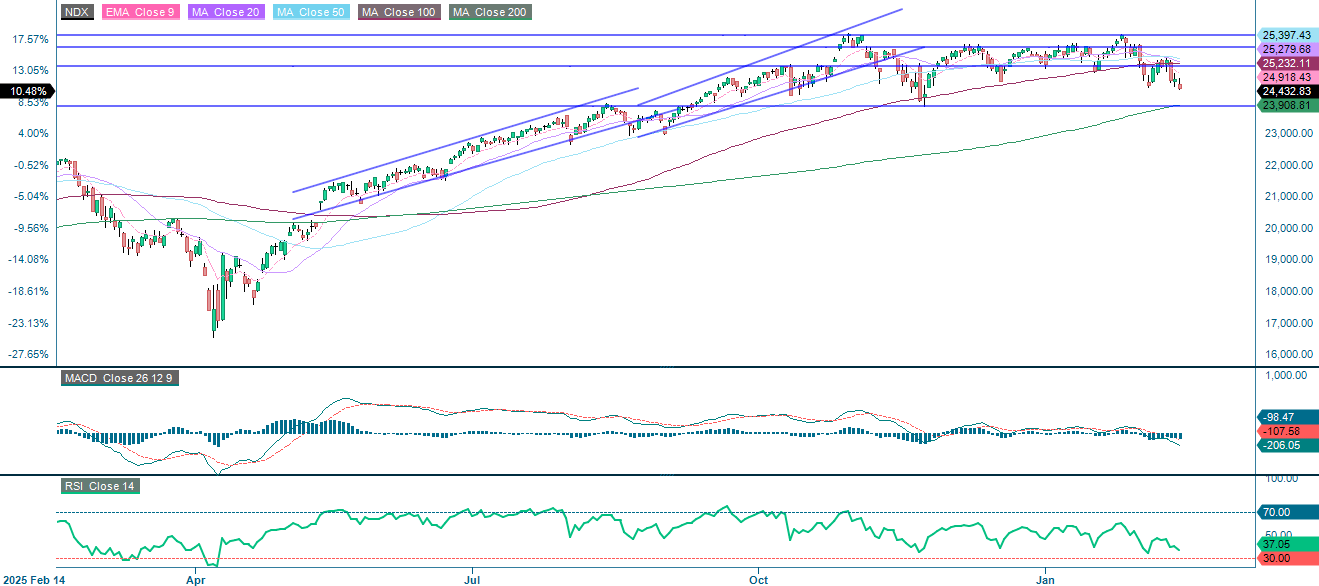
NASDAQ-100 (in USD), five-year weekly chart

The Swedish OMXS30 has been one of the top-performing indices so far this year. Nevertheless, momentum is fading, as indicated by the MACD, which has produced a mild sell signal. The short-term trend will remain upward if the 20-day Moving Average (MA20), which serves as the first level of support, holds. If that level gives way, the index may move towards the 3,040 area.
Related Products
OMX30 (in SEK), one-year daily chart

OMX30 (in SEK), five-year weekly chart

Dax
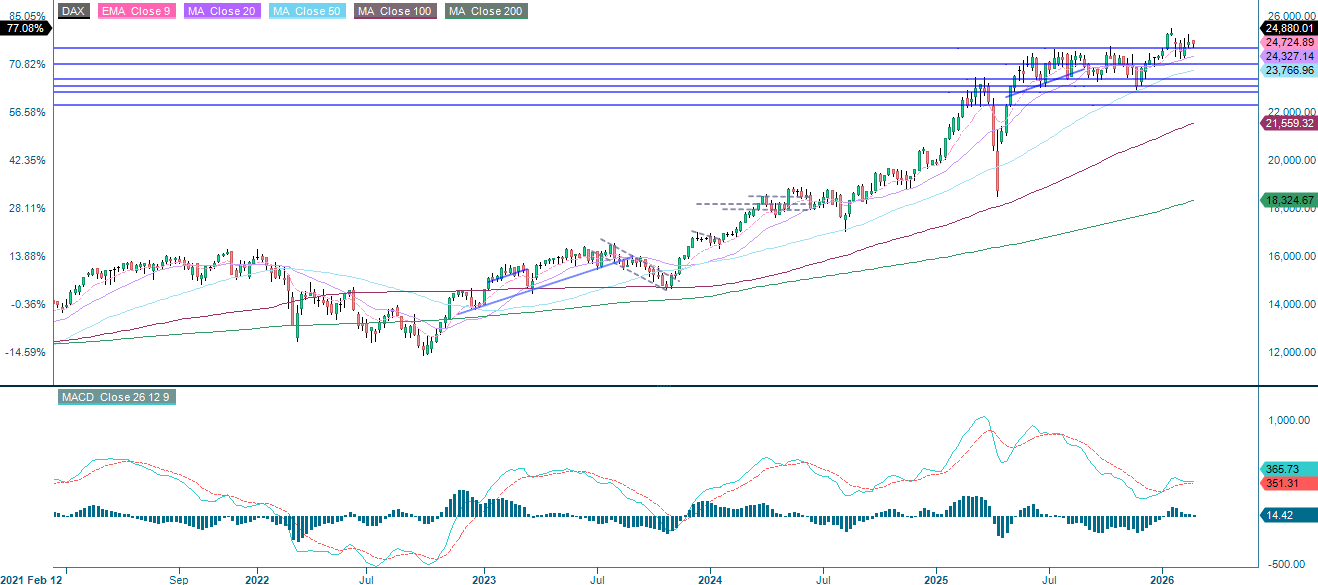
In Germany, the DAX appears to be in wait-and-see mode. The 25,420, 24,650, and 24,300 levels are worth monitoring as they could define a tradable range.
Related Products
DAX (in EUR), one-year daily chart

DAX (in EUR), five-year weekly chart
The full name for abbreviations used in the previous text:
EMA 9: 9-day Exponential Moving Average
Fibonacci: There are several Fibonacci lines used in technical analysis. Fibonacci numbers are a sequence in which each successive number is the sum of the two previous numbers.
MA20: 20-day Moving Average
MA50: 50-day Moving Average
MA100: 100-day Moving Average
MA200: 200-day Moving Average
MACD: Moving Average Convergence Divergence
Risks
Credit risk of the issuer:
Investors in the products are exposed to the risk that the Issuer or the Guarantor may not be able to meet its obligations under the products. A total loss of the invested capital is possible. The products are not subject to any deposit protection.
Currency risk:
If the product currency differs from the currency of the underlying asset, the value of a product will also depend on the exchange rate between the respective currencies. As a result, the value of a product can fluctuate significantly.
External author:
This information is in the sole responsibility of the guest author and does not necessarily represent the opinion of Bank Vontobel Europe AG or any other company of the Vontobel Group. This information is sponsored by Bank Vontobel Europe AG, which may be a counterparty to transactions involving the financial instruments discussed in this information. The further development of the index or a company as well as its share price depends on a large number of company-, group- and sector-specific as well as economic factors. When forming his investment decision, each investor must take into account the risk of price losses. Please note that investing in these products will not generate ongoing income.
The products are not capital protected, in the worst case a total loss of the invested capital is possible. In the event of insolvency of the issuer and the guarantor, the investor bears the risk of a total loss of his investment. In any case, investors should note that past performance and / or analysts' opinions are no adequate indicator of future performance. The performance of the underlyings depends on a variety of economic, entrepreneurial and political factors that should be taken into account in the formation of a market expectation.
Market risk:
The value of the products can fall significantly below the purchase price due to changes in market factors, especially if the value of the underlying asset falls. The products are not capital-protected
Product costs:
Product and possible financing costs reduce the value of the products.
Risk with leverage products:
Due to the leverage effect, there is an increased risk of loss (risk of total loss) with leverage products, e.g. Bull & Bear Certificates, Warrants and Mini Futures.
Disclaimer:
This information is neither an investment advice nor an investment or investment strategy recommendation, but advertisement. The complete information on the products (securities) mentioned herein, in particular the structure and risks associated with an investment, are described in the base prospectus, together with any supplements, as well as the final terms relating to the securities. The base prospectus and final terms constitute the solely binding sales documents for the products mentioned herein. It is recommended that potential investors read these documents before making any investment decision. The documents and the key information document are published on the website of the issuer, Vontobel Financial Products GmbH, Bockenheimer Landstrasse 24, 60323 Frankfurt am Main, Germany, on https://prospectus.vontobel.com and are available from the issuer free of charge. The approval of the prospectus should not be understood as an endorsement of the securities. The securities are products that are not simple and may be difficult to understand. This information includes or relates to figures of past performance. Past performance is not a reliable indicator of future performance. This information may only be distributed or published in countries where such distribution or publication is permitted by applicable law. As stated in the relevant base prospectus, the distribution of the securities mentioned in this information is subject to restrictions in certain jurisdictions. This advertisement may not be reproduced or redistributed without prior permission by Vontobel.
© Bank Vontobel Europe AG and / or affiliated companies. All rights reserved.