The focus is shifting towards the Q3 earnings season


Tesla is scheduled to publish its full Q3 2025 report on the 22nd of October. The company has already announced that its third-quarter vehicle deliveries exceeded consensus expectations by 11%. However, we would argue that this has already been factored into Tesla’s current market capitalization of USD 1.5 trillion, as evidenced by a price-to-earnings ratio of 270.
Case of the week: Tesla – To buy or not before Q3 2025-report?
Tesla Inc. (NASDAQ: TSLA) has reported third-quarter deliveries of 497,000 vehicles. This sets a new company record, marking the first time that Tesla has delivered almost half a million vehicles in a single three-month period. This figure far exceeded analyst estimates of 448,000, meaning Tesla outperformed expectations by around 11%.
Despite this strong performance, the market’s reaction was muted. This likely stems from two factors. First, much of the positive news may already have been factored into the stock price, given its significant rally over the past month. Second, the now-expired $7,500 federal tax credit, which ended in late September, likely pulled forward a significant number of sales that would otherwise have occurred in the fourth quarter. Consequently, Q4 deliveries are expected to fall notably as the impact of this one-off incentive fades.
Tesla has also reported its Q3 production figures, revealing that it produced 447,000 vehicles during this period. This represents a slight decline from the 470,000 vehicles produced in Q3 of last year. Unlike in the first half of this year and last year's third quarter, when production exceeded deliveries, Tesla sold more vehicles than it produced in Q3. While this could theoretically reflect production constraints, it is more plausible that Tesla intentionally scaled back output to manage its growing inventory. Reducing inventory levels, which have built up in recent quarters, improves both cash flow and the balance sheet. Lower inventories free up cash that was previously tied up in unsold vehicles, thereby improving free cash flow and overall liquidity. As Tesla's free cash flow generation has been weak in recent quarters, partly due to inventory accumulation, maintaining production below delivery levels appears to be a strategic move to strengthen cash flow and financial stability.
Tesla’s energy segment accounted for around 12% of total revenue in the second quarter and showed strong momentum in Q3. The company deployed 12.5 GWh of energy storage, up from 6.9 GWh a year earlier — an increase of 81% year on year and a new record. This surpassed the previous record of 11 GWh, which was set in Q4 of 2024, reflecting the ongoing growth of Tesla’s energy operations. Although results in this segment can be volatile on a quarterly basis, this record deployment signals solid demand and growing adoption of Tesla’s energy storage products, such as the Megapack. Following a 7% decline in revenue in Q2, this rebound suggests that Tesla will likely report a significant increase in revenue for its energy business when it releases Q3 results at the end of October. This highlights the rising importance of the division as a key growth driver beyond the automotive sector.
The big question for investors is whether they should buy Tesla shares before the Q3 report is released on 22 October. Although Tesla exceeded expectations and demonstrated growth, 7% volume growth alongside a weak product mix is not particularly impressive, especially when competitors are achieving much stronger Electric vehicle (EV) sales, partly due to one-off political factors such as the tax credit that stimulated demand. Tesla has long aimed for 50% annual growth, yet its stock is trading as if it were a high-growth company, at over 270 times this year's Earnings per share (EPS). Under these circumstances, 7% growth simply isn’t enough to justify buying the stock. Tesla may eventually succeed with its robotics and other emerging businesses, but these outcomes are uncertain. With a market capitalisation of $1.5 trillion, much of this future success is already reflected in the price.
Related Products
Tesla (USD), one-year daily chart

Tesla (USD), five-year weekly chart

Macro comments
Investors in the US stock market have proven to be relatively unconcerned by the federal administration shutdown, the tenth for budgetary reasons since 1980. Meanwhile, the Q3 2025 reporting season begins next week. Wall Street analysts expect S&P 500 companies to increase their profits by 5.5% in Q3 and 7.2% in Q4.
On Wednesday, 8 October, Japan will publish its current account balance for August. Around six hours later, Sweden will publish its Consumer Price Index (CPI) figures for September. Germany will publish its industrial production figures for August. In the US, the Department of Energy should publish weekly oil stock statistics, but this is uncertain due to the current shutdown of the federal administration. The day will end with the release of the minutes from the Fed's policy meeting on 17 September.
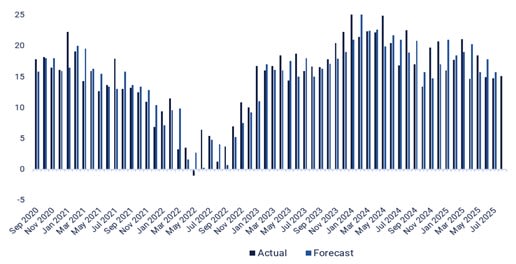
On Thursday, 9 October, we will receive interim reports from Öresund in Sweden, PepsiCo and Delta Air Lines in the US, and Fast Retailing in Japan. Telecom operator MTG is hosting a capital markets day. Turning to macro news, we will first examine Germany's trade balance for August (see the graph below). Next, we will look at the weekly initial jobless claims in the US, although it is uncertain whether these will be published due to the shutdown of the US Federal Administration.
On Friday 10 October, Swedish real estate companies Atrium Ljungberg and Platzer, along with Danish insurer Tryg, will publish their interim reports. The macro statistics will begin with Japan's PPI for September. This will be followed by a GDP indicator and industrial production and household consumption figures for Sweden, all for August. In North America, Canada's unemployment rate will be released in September, followed by the scheduled release of the US Michigan index in October (uncertain for the aforementioned reason).
Germany's trade balance (in billions of euros) from September 2020 to August 2025
Is it best to keep the long S&P 500?
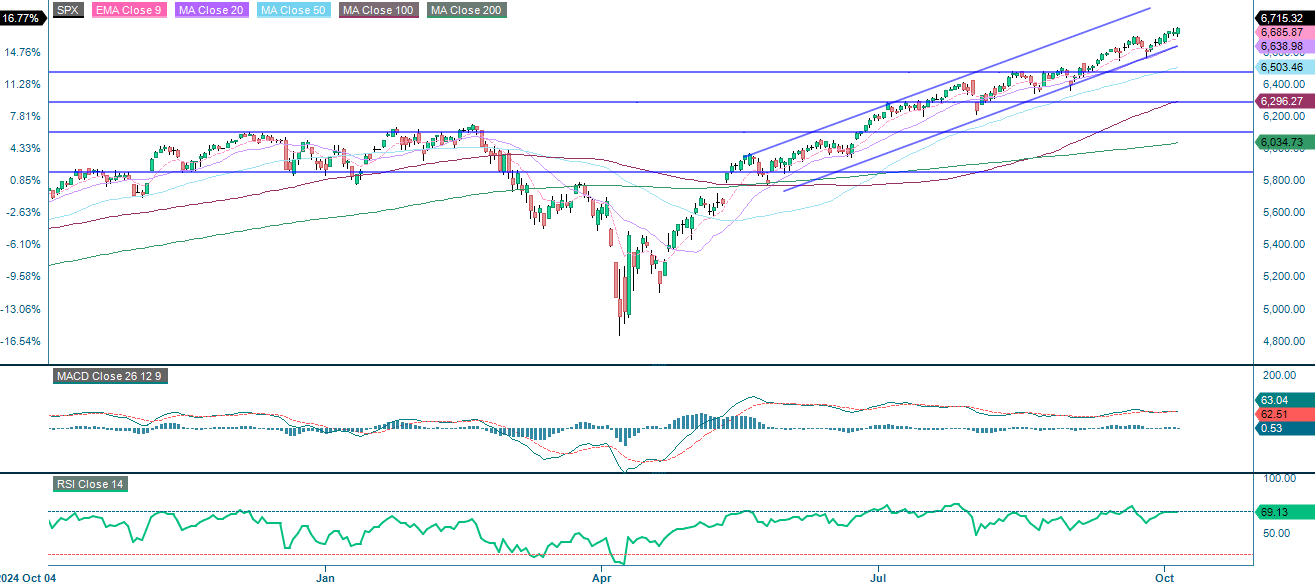
The S&P 500 remains in a strong bullish trend, trading above all major moving averages and within a rising channel. However, momentum is slowing, and an Relative Strength Index (RSI) of around 70 suggests that the market is overbought. Short-term consolidation or a mild pullback is possible, with key support levels at the bottom of the rising trend channel, followed by 6,600 and 6,500. As long as these levels hold, the broader uptrend will remain intact.
Related Products
S&P 500 (in USD), one-year daily chart
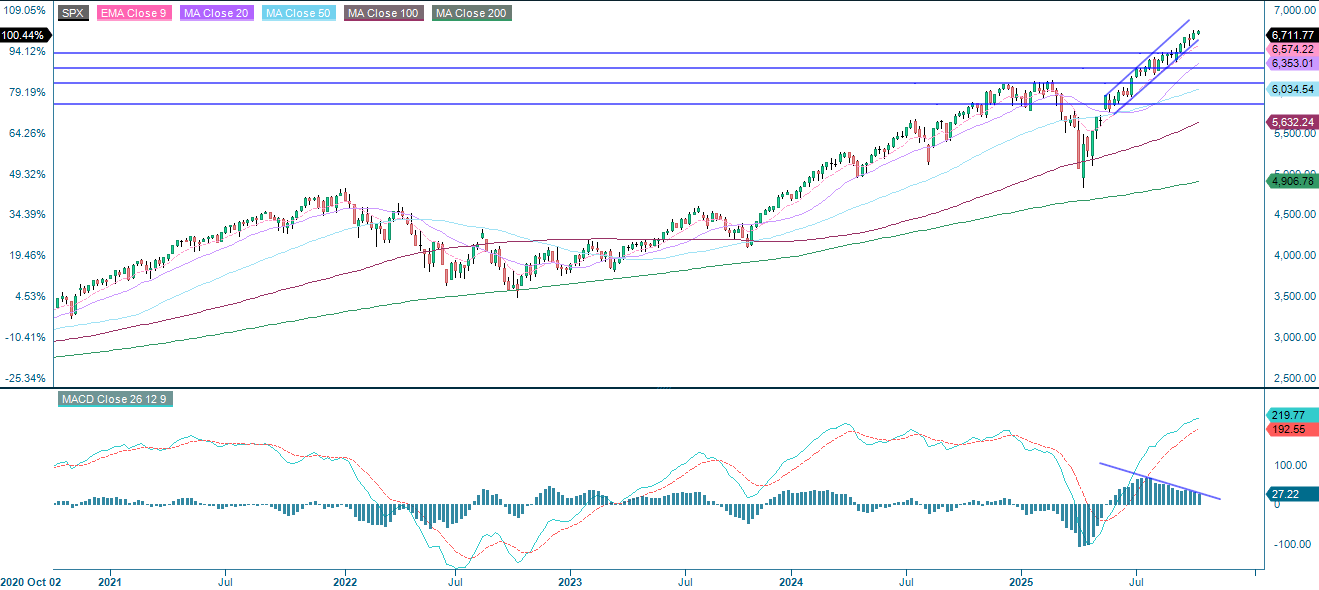
S&P 500 (in USD), weekly five-year chart
The NASDAQ-100 remains in a strong, well-defined upward trend, with higher highs and lows forming. The index is trading well above all key moving averages, which confirms its broad bullish strength. Both MACD and RSI support continued upside momentum, although the RSI reading of around 68 suggests limited short-term scope for growth. Immediate support lies between 24,000 and 24,450.
Related Products
NASDAQ-100 (in USD), one-year daily chart

NASDAQ-100 (in USD), weekly five-year chart

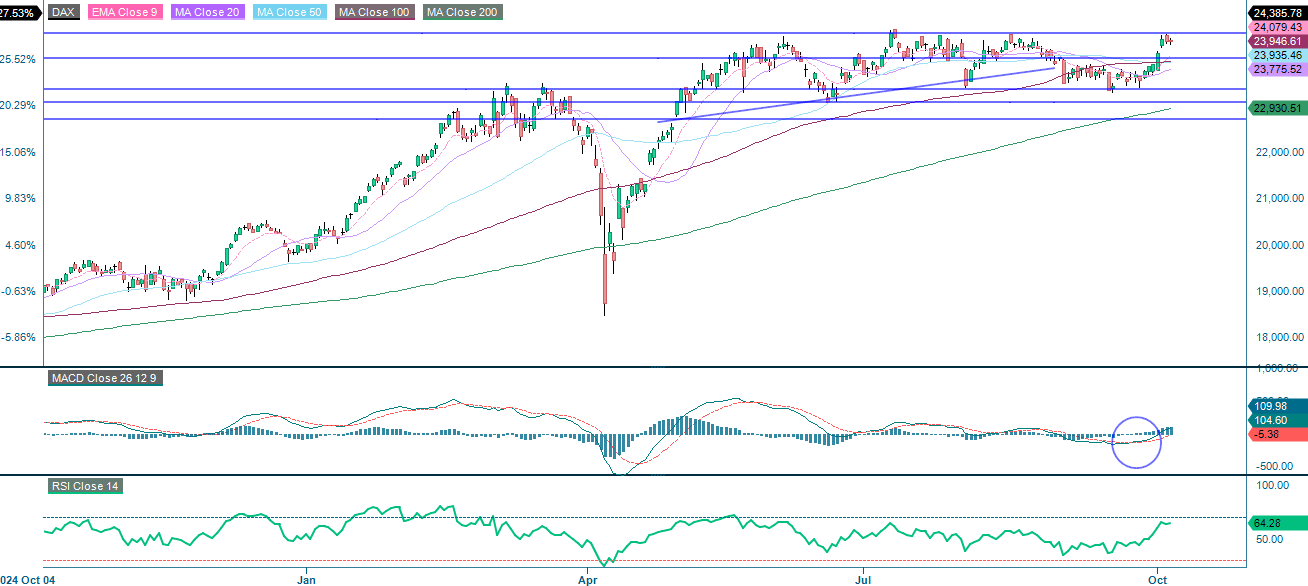
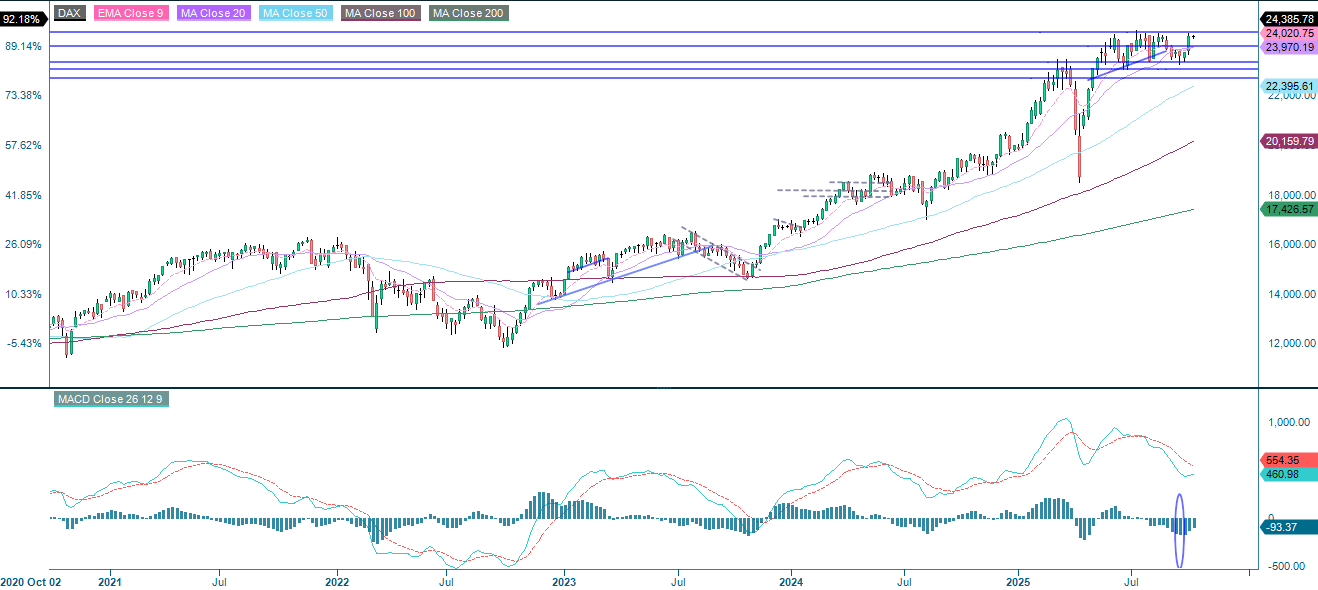
The DAX has broken out of its recent consolidation phase. The index is trading above all the key moving averages at the resistance level of around 24,550. MACD has issued a fresh buy signal, accompanied by a rising histogram. Meanwhile, RSI at 64 indicates strength without overbought conditions. Immediate support lies at 24,000 on the downside.
Related Products
DAX (in EUR), one-year daily chart
DAX (in EUR), weekly five-year chart
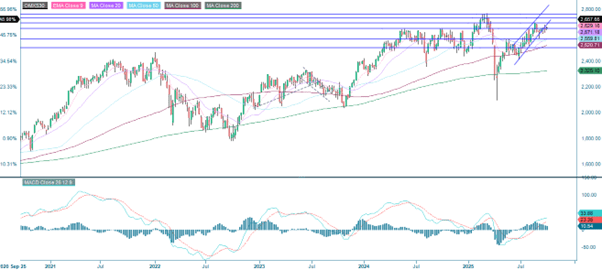
The OMXS30 is in a strong uptrend and has recently broken through to reach new highs within a rising price channel. The index is trading above all key moving averages, which are all upward-sloping, confirming broad bullish strength. Both MACD and RSI signal sustained momentum: the RSI is at 67, indicating strong but not overextended conditions. The next level on the upside is around 2,760. Support levels are seen at around 2,690 and 2,650.
OMX30 (in SEK), one-year daily chart
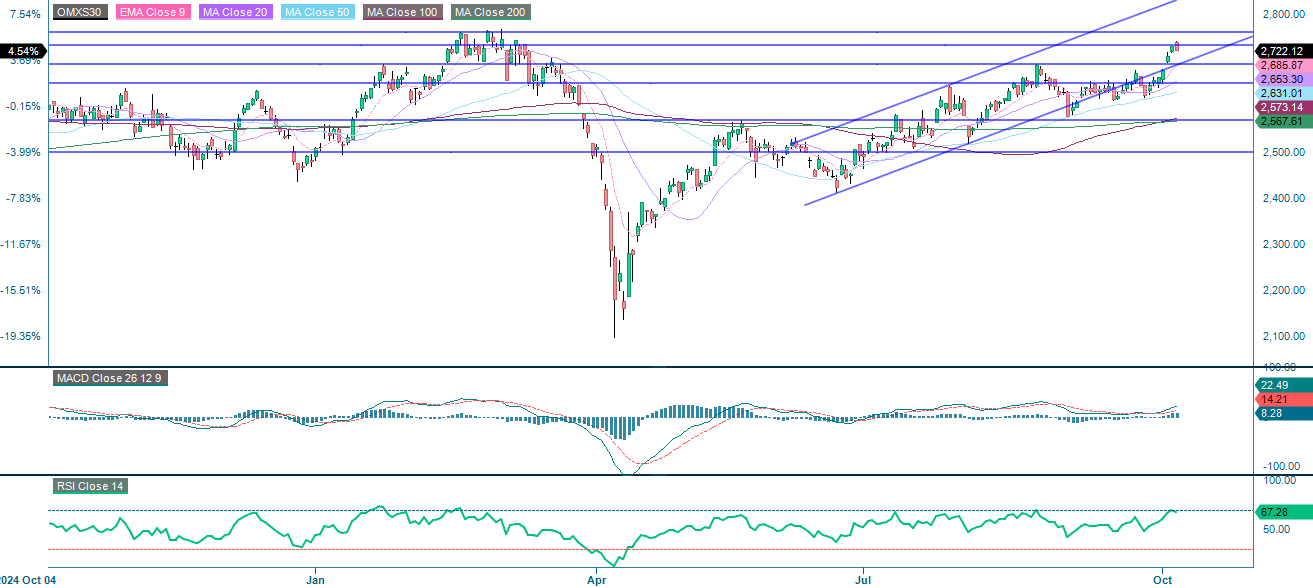
OMX30 (in SEK), weekly five-year chart
The full name for abbreviations used in the previous text:
EMA 9: 9-day exponential moving average
Fibonacci: There are several Fibonacci lines used in technical analysis. Fibonacci numbers are a sequence in which each successive number is the sum of the two previous numbers.
MA20: 20-day moving average
MA50: 50-day moving average
MA100: 100-day moving average
MA200: 200-day moving average
MACD: Moving average convergence divergence
Risks
Credit risk of the issuer:
Investors in the products are exposed to the risk that the Issuer or the Guarantor may not be able to meet its obligations under the products. A total loss of the invested capital is possible. The products are not subject to any deposit protection.
Currency risk:
If the product currency differs from the currency of the underlying asset, the value of a product will also depend on the exchange rate between the respective currencies. As a result, the value of a product can fluctuate significantly.
Market risk:
The value of the products can fall significantly below the purchase price due to changes in market factors, especially if the value of the underlying asset falls. The products are not capital-protected
Product costs:
Product and possible financing costs reduce the value of the products.
Risk with leverage products:
Due to the leverage effect, there is an increased risk of loss (risk of total loss) with leverage products, e.g. Bull & Bear Certificates, Warrants and Mini Futures.
External author:
This information is in the sole responsibility of the guest author and does not necessarily represent the opinion of Bank Vontobel Europe AG or any other company of the Vontobel Group. This information is sponsored by Bank Vontobel Europe AG, which may be a counterparty to transactions involving the financial instruments discussed in this information. The further development of the index or a company as well as its share price depends on a large number of company-, group- and sector-specific as well as economic factors. When forming his investment decision, each investor must take into account the risk of price losses. Please note that investing in these products will not generate ongoing income.
The products are not capital protected, in the worst case a total loss of the invested capital is possible. In the event of insolvency of the issuer and the guarantor, the investor bears the risk of a total loss of his investment. In any case, investors should note that past performance and / or analysts' opinions are no adequate indicator of future performance. The performance of the underlyings depends on a variety of economic, entrepreneurial and political factors that should be taken into account in the formation of a market expectation.
Disclaimer:
This information is neither an investment advice nor an investment or investment strategy recommendation, but advertisement. The complete information on the products (securities) mentioned herein, in particular the structure and risks associated with an investment, are described in the base prospectus, together with any supplements, as well as the final terms relating to the securities. The base prospectus and final terms constitute the solely binding sales documents for the products mentioned herein. It is recommended that potential investors read these documents before making any investment decision. The documents and the key information document are published on the website of the issuer, Vontobel Financial Products GmbH, Bockenheimer Landstrasse 24, 60323 Frankfurt am Main, Germany, on https://prospectus.vontobel.com and are available from the issuer free of charge. The approval of the prospectus should not be understood as an endorsement of the securities. The securities are products that are not simple and may be difficult to understand. This information includes or relates to figures of past performance. Past performance is not a reliable indicator of future performance. This information may only be distributed or published in countries where such distribution or publication is permitted by applicable law. As stated in the relevant base prospectus, the distribution of the securities mentioned in this information is subject to restrictions in certain jurisdictions. This advertisement may not be reproduced or redistributed without prior permission by Vontobel.
© Bank Vontobel Europe AG and / or affiliated companies. All rights reserved.