Scope for a catch-up rally in copper and the OMX30


The tariffs imposed by U.S. President Trump created a copper price bubble that has now burst. The fact that the Fed has shifted towards an interest rate easing policy, combined with a weaker USD, suggests that there could be a catch-up rally in copper prices during the autumn, as copper has underperformed other precious metals. From a technical analysis perspective, the Swedish OMX30 index now appears attractive, given its low RSI level of 64.
Case of the week: Is Copper’s tariff trauma an opportunity or a red flag?
There are several reasons to believe in growing long-term demand for copper. Green transition has been a theme for a long time, as more metal is required for the shift from fossil energy to solar, wind and electric vehicles (EVs). Global urbanisation and industrialisation are also boosting consumption. Additionally, investments in data centre electrification following the AI boom are a relatively new but significant driver.
Also, there are supply challenges as metal grades are declining and production costs are rising. However, expectations surrounding Trump’s tariffs have created volatility and artificial price spreads in the U.S. copper markets since 2025. Traders of physical copper bought international copper to stockpile in the U.S. in anticipation of the tariffs. U.S. prices rose faster than in the rest of the world. When the tariffs were announced in late July, they were narrower in scope than expected, focusing on semi-finished products. This caused U.S. copper prices to drop to align with international levels. The tariffed items accounted for around 28% of the total value of all copper imports in 2024.
Performance of copper spot prices in the U.S. (COMEX) versus LME (%), one-year daily chart
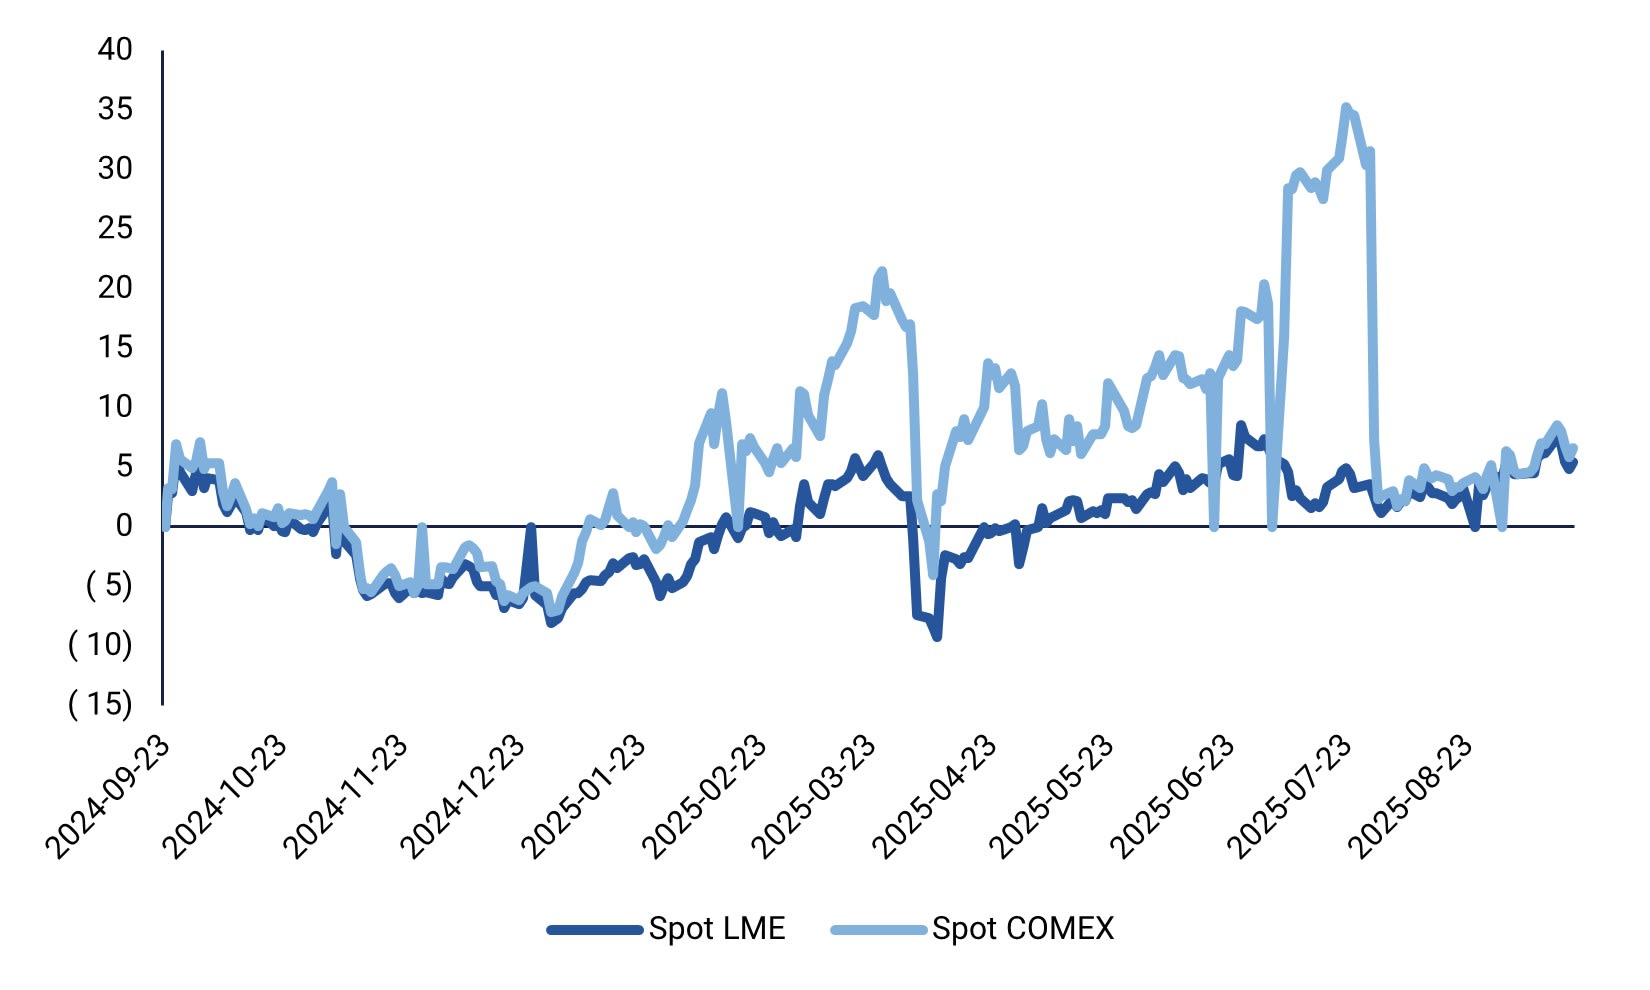
The question is whether the bubble created by tariff speculation has completely burst, creating a potential buying opportunity, or whether high U.S. copper inventories and muted demand in the short-term following the tariff debacle will continue to cap prices. Meanwhile, the Fed's monetary policy is shifting towards easing, and a weakening USD provides a supportive backdrop for hard assets such as gold and copper. So far in 2025, copper prices have underperformed compared to precious metals, suggesting that they could catch up.
Related Products
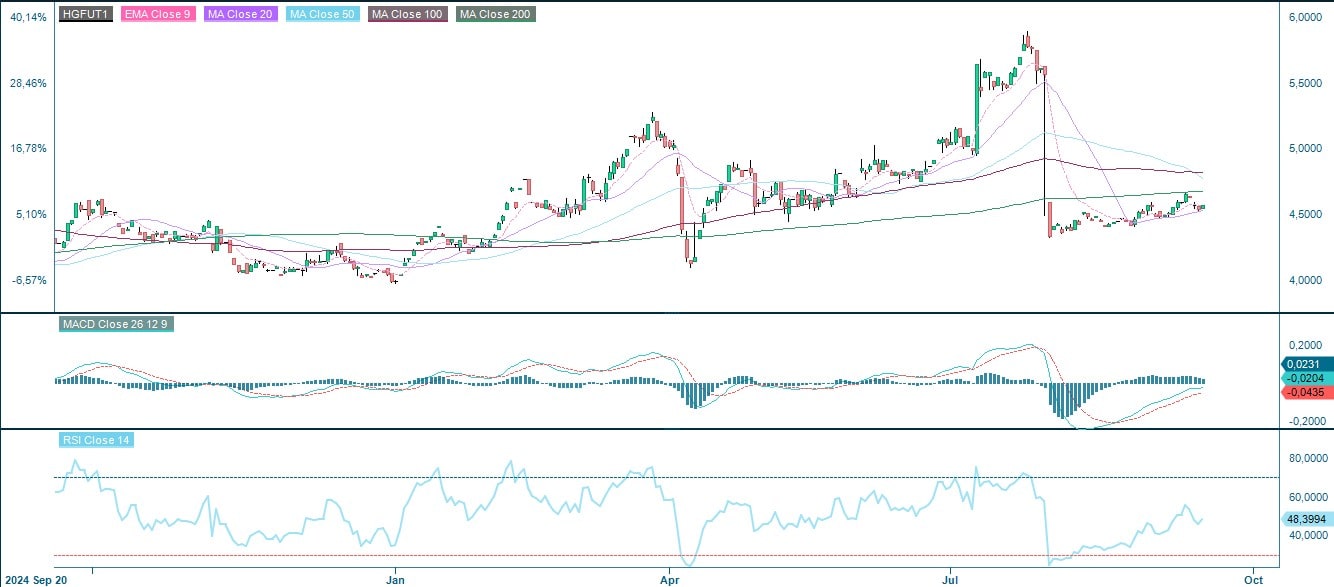
Copper futures (in USD per lb), one-year daily chart
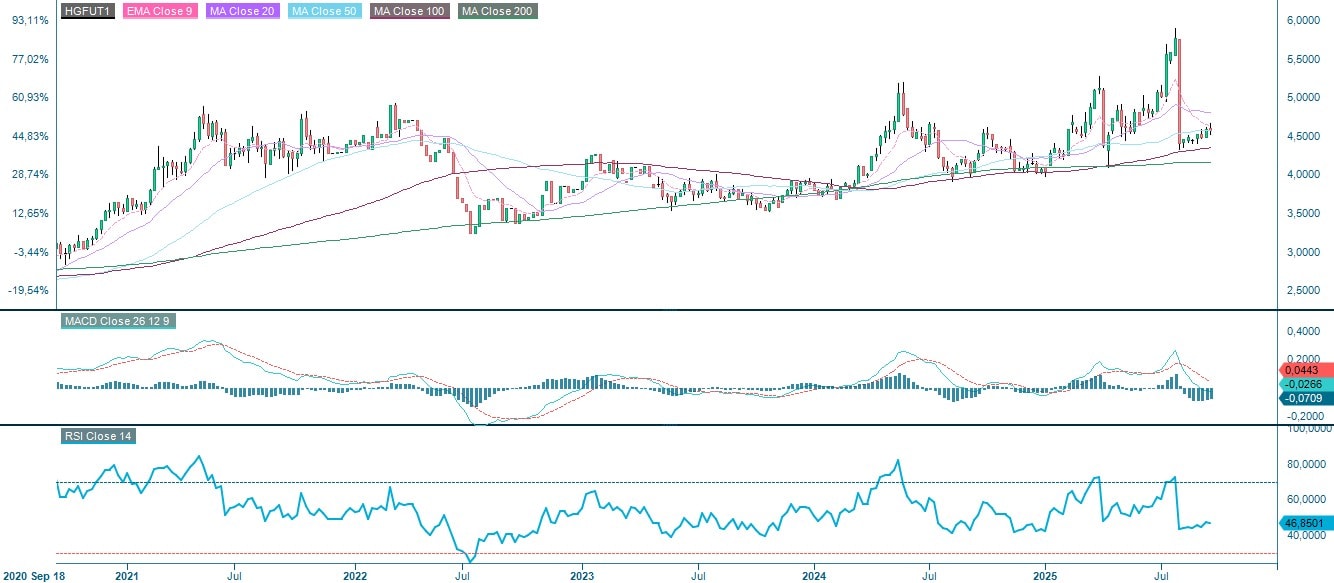
Copper futures (in USD per lb), five-year weekly chart
Macro comments
As expected, the U.S. Federal Reserve cut its key interest rate by a quarter of a percentage point on Wednesday, 17 September, and plans two further cuts this year. Furthermore, the Federal Reserve anticipates an additional rate reduction in both 2026 and 2027. Powell acknowledged the weakening of the U.S. labour market while also raising concerns about inflation resulting from tariffs. However, since 17 September, the yield on 10-year U.S. Treasuries has increased from 4.04% to 4.14%.
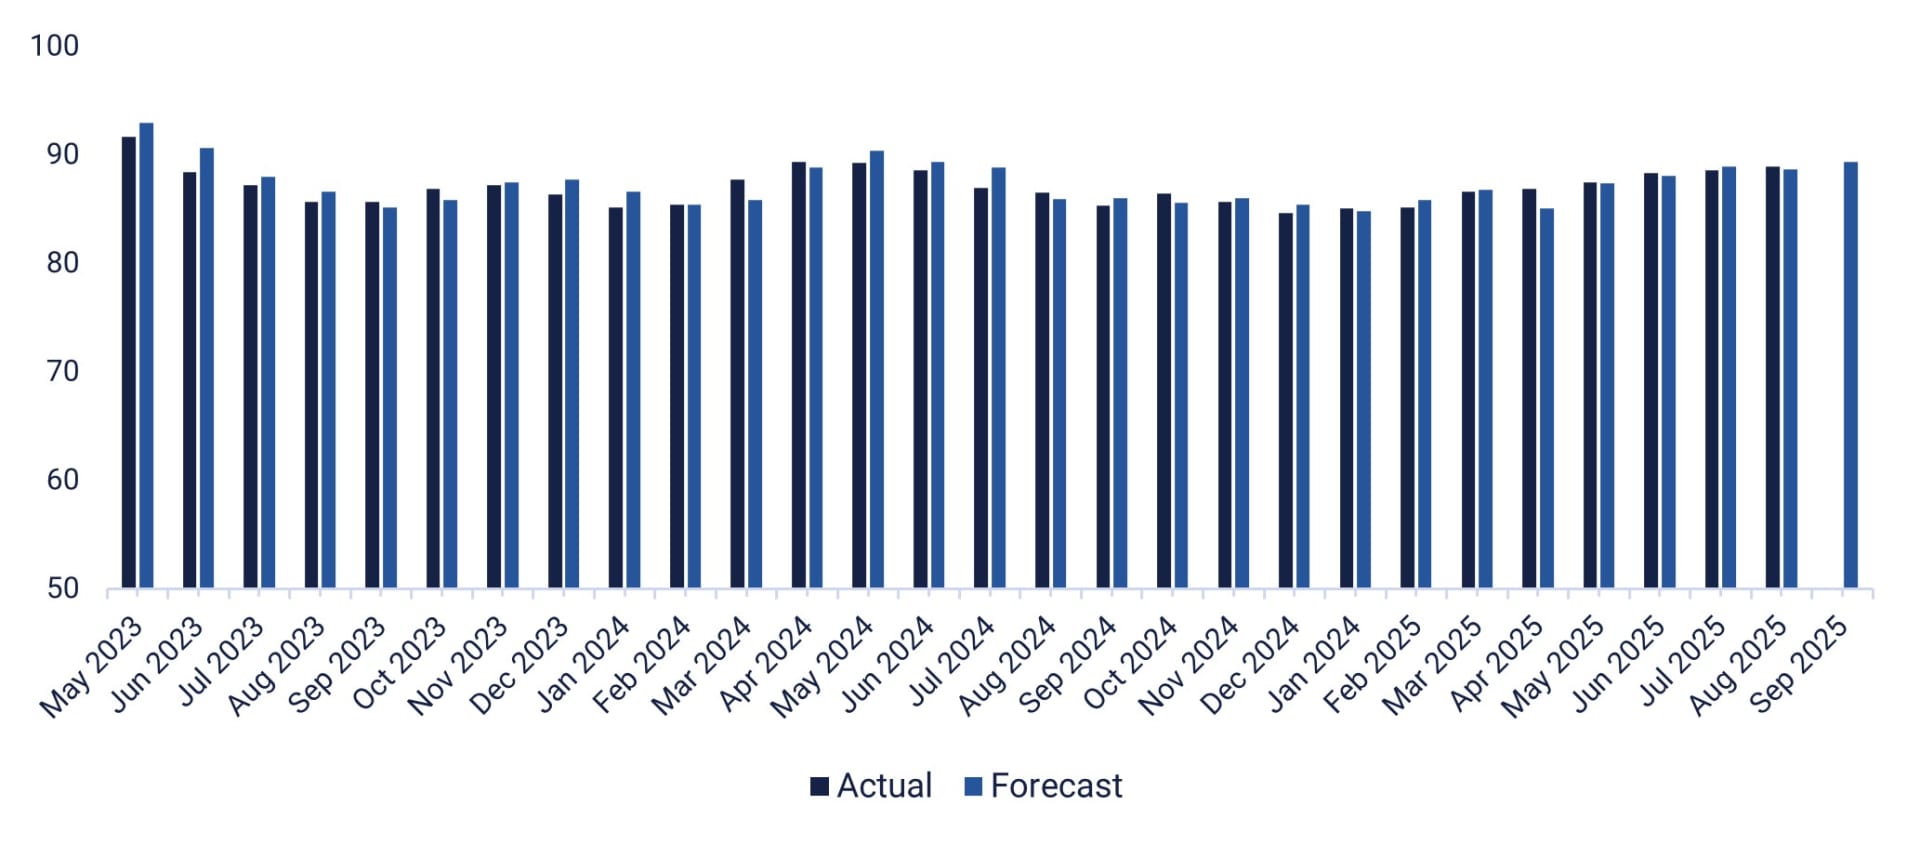
On Wednesday 24 September, U.S. business services company Cintas will release an interim report, while the Swedish company Synsam will organise a capital markets day. The day's macroeconomic events will begin with the release of Japan's purchasing managers' index for September. A few hours later, the Swedish NIESR will publish a business barometer. Germany will release its IFO index for September — please see the graph below. The US will contribute new home sales figures for August and weekly oil inventory data (DOE).
On Thursday, 25 September, the Swedish H&M Group will publish its interim report alongside Accenture and Costco Wholesale in the U.S. Meanwhile, the SCB will present statistics on Swedish household lending and the producer price index for August. This will be followed by Germany’s GfK consumer confidence index for October, while France will publish its household confidence indicator
for September. The Swiss National Bank will announce its interest rate decision. Key events on the U.S. macro agenda include durable goods orders for August, the final Q2 Gross domestic product figure, the goods trade balance and wholesale inventories for August, initial jobless claims and the Kansas City Fed index for September.
On Friday, 26 September, Statistics Sweden will present Sweden's trade balance for August. This will be followed by Spain's Q2 GDP figures and the European central bank’s survey of eurozone households' inflation expectations. Moving on to North America, Canada's Gross domestic product for July will be released, along with U.S. personal consumption expenditure and inflation (PCE) for August, and the Michigan index for September.
German IFO Business Climate Index, January 2023 to September 2025 (forecast)
Can the OMXS30 continue to rally in the face of lower interest rates?
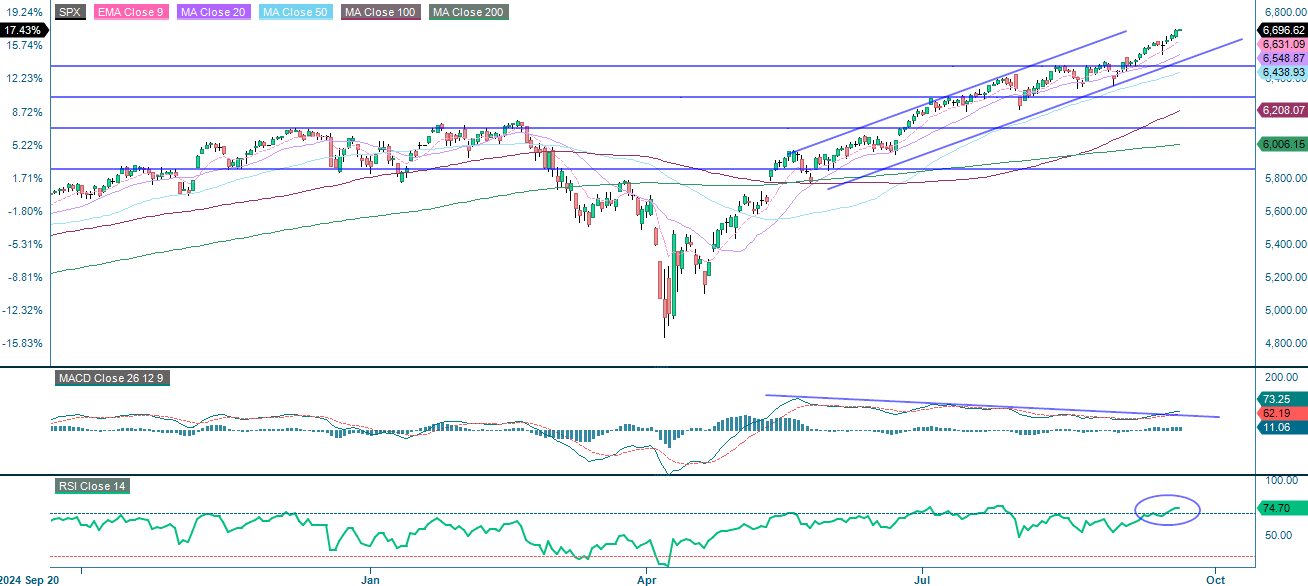
The S&P 500 is continuing to trend strongly upwards, trading above all major moving averages and within a defined upward channel. This signals robust bullish momentum. Recent resistance has been broken and is now acting as a support level, in addition to the MA20 and the floor of the trend channel. The MACD confirms this upward momentum with expanding positive histogram bars. Meanwhile, the RSI is close to 75, indicating overbought conditions and suggesting the potential for a short-term pullback or consolidation.
Related Products
S&P 500 (in USD), one-year daily chart
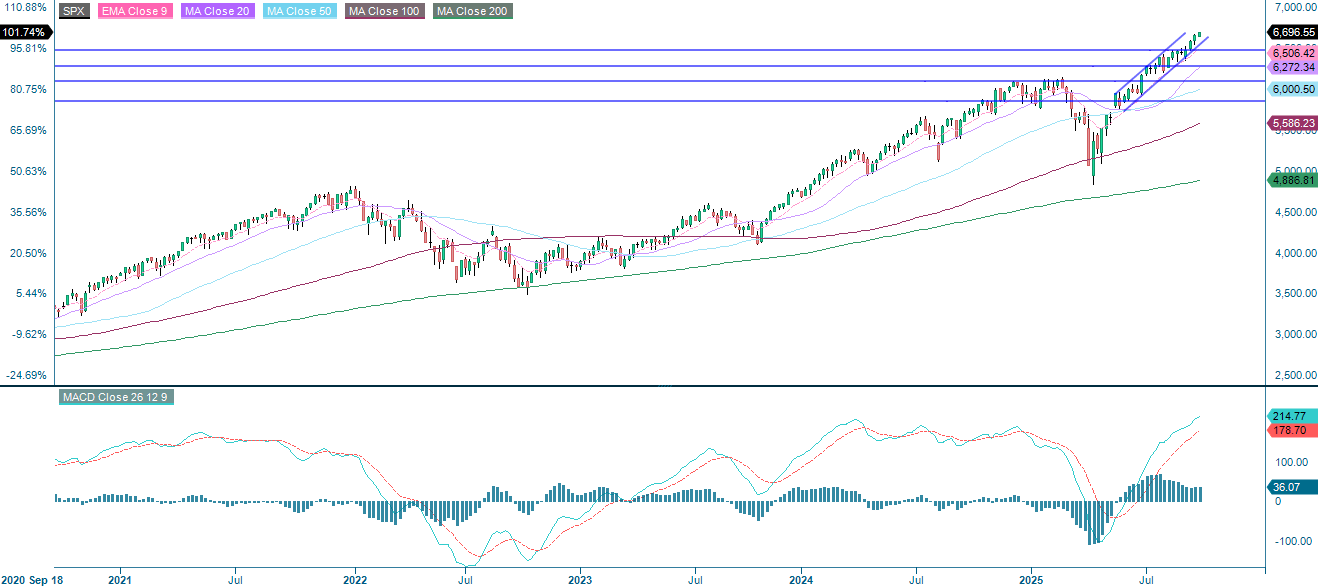
S&P 500 (in USD), weekly five-year chart
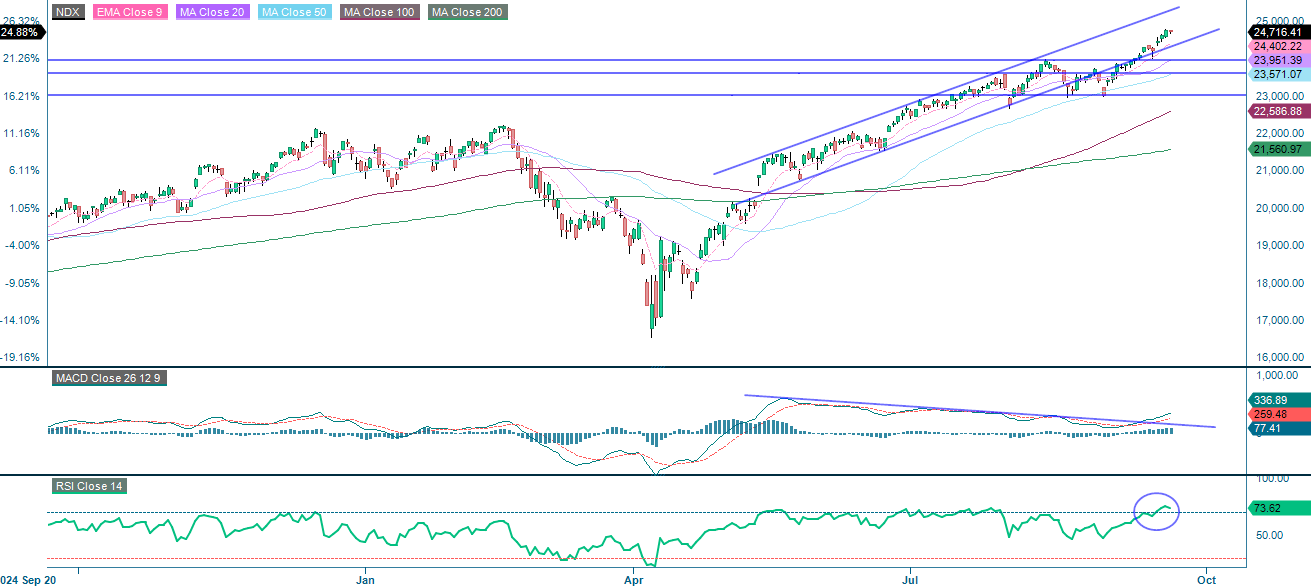
The NASDAQ-100 is still in an upward trend, trading above all main moving averages and approaching the upper boundary of its rising channel. This underscores robust bullish momentum. The MACD remains positive, with the histogram bars expanding. However, with an RSI close to 74, overbought conditions are indicated, raising the risk of a short-term pullback or consolidation. Support comes from the floor of the rising trend channel, followed by the MA20 and the 24,000 level.
Related Products
NASDAQ-100 (in USD), one-year daily chart
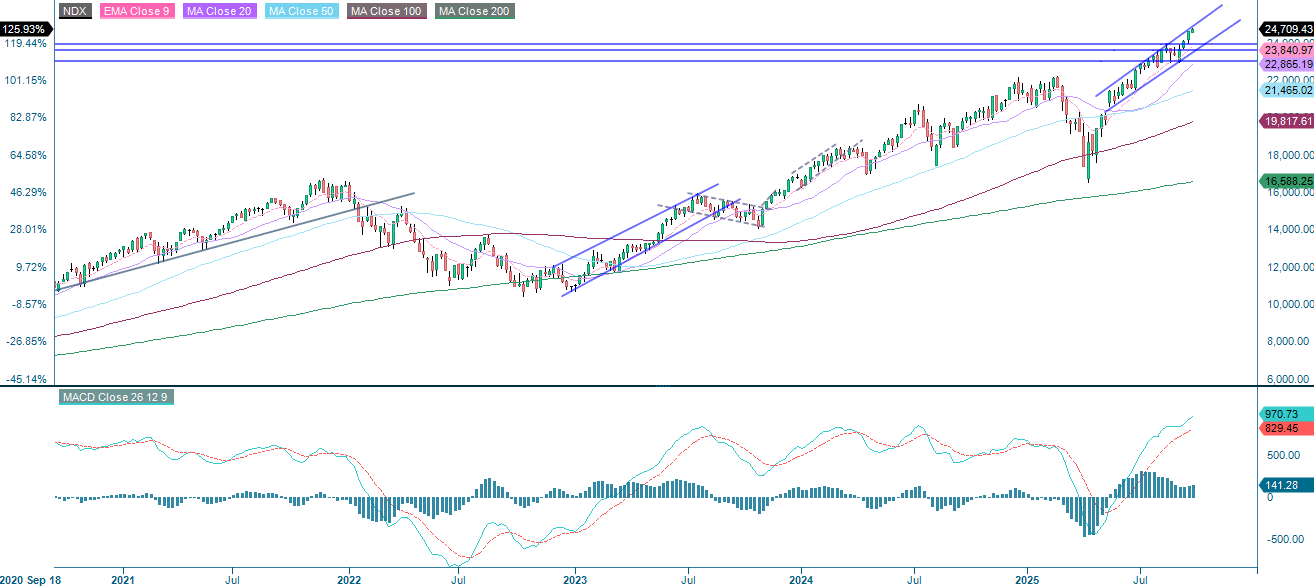
NASDAQ-100 (in USD), weekly five-year chart
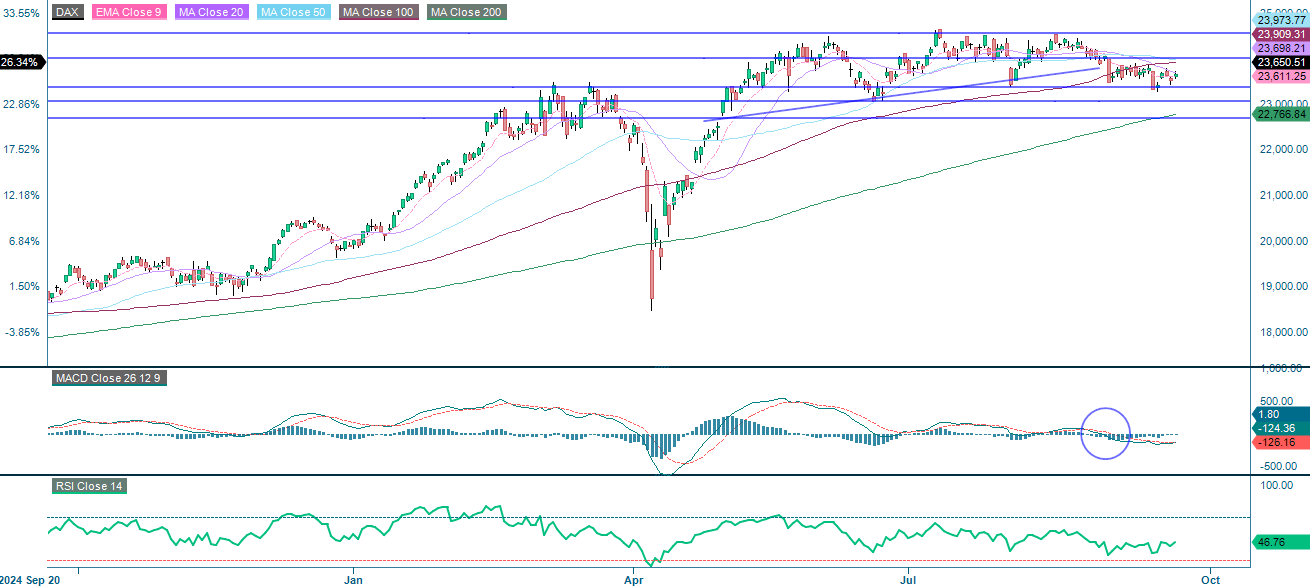
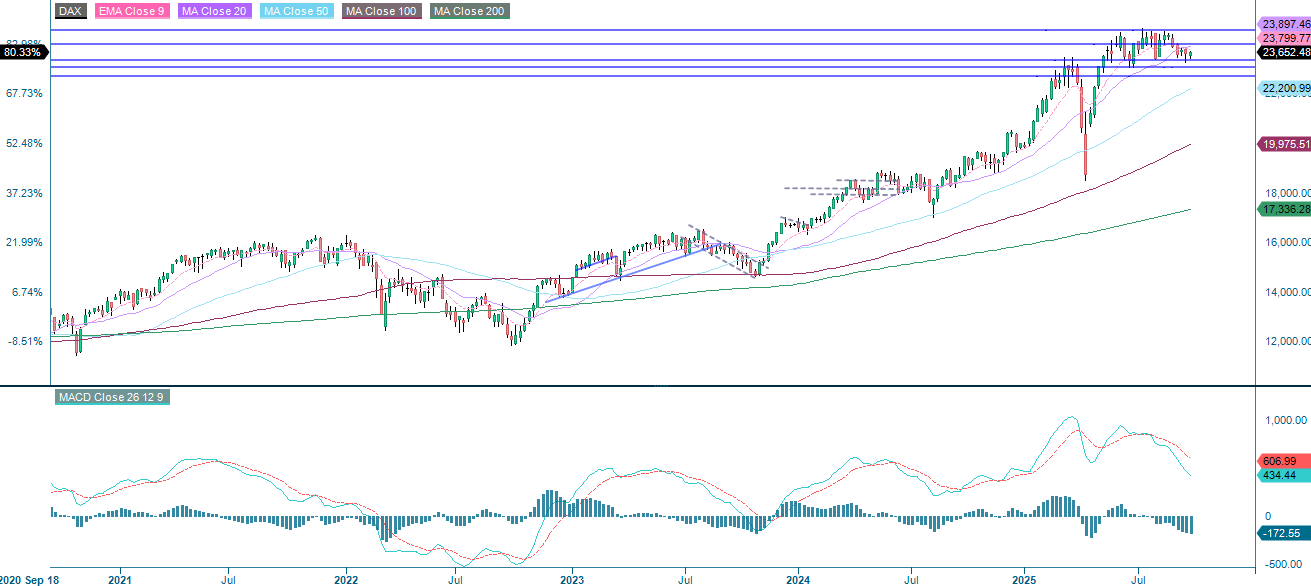
In Europe, the German DAX is showing a neutral-to-bearish trend, with the index trading below key short- and medium-term moving averages and consolidating near the lower end of its neutral channel. Resistance lies around 24,000, followed by previous highs. Following a recent bearish crossover, the MACD has turned negative, while the RSI of 46.76 indicates subdued momentum with no signs of reversal. Key support is found at around 23,370, followed by the 200-day moving average (MA200), making this a critical level to watch.
Related Products
DAX (in EUR), one-year daily chart
DAX (in EUR), weekly five-year chart
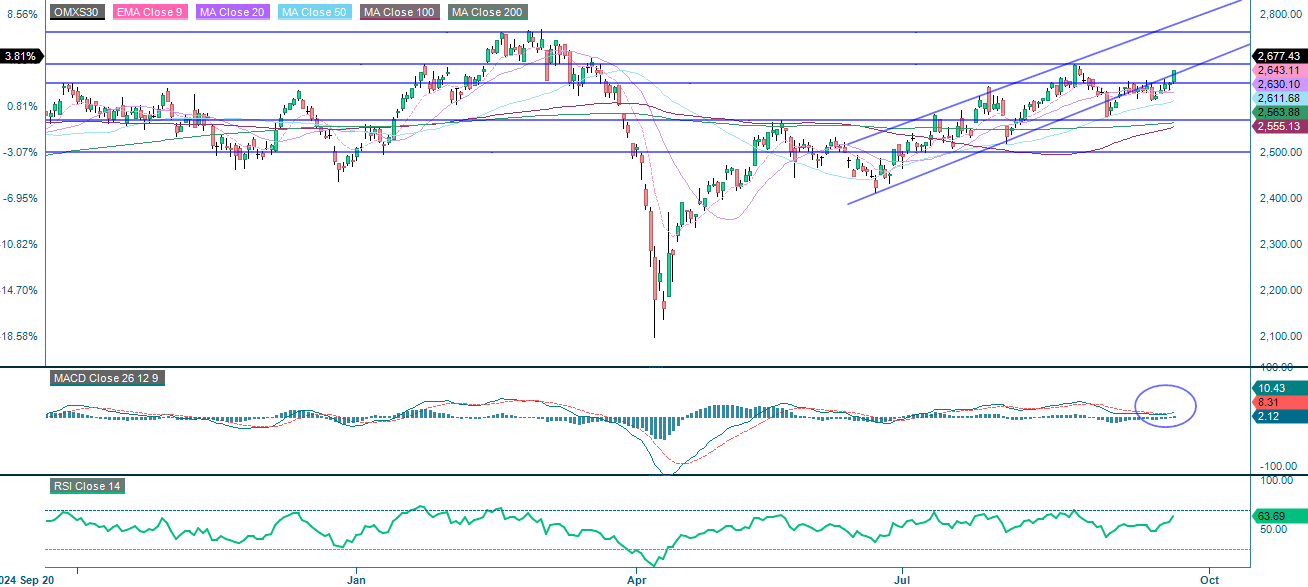
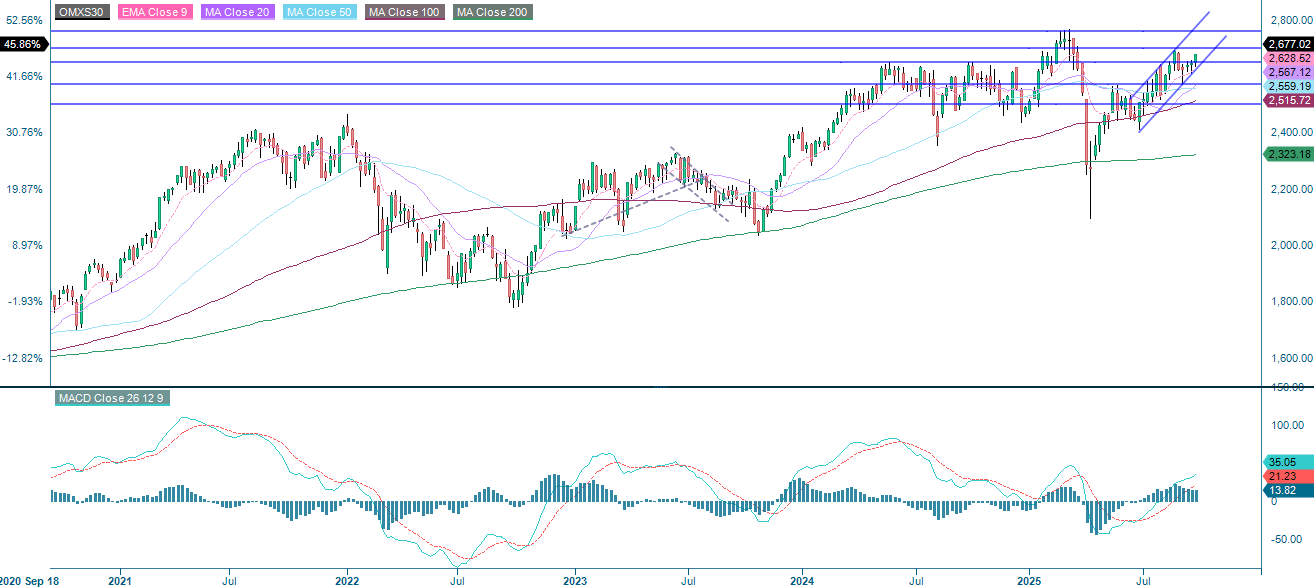
In Sweden, the OMXS30 is in a bullish phase. It is trading above all major moving averages and has recently broken through 2,650. MACD has generated a soft buy signal, confirming upward momentum, while an RSI of 64 indicates healthy strength without overbought risk, suggesting scope for further gains. The next resistance level is found near 2,690, followed by 2,730 and the previous high from early 2025. Therefore, the risk/reward profile of a long position looks relatively attractive.
Related Products
OMX30 (in SEK), one-year daily chart
OMX30 (in SEK), weekly five-year chart
The full name for abbreviations used in the previous text:
EMA 9: 9-day exponential moving average
Fibonacci: There are several Fibonacci lines used in technical analysis. Fibonacci numbers are a sequence in which each successive number is the sum of the two previous numbers.
MA20: 20-day moving average
MA50: 50-day moving average
MA100: 100-day moving average
MA200: 200-day moving average
MACD: Moving average convergence divergence
Risks
Credit risk of the issuer:
Investors in the products are exposed to the risk that the Issuer or the Guarantor may not be able to meet its obligations under the products. A total loss of the invested capital is possible. The products are not subject to any deposit protection.
Currency risk:
If the product currency differs from the currency of the underlying asset, the value of a product will also depend on the exchange rate between the respective currencies. As a result, the value of a product can fluctuate significantly.
Market risk:
The value of the products can fall significantly below the purchase price due to changes in market factors, especially if the value of the underlying asset falls. The products are not capital-protected
Risk with leverage products:
Due to the leverage effect, there is an increased risk of loss (risk of total loss) with leverage products, e.g. Bull & Bear Certificates, Warrants and Mini Futures.
External author:
This information is in the sole responsibility of the guest author and does not necessarily represent the opinion of Bank Vontobel Europe AG or any other company of the Vontobel Group. This information is sponsored by Bank Vontobel Europe AG, which may be a counterparty to transactions involving the financial instruments discussed in this information. The further development of the index or a company as well as its share price depends on a large number of company-, group- and sector-specific as well as economic factors. When forming his investment decision, each investor must take into account the risk of price losses. Please note that investing in these products will not generate ongoing income.
The products are not capital protected, in the worst case a total loss of the invested capital is possible. In the event of insolvency of the issuer and the guarantor, the investor bears the risk of a total loss of his investment. In any case, investors should note that past performance and / or analysts' opinions are no adequate indicator of future performance. The performance of the underlyings depends on a variety of economic, entrepreneurial and political factors that should be taken into account in the formation of a market expectation.
Disclaimer:
This information is neither an investment advice nor an investment or investment strategy recommendation, but advertisement. The complete information on the products (securities) mentioned herein, in particular the structure and risks associated with an investment, are described in the base prospectus, together with any supplements, as well as the final terms relating to the securities. The base prospectus and final terms constitute the solely binding sales documents for the products mentioned herein. It is recommended that potential investors read these documents before making any investment decision. The documents and the key information document are published on the website of the issuer, Vontobel Financial Products GmbH, Bockenheimer Landstrasse 24, 60323 Frankfurt am Main, Germany, on https://prospectus.vontobel.com and are available from the issuer free of charge. The approval of the prospectus should not be understood as an endorsement of the securities. The securities are products that are not simple and may be difficult to understand. This information includes or relates to figures of past performance. Past performance is not a reliable indicator of future performance. This information may only be distributed or published in countries where such distribution or publication is permitted by applicable law. As stated in the relevant base prospectus, the distribution of the securities mentioned in this information is subject to restrictions in certain jurisdictions. This advertisement may not be reproduced or redistributed without prior permission by Vontobel.
© Bank Vontobel Europe AG and / or affiliated companies. All rights reserved.