U.S. CPI figures could affect interest rates


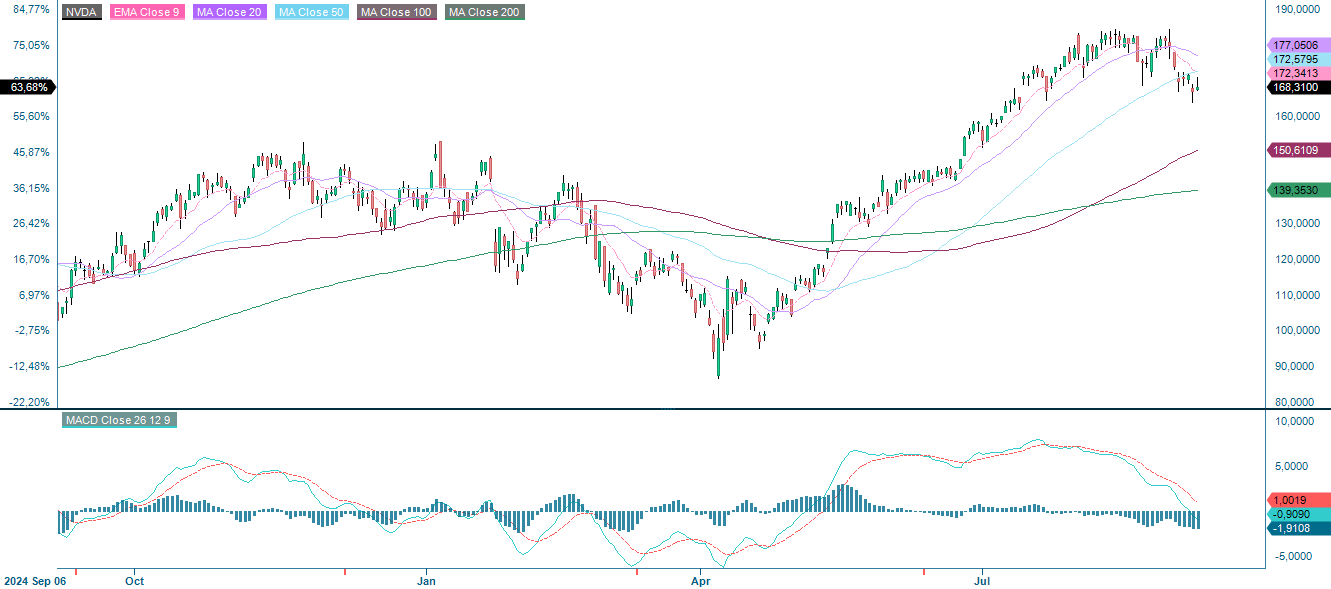
This week's case is a follow-up to our recommendation to purchase Nvidia stocks after the price drop on to 28 January 2025. Since then, Nvidia has posted a strong Q2 2025 report, with the share price gaining 31%. The company has identified China as its largest market opportunity. Weak U.S. nonfarm payroll figures were released on Friday, 5 September, and will be followed by U.S. Consumer price index figures on Thursday, 11 September. These figures will affect the path of U.S. interest rates.
Case of the week: Nvidia’s upward trajectory keeps going strong
Back in January, we said that the significant sell-off of Nvidia Corporation (referred to here as “Nvidia” or “the Company”) presented opportunities for bold investors to achieve a good return in the future. Since then, the Nvidia share price has increased by around 31%, proving our prediction correct. Despite Nvidia having yet to resume business activities in China, the company delivered strong results in the second quarter.
Looking ahead, Nvidia appears well-positioned to build on this momentum, with numerous opportunities that could drive further growth and enhance shareholder returns. Moreover, as global demand for AI accelerators expands, the company is likely to offset many of the risks tied to its limited presence in China, potentially paving the way for its stock to reach new record levels. It comes as little surprise that Nvidia’s guidance for the next quarter topped consensus expectations, reflecting the sustained strength of demand for its chips.
Nvidia’s dominance in the data centre sector is set to grow, with increasing demand for the Blackwell architecture and accelerating shipments of the GB300. The NVL72 is also set to become the preferred system for hyperscalers and major players in the consumer internet sector. The company is projecting Q3 revenue of $54 billion, which exceeds previous estimates of around $52.76 billion.
These figures suggest that the AI boom is showing no signs of slowing down and that Nvidia still has considerable room to expand its business in the years ahead. However, bear in mind that during the most recent earnings call, CEO Jensen Huang identified China as a $50 billion market opportunity. Nvidia's absence from this market inevitably limits the company's broader growth potential.
Although challenges related to China have impacted Nvidia’s outlook and left some investors feeling dissatisfied, the company’s long-term prospects remain robust. Its dominant position in the rapidly growing AI accelerator market, coupled with surging global demand for advanced chips, should offset much of the risk related to China and support sustained double-digit growth in the years ahead. With the stock still trading at an attractive valuation and offering significant potential for growth, there are good reasons to remain confident in Nvidia’s trajectory.
Related Products
Nvidia (USD), one-year daily chart
Nvidia (USD), five-year weekly chart

Macro comments
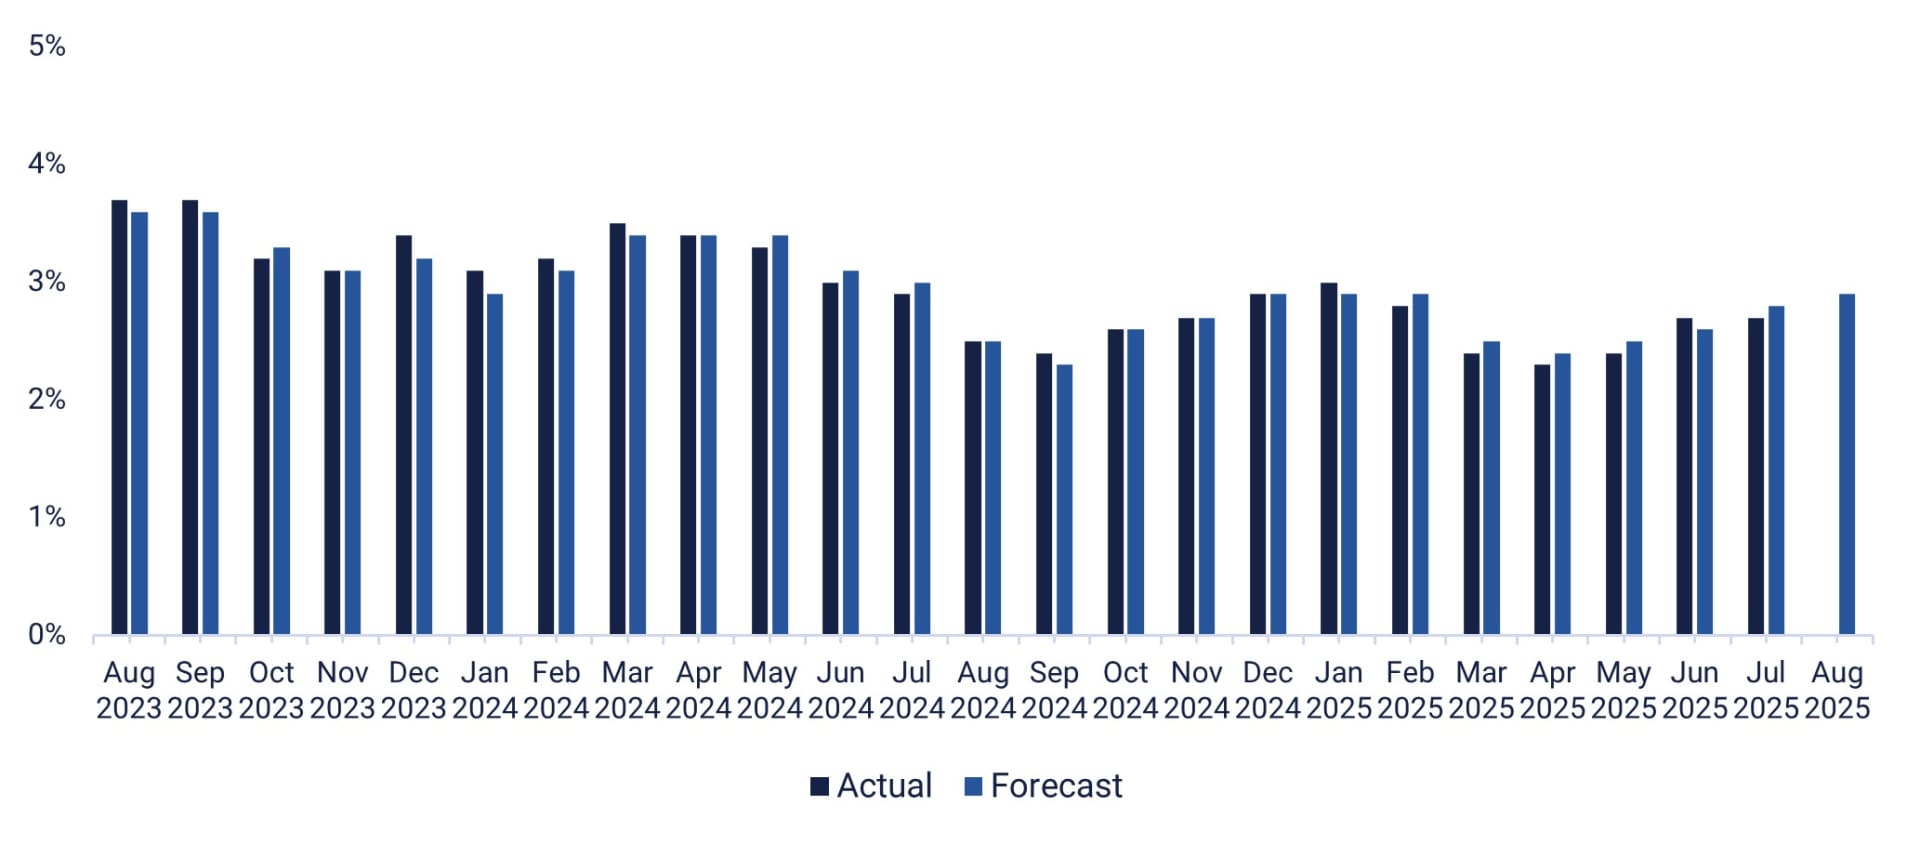
On Friday 5 September, the U.S. non-farm payroll report revealed that only 22,000 new jobs had been created in August, compared to the expected 75,000. Following revisions, an average of around
29,000 new jobs have been created in the U.S. over the last three months. Weak U.S. jobs statistics pave the way for interest rate cuts from the Federal Reserve. The U.S. central bank's dual mandate is to keep inflation low and stable while working towards maximum employment.
Clas Ohlson will report its quarterly results on Wednesday, 10 September. Meko is also holding a capital markets day. Both Clas Ohlson and Meko are listed on the Stockholm Stock Exchange. The day's macroeconomic events will begin earlier in China with the release of the Consumer Price Index and Producer Price Index figures for August. This will be followed by Japan's machinery orders for August and Sweden's industrial orders and household consumption for July. From the U.S., we will receive the producer price index for August and weekly oil inventory statistics (DOE).
On Thursday, 11 September, we will receive interim reports from the Swedish company, Rusta, and the Danish company, Chemometec. Later in the evening, Adobe will publish its interim results from the U.S. Moving on to the macro agenda, we will see Sweden's Consumer Price Index for August, OPEC's and the IEA's monthly oil reports, and an interest rate announcement from the European central bank, followed by a press conference. From the U.S., we will also receive the Consumer Price Index for August, as well as the number of initial jobless claims.
On Friday 12 September, the macro agenda will begin with the release of Japan's July industrial production figures. Next, the U.K. will release its Gross domestic product and July industrial production figures. It will be followed by the August Consumer price index from Germany, France and Spain. The U.S. will also publish the Michigan index for September.
U.S. Consumer Price Index (year-on-year % change), August 2023 to August 2025 (forecast).
Related Products
A trigger is needed while the risk remains on the downside
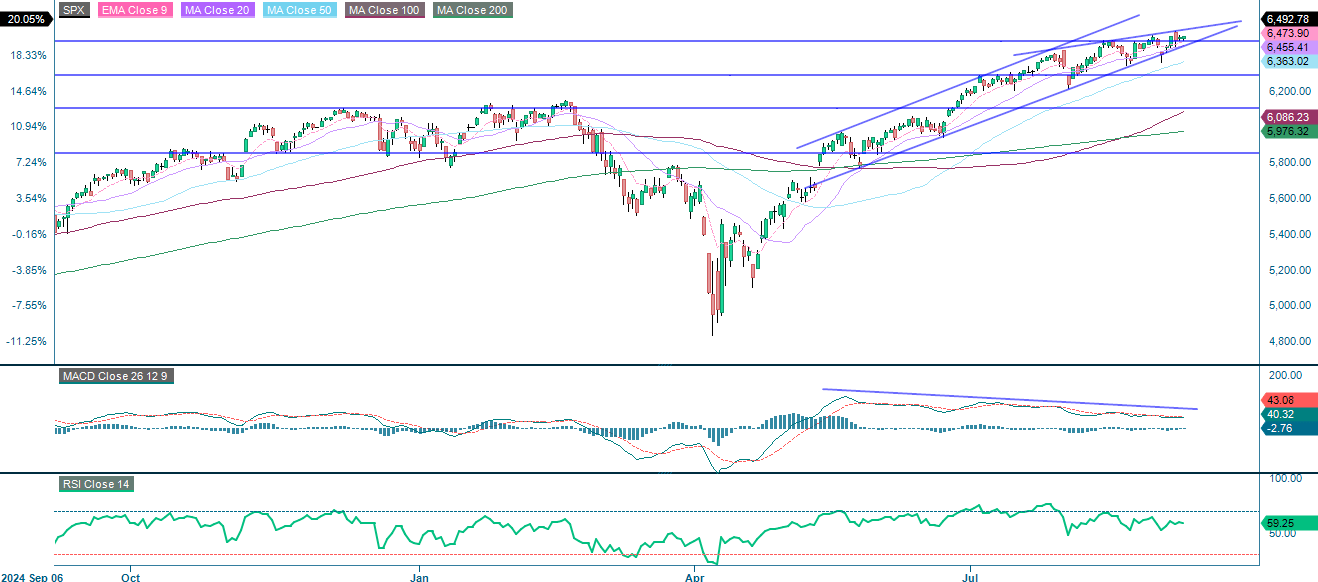
The S&P 500 is in a firm uptrend, trading well above the major moving averages within an ascending channel. The current price is approaching the key resistance level of 6,475–6,500, where profit-taking or a pullback may occur. Momentum is fading, as indicated by bearish divergence in the MACD, which suggests weakening strength despite higher highs. Additionally, the formation of a narrow, short, bearish rising wedge should be noted. Support is found on the downside around 6,455 and 6,360, followed by 6,290.
S&P 500 (in USD), one-year daily chart
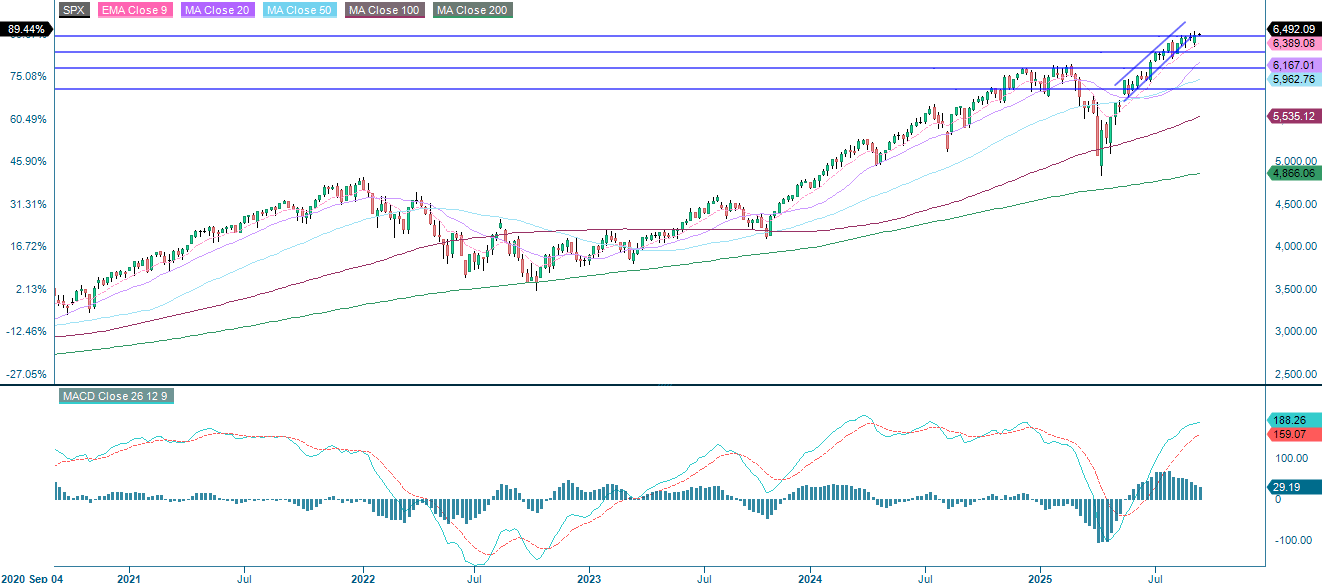
S&P 500 (in USD), weekly five-year chart
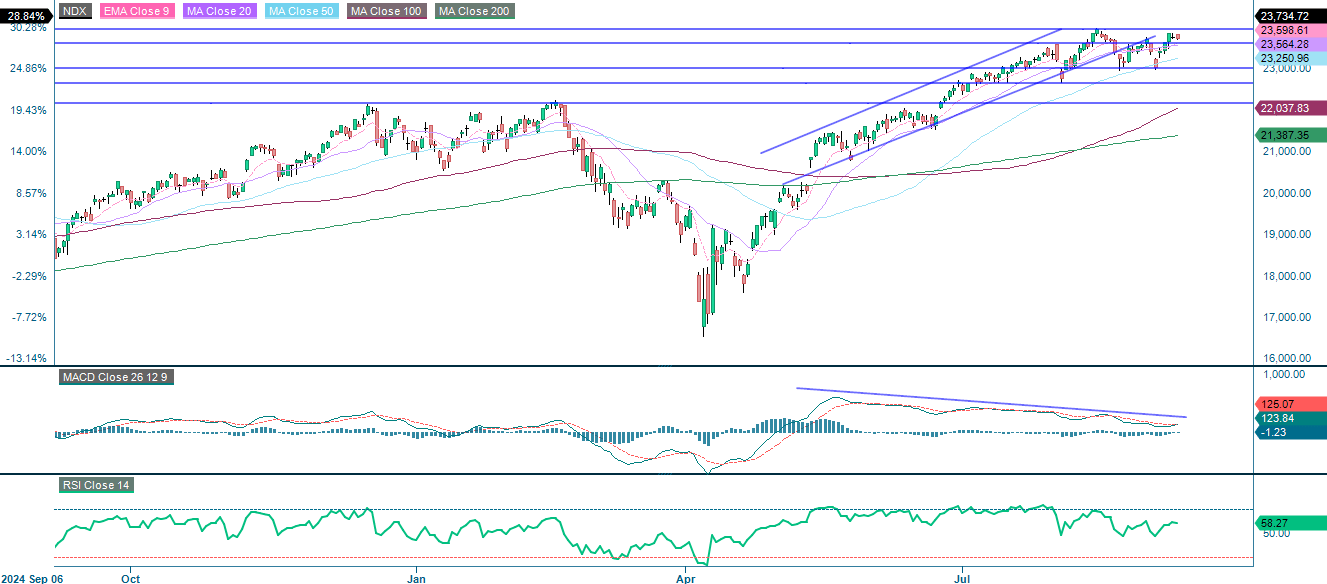
The NASDAQ-100 remains in a bullish trend, trading above all the key moving averages within a neutral channel. The price is currently testing major resistance between 23,600 and 23,945. Support levels are noted at 23,565, 23,250 and 23,000. Momentum signals are softening; the MACD shows bearish divergence, suggesting waning strength.
Related Products
NASDAQ-100 (in USD), one-year daily chart
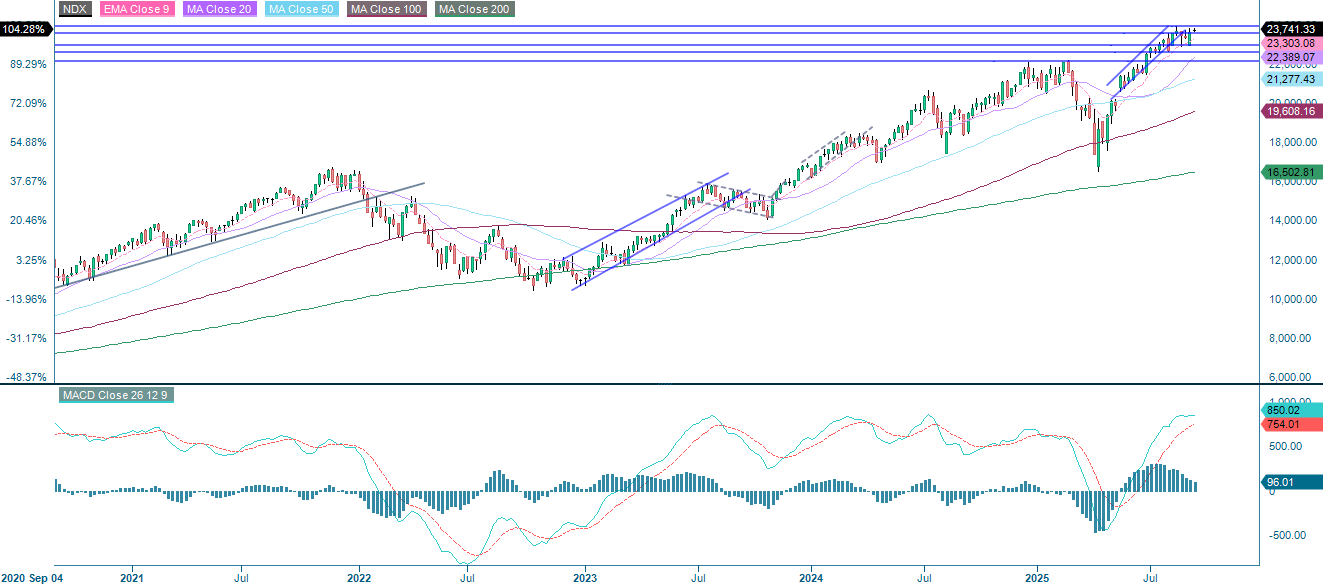
NASDAQ-100 (in USD), weekly five-year chart
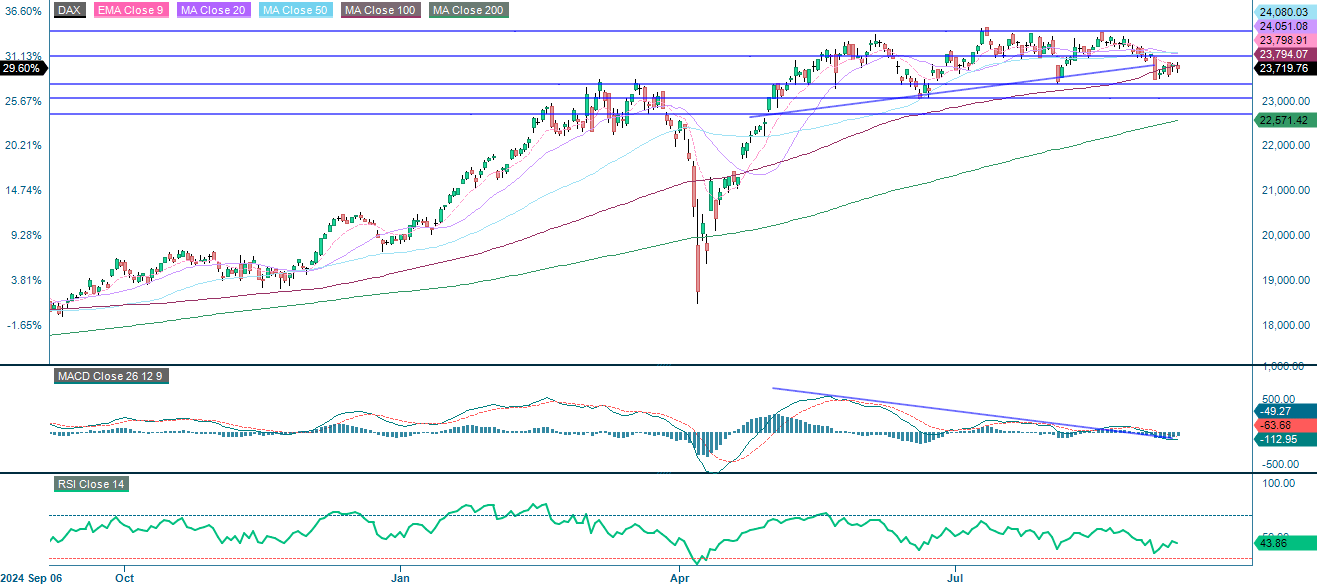
The German DAX has shifted from strong bullish momentum to consolidation. The price is struggling to hold onto the rising MA100, which is acting as the first level of support. The next levels of support are 23,365 and 22,700. Momentum indicators confirm weakness: MACD shows bearish divergence and RSI, at 43.9, signals neutral-to-weak sentiment. The index is closer to oversold than to a rebound. Overall, unless support holds and momentum improves, the index faces continued range-bound or downward pressure.
Related Products
DAX (in EUR), one-year daily chart
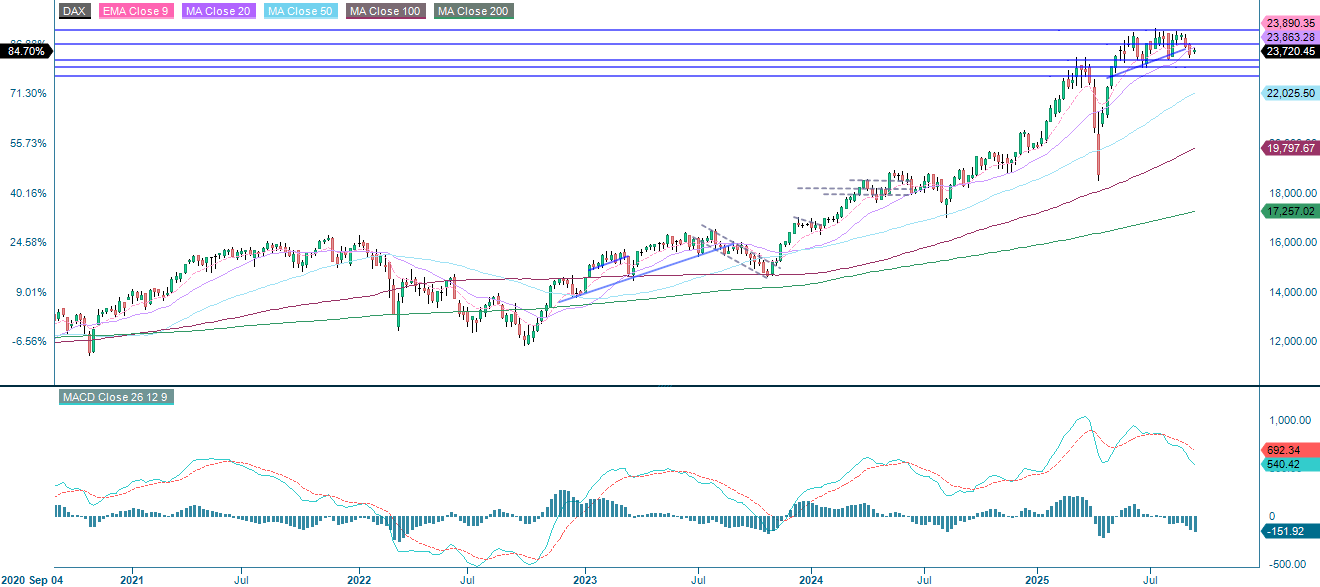
DAX (in EUR), weekly five-year chart
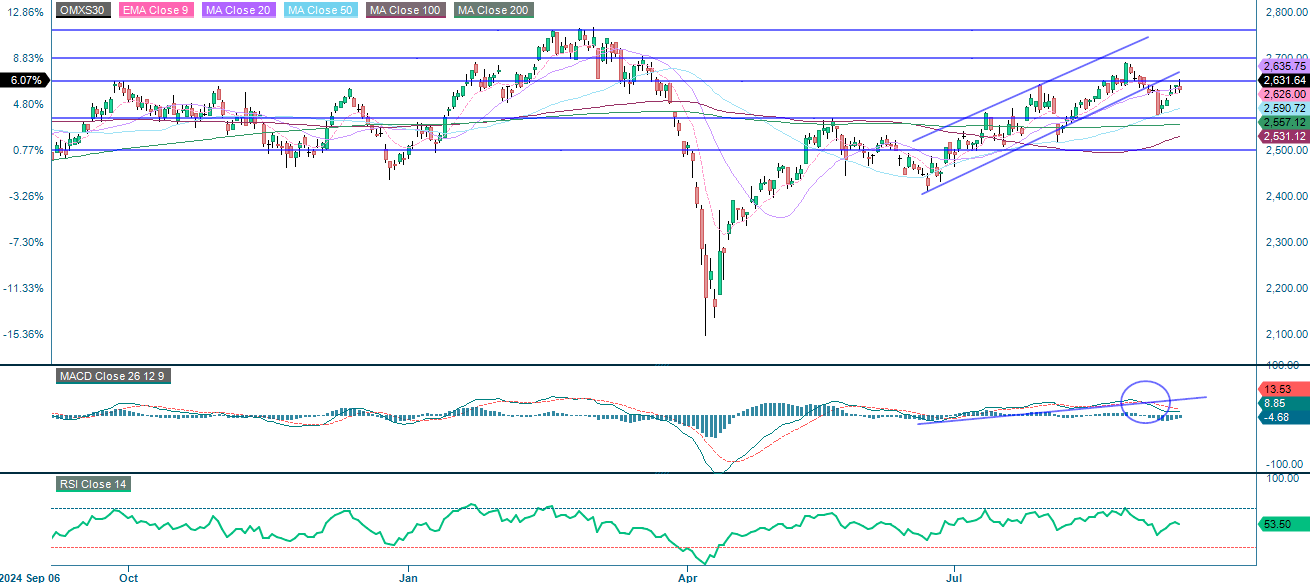
The OMXS30 is in a cautious uptrend and is currently trading at resistance around the 2,650 level, with the next level of resistance at around 2,700. Although MACD recently generated a soft buy signal, momentum remains subdued. Key support levels are MA50, followed by 2,570 and MA200.
Related Products
OMX30 (in SEK), one-year daily chart
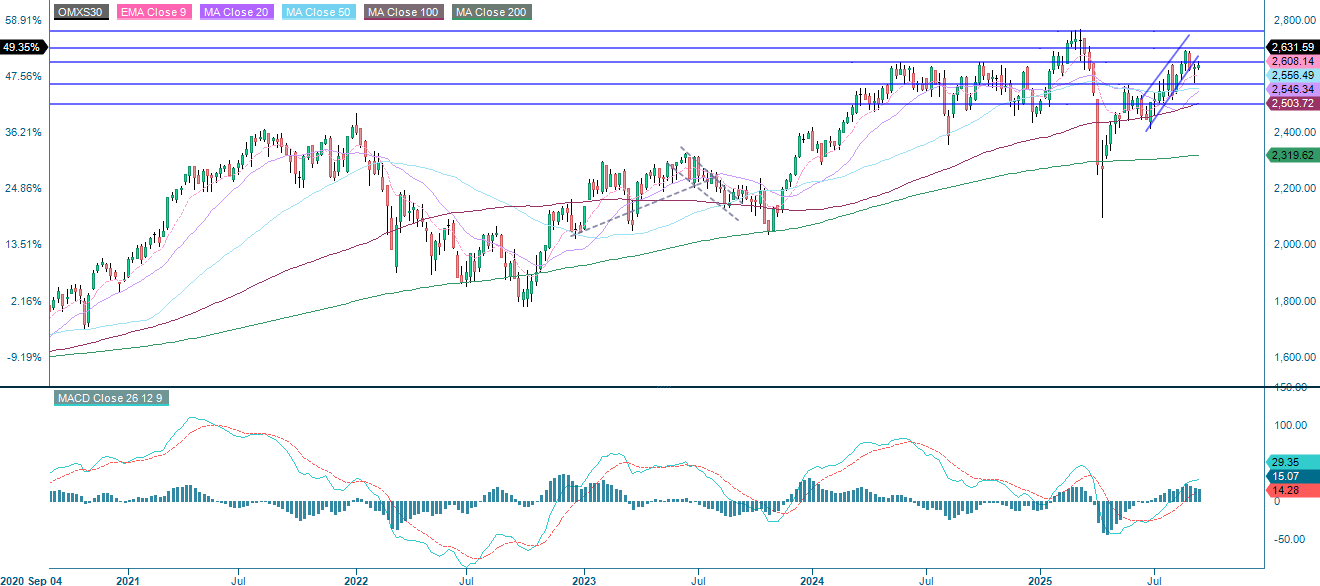
OMX30 (in SEK), weekly five-year chart
The full name for abbreviations used in the previous text:
EMA 9: 9-day exponential moving average
Fibonacci: There are several Fibonacci lines used in technical analysis. Fibonacci numbers are a sequence in which each successive number is the sum of the two previous numbers.
MA20: 20-day moving average
MA50: 50-day moving average
MA100: 100-day moving average
MA200: 200-day moving average
MACD: Moving average convergence divergence
Risks
Credit risk of the issuer:
Investors in the products are exposed to the risk that the Issuer or the Guarantor may not be able to meet its obligations under the products. A total loss of the invested capital is possible. The products are not subject to any deposit protection.
Currency risk:
If the product currency differs from the currency of the underlying asset, the value of a product will also depend on the exchange rate between the respective currencies. As a result, the value of a product can fluctuate significantly.
Market risk:
The value of the products can fall significantly below the purchase price due to changes in market factors, especially if the value of the underlying asset falls. The products are not capital-protected
Product costs:
Product and possible financing costs reduce the value of the products.
Risk with leverage products:
Due to the leverage effect, there is an increased risk of loss (risk of total loss) with leverage products, e.g. Bull & Bear Certificates, Warrants and Mini Futures.
External author:
This information is in the sole responsibility of the guest author and does not necessarily represent the opinion of Bank Vontobel Europe AG or any other company of the Vontobel Group. This information is sponsored by Bank Vontobel Europe AG, which may be a counterparty to transactions involving the financial instruments discussed in this information. The further development of the index or a company as well as its share price depends on a large number of company-, group- and sector-specific as well as economic factors. When forming his investment decision, each investor must take into account the risk of price losses. Please note that investing in these products will not generate ongoing income.
The products are not capital protected, in the worst case a total loss of the invested capital is possible. In the event of insolvency of the issuer and the guarantor, the investor bears the risk of a total loss of his investment. In any case, investors should note that past performance and / or analysts' opinions are no adequate indicator of future performance. The performance of the underlyings depends on a variety of economic, entrepreneurial and political factors that should be taken into account in the formation of a market expectation.
Disclaimer:
This information is neither an investment advice nor an investment or investment strategy recommendation, but advertisement. The complete information on the products (securities) mentioned herein, in particular the structure and risks associated with an investment, are described in the base prospectus, together with any supplements, as well as the final terms relating to the securities. The base prospectus and final terms constitute the solely binding sales documents for the products mentioned herein. It is recommended that potential investors read these documents before making any investment decision. The documents and the key information document are published on the website of the issuer, Vontobel Financial Products GmbH, Bockenheimer Landstrasse 24, 60323 Frankfurt am Main, Germany, on https://prospectus.vontobel.com and are available from the issuer free of charge. The approval of the prospectus should not be understood as an endorsement of the securities. The securities are products that are not simple and may be difficult to understand. This information includes or relates to figures of past performance. Past performance is not a reliable indicator of future performance. This information may only be distributed or published in countries where such distribution or publication is permitted by applicable law. As stated in the relevant base prospectus, the distribution of the securities mentioned in this information is subject to restrictions in certain jurisdictions. This advertisement may not be reproduced or redistributed without prior permission by Vontobel.
© Bank Vontobel Europe AG and / or affiliated companies. All rights reserved.