Focus on the US non-farm payroll figures

This week, the performance of four major US stock indices will be examined, paying particular attention to the small-cap Russell 2000 index. The value of this index has recently increased due to investors' expectations of further interest rate cuts by the Federal Reserve, which could be influenced by the US non-farm payroll figures to be released on Friday, 5 September.
Case of the week: A shift towards US small-cap stocks
Over a five-year period, both the NASDAQ-100 and the S&P 500 outperformed other US stock indices, such as the Dow Jones Industrial Average and the Russell 2000 small-cap index. This was driven mainly by the 'Magnificent Seven' — Apple, Microsoft, Alphabet, Amazon, Nvidia, Meta Platforms and Tesla — as well as other IT companies involved in AI development, such as Palantir.
European stock indices lost momentum over the summer and into the fall, while price rises were concentrated in the Shanghai, Nikkei and US small-cap Russell 2000 stock indices. The graph below illustrates the price development of the four major US stock indices.
Ranked by one-month performance, the one-month, year-to-date (YTD) and five-year performance of US stock indices (in USD)

The Russell 2000 also performed well following President Trump's re-election in November 2024. At the time, it was expected that Trump's proposed tariffs on imports would reduce competition for American companies that primarily sold their goods within the United States. However, the Russell 2000 and the Dow Jones subsequently underperformed compared to the NASDAQ-100 and the S&P 500 after Trump took office in January 2025 and began announcing various tariffs on different countries ahead of negotiations on this matter.
A new phase has begun in which the US has reached an agreement with, for example, the EU on tariff rates. Crucial negotiations with China remain, but an outcome is closer than before. The US's average tariff against the rest of the world has increased from around 2.5% to around 18% since January 1, 2025. This gives US companies an advantage over foreign competitors, particularly in the industrial and raw materials sectors. The USD has also weakened by around 10% against the euro, making it easier for US companies to sell goods and services abroad.
Expectations that the Fed (Federal Reserve) will cut interest rates have caused the Russell 2000 index to rise in recent weeks. While the fixed income market is anticipating a 25-basis point cut on 17 September with 85% to 90% likelihood, the stock market expects further reductions thereafter. President Trump is calling for lower US interest rates. Meanwhile, the Fed board, led by Powell, must balance the weaker US employment market, as evidenced by the nonfarm payroll figures to be announced on Friday, 5 September, with the long-term inflationary effects of the imposed tariffs.
Since January 2025, the ECB (European Central Bank) has lowered its key interest rate from 2.9% to 2.15%, to stimulate growth in the eurozone. The next ECB interest rate announcement is scheduled for 11 September. Consequently, the ECB's key interest rate is now less than half that of the US Federal Reserve's policy rate, which stands at 4.5%.
Related Products
One-year daily chart of the Russell 2000 Index (in USD)

The Russell 2000 Index as an ETF (in USD) on a five-year weekly chart

Macro comments
The most important statistic this week will be the release of the US non-farm payroll figures on Friday 5 September. The recent weakening of the US labour market could influence the Fed's interest rate decision on 17 September and those at future meetings.
Today, Wednesday 3 September, the macro agenda is dominated by the release of August's services PMI figures from Japan, China, Sweden, Spain, Italy, France, Germany, the eurozone and the UK. Germany is also publishing its VDMA (Verband Deutscher Maschinen- und Anlagenbau) machinery orders for July, while the eurozone is presenting its PPI (Producer Price Index) for August 2025. The US will release JOLTS (Job Openings and Labor Turnover Survey) vacancies, July industrial orders, the Fed's Beige Book and weekly oil inventories (Department of Energy). An interim report from Salesforce is also expected on Wednesday.
On Thursday, 4 September, traffic and sales volume reportsare expected from Norwegian and Volvo Cars respectively, both covering the month of August. Moving on to the macro agenda, the August CPI (Consumer Price Index) figures from Sweden and Switzerland are expected. From the Eurozone, the July retail sales figures are anticipated. From the US, the following: Challenger jobless claims are expected; the ADP (Automatic Data Processing) private employment report for August; the trade balance for July; initial jobless claims; and the services PMI (Purchasing Mangers´ Index) for August.
The release of macroeconomic data begins on Friday 5 September with the publication of Japanese household consumption figures for July. A few hours later, data on UK retail sales and German industrial orders for July will be released, alongside Eurozone GDP (Gross Domestic Product) and employment figures for the second quarter. Next, in North America, Canadian unemployment figures and US non-farm payroll figures for August will be published. Consensus forecasts predict the creation of 74,000 new jobs in the US (see the graph below).
US non-farm payrolls (in thousands of new jobs), August 2023 to August 2025 (forecast)

Know your support levels that must hold
The S&P 500 is still in an upward trend but is currently approaching the support level of 6,290–6,340 after pulling back from recent highs. MACD shows bearish divergence, accompanied by a negative histogram. Meanwhile, RSI (Relative Strength Index) at 48.65 signals waning bullish momentum. Breaking below 6,290 could trigger further declines towards 6,200 or 6,100. While the broader trend remains positive, these technical signals suggest short-term downside risk and weakening momentum. Therefore, support levels should be monitored closely for signs of stabilisation or a deeper correction.
Related Products
S&P 500 (in USD), one-year daily chart

S&P 500 (in USD), weekly five-year chart

The NASDAQ-100 remains in a long-term uptrend but has broken below its short-term channel. It is now testing levels between 23,000 and 23,111. Further declines could target 22,645, followed by 22,150. Despite its broader uptrend, the index faces heightened short-term risk, with key support levels and momentum indicators being crucial for signs of stabilisation or a deeper correction.
Related Products
NASDAQ-100 (in USD), one-year daily chart

NASDAQ-100 (in USD), weekly five-year chart

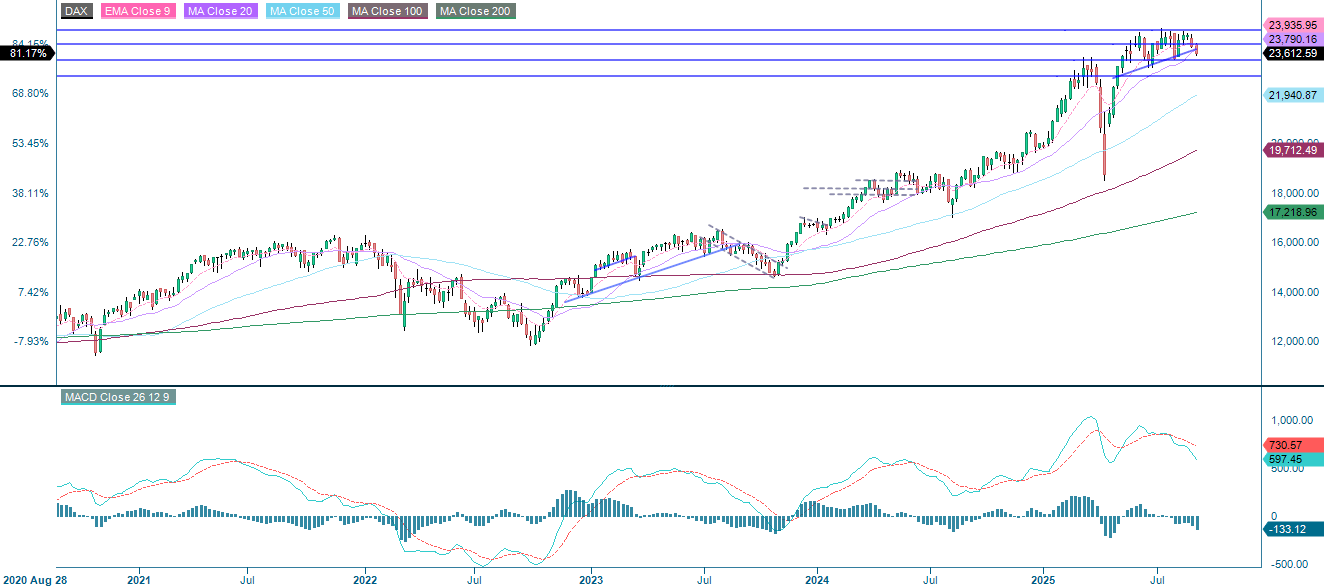
The DAX has broken through key short-term support levels, indicating a loss of short-term momentum. Meanwhile, MACD shows bearish divergence and remains negative, further reinforcing the weakness. The index is currently approaching the next support level, which is found around 23,365. This is followed by support levels around 23,060 and 22,700. If support does not hold, bearish momentum may persist, so caution is advised as the index faces heightened downside risk.
Related Products
DAX (in EUR), one-year daily chart

DAX (in EUR), weekly five-year chart
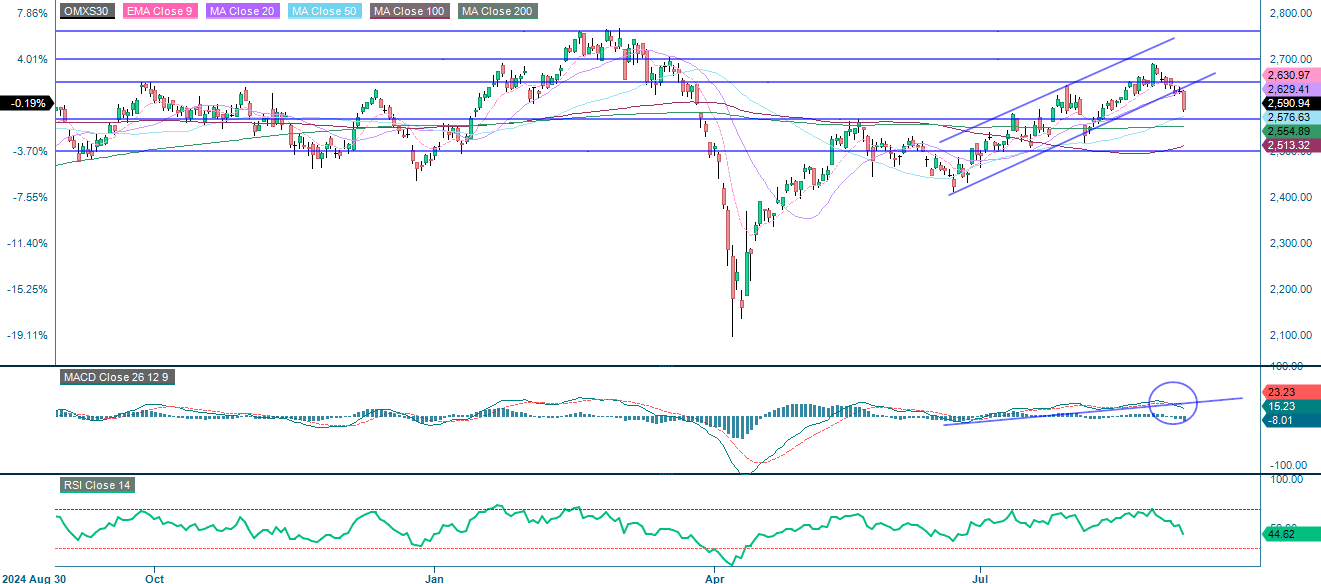
The OMXS30 has broken below its upward trend channel and key short-term moving averages. These signals weakening bullish momentum and an increase in bearish risk. A recent bearish crossover in the MACD and a declining RSI support the potential for further downside. Key support levels are around 2,570, 2,555, 2,510 and 2,500. Failure to hold these levels could confirm a bearish reversal, whereas a rebound could stabilise sentiment. Overall, technical indicators suggest caution, with negative momentum and increasing selling pressure, though neither is yet extreme.
Related Products
OMX30 (in SEK), one-year daily chart
OMX30 (in SEK), weekly five-year chart

The full name for abbreviations used in the previous text:
EMA 9: 9-day exponential moving average
Fibonacci: There are several Fibonacci lines used in technical analysis. Fibonacci numbers are a sequence in which each successive number is the sum of the two previous numbers.
MA20: 20-day moving average
MA50: 50-day moving average
MA100: 100-day moving average
MA200: 200-day moving average
MACD: Moving average convergence divergence
Risks
Credit risk of the issuer:
Investors in the products are exposed to the risk that the Issuer or the Guarantor may not be able to meet its obligations under the products. A total loss of the invested capital is possible. The products are not subject to any deposit protection.
Currency risk:
If the product currency differs from the currency of the underlying asset, the value of a product will also depend on the exchange rate between the respective currencies. As a result, the value of a product can fluctuate significantly.
External author:
This information is in the sole responsibility of the guest author and does not necessarily represent the opinion of Bank Vontobel Europe AG or any other company of the Vontobel Group. This information is sponsored by Bank Vontobel Europe AG, which may be a counterparty to transactions involving the financial instruments discussed in this information. The further development of the index or a company as well as its share price depends on a large number of company-, group- and sector-specific as well as economic factors. When forming his investment decision, each investor must take into account the risk of price losses. Please note that investing in these products will not generate ongoing income.
The products are not capital protected, in the worst case a total loss of the invested capital is possible. In the event of insolvency of the issuer and the guarantor, the investor bears the risk of a total loss of his investment. In any case, investors should note that past performance and / or analysts' opinions are no adequate indicator of future performance. The performance of the underlyings depends on a variety of economic, entrepreneurial and political factors that should be taken into account in the formation of a market expectation.
Market risk:
The value of the products can fall significantly below the purchase price due to changes in market factors, especially if the value of the underlying asset falls. The products are not capital-protected
Product costs:
Product and possible financing costs reduce the value of the products.
Risk with leverage products:
Due to the leverage effect, there is an increased risk of loss (risk of total loss) with leverage products, e.g. Bull & Bear Certificates, Warrants and Mini Futures.
Disclaimer:
This information is neither an investment advice nor an investment or investment strategy recommendation, but advertisement. The complete information on the products (securities) mentioned herein, in particular the structure and risks associated with an investment, are described in the base prospectus, together with any supplements, as well as the final terms relating to the securities. The base prospectus and final terms constitute the solely binding sales documents for the products mentioned herein. It is recommended that potential investors read these documents before making any investment decision. The documents and the key information document are published on the website of the issuer, Vontobel Financial Products GmbH, Bockenheimer Landstrasse 24, 60323 Frankfurt am Main, Germany, on https://prospectus.vontobel.com and are available from the issuer free of charge. The approval of the prospectus should not be understood as an endorsement of the securities. The securities are products that are not simple and may be difficult to understand. This information includes or relates to figures of past performance. Past performance is not a reliable indicator of future performance. This information may only be distributed or published in countries where such distribution or publication is permitted by applicable law. As stated in the relevant base prospectus, the distribution of the securities mentioned in this information is subject to restrictions in certain jurisdictions. This advertisement may not be reproduced or redistributed without prior permission by Vontobel.
© Bank Vontobel Europe AG and / or affiliated companies. All rights reserved.