Anticipated interest rate cuts have boosted US small-caps


The price of live cattle (LC futures) has increased by 25% year-to-date, with the BBQ season and strained supply being two of the contributing factors. However, live cattle prices could start to taper off as we head into the colder autumn and winter months. The speech delivered by Federal Reserve Chairman Powell at Jackson Hole on Friday, 22 August, was well received by investors in the U.S. stock and bond markets. Expectations of a rate cut at the next Fed meeting have increased significantly as a result.
Case of the week: Cattle has been steady, will Autumn make it heavier?
As predicted in our latest analysis of cattle in January, live cattle have been a steady performer in 2025. Year-to-date, LC futures have increased by 25%, rising to 31% year on year. One of the main contributing factors is the contractionary stage of the cattle cycle, which can last between 10 and 14 years. Combined with the threat of New World screwworm, which is currently experiencing an outbreak in Mexico, stable demand is meeting fragile and slipping supply. However, seasonality could dampen futures prices during the colder six-month period ahead.
As previously mentioned, cattle farming is now more efficient than ever. On average, cattle live for 468 days, compared to 609 days in 1977. Additionally, the average carcass now yields 28% more beef, meaning the same quantity of beef can be produced using 69.9% fewer animals and 81.4% less feed. The cattle cycle, which usually lasts ten years from peak to trough, aligns with previously observed contraction cycles. In practice, this means that the size of the national cattle herd is shrinking. It is likely that this cycle is nearing its end, with producers retaining more heifers to increase herd size. However, it will take time for these effects to manifest and impact the balance of supply and demand.
Comparing cattle cycles from 1979 to the present day

Over a shorter timeframe of around a year, cattle prices display a seasonal effect. Due to when beef is usually consumed, cattle prices tend to peak in late spring and early summer. In other words, prices increase in line with the frequency of barbecues. Consequently, during autumn and winter, prices fall in favour of pork and ham, which are often consumed in Christian countries during the holiday season. However, this seasonal pattern is also influenced by long-term factors, such as changing demographics and customs. According to the latest 'Cattle on Feed' report from the U.S. Department of Agriculture, July placements were 6.11% below last year at 1.598 million head. Marketings were down 5.71% at the same time, and on-feed inventory was down 1.56% at 10.922 million head. Consequently, beef storage was also lower year on year. The reduced supply is further exacerbated by the outbreak of New World screwworm (NWS) in Mexico. Although there was some border tension last year as well, the recent outbreak caused the border to close in May. Meanwhile, the U.S. Department of Agriculture has announced plans to build a facility to produce sterile flies. As NWS is caused by parasitic flies whose larvae feed on warm-blooded mammals, this could impact the disease's ability to re-enter the USA and cause damage to livestock herds.
Overall, although Trump tariffs could impact the situation at any time, futures prices have been steadily increasing for a while now. Factors contributing to the steady increase in prices include BBQ season and strained supplies, among others. However, it is not certain that prices will continue to rise over the remainder of 2025. In fact, many factors could cause prices to fall. Thus, one could speculate that Live Cattle prices will start to taper off as a colder autumn and winter months are expected, as the cattle cycle draws to a close and initiatives for NWS management are put into place.
Related Products
LC October-25 (USD/Lbs), one-year daily chart

LC October-25 (USD/Lbs), five-year weekly chart

Macro comments
On Friday August 22, the U.S. stock markets saw a sharp rise. Jerome Powell's speech in Jackson Hole was well received. The small-cap Russell 2000 index performed the strongest, rising by 3.9%. Powell indicated that the Fed may need to act due to the weaker labour market. The likelihood of a 25-basis point interest rate cut at the upcoming monetary policy meeting increased from 75% before the speech to between 85 and 89% afterwards.
This week, all eyes are on NVIDIA's quarterly report on Wednesday 27 August and U.S. Personal consumption expenditures inflation data on Friday 29 August. On Wednesday, 27 August, interim reports from the U.S. companies NVIDIA and CrowdStrike are expected. Today's macroeconomic agenda is short and begins with the release of Chinese industrial company earnings for July. This is followed by the release of Germany's GfK consumer confidence figures for September. From the U.S., we will receive the weekly oil inventory report from the Department of Energy.
On Thursday, 28 August, the Swedish companies Elekta and Lundbergs, as well as the U.S. company Dell Technologies, are scheduled to release their quarterly results. The day will begin with the release of Sweden's July trade balance. This will be followed by the publication of the National institute of economic and social research (NIESR), August Swedish business survey. The Eurozone's August business survey is also expected. The U.S. will release Q2 Gross domestic product figures (second reading), initial jobless claims, pending home sales for July and the Kansas City Fed index for August.
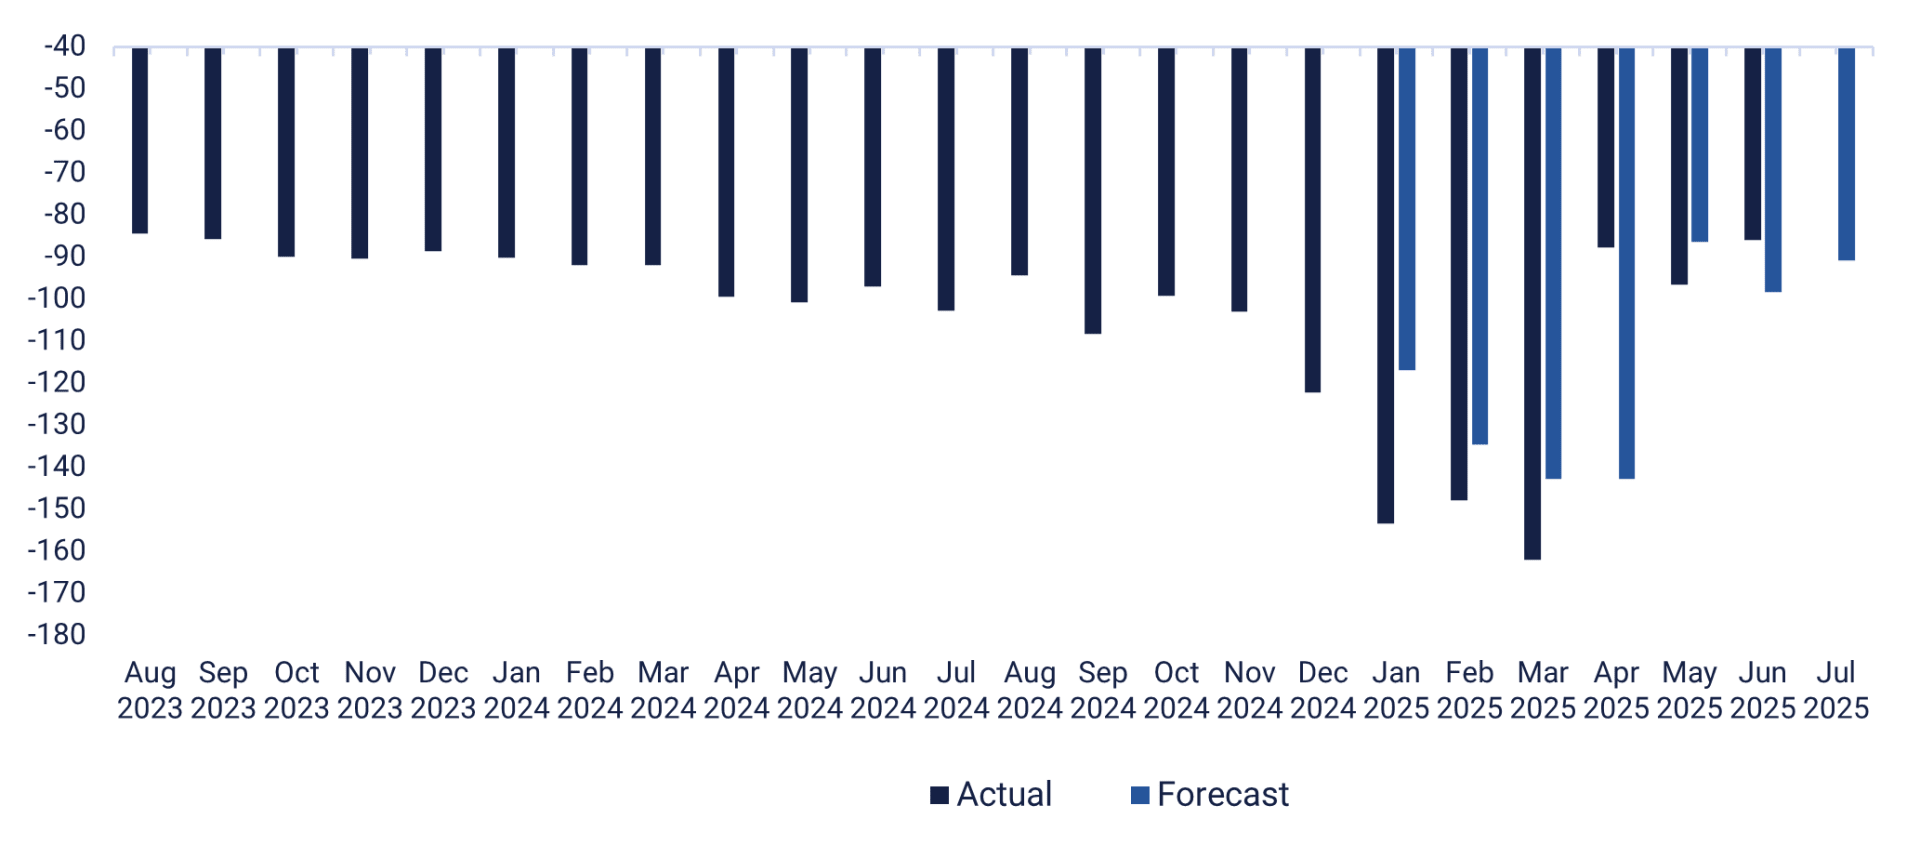
On Friday August 29, the macroeconomic agenda will begin with the publication of Japan's July unemployment, industrial production and retail sales figures. A few hours later, Sweden will publish its July retail sales figures and its Q2 Gross domestic product (GDP) figures. Germany will publish its retail sales and import prices for July, as well as its Consumer price index (CPI) and unemployment figures for August. France will also release its CPI figures for August and GDP figures for Q2. Spain and Italy will release their August CPI figures, with Italy also releasing its Q2 GDP figures. Turning to North America, Canada will release its July GDP figure, while the US will report on private consumption and inflation (PCE), the goods trade balance (see graph below) and wholesale inventories for July. Furthermore, the United States will release the Chicago Purchasing managers index and the Michigan index for August. Alibaba is scheduled to announce its Q2 2025 results on Friday.
U.S. goods trade balance (in billions of USD), August 2023 to July 2025 (forecast)
Has the short-term risk moved towards the downside?
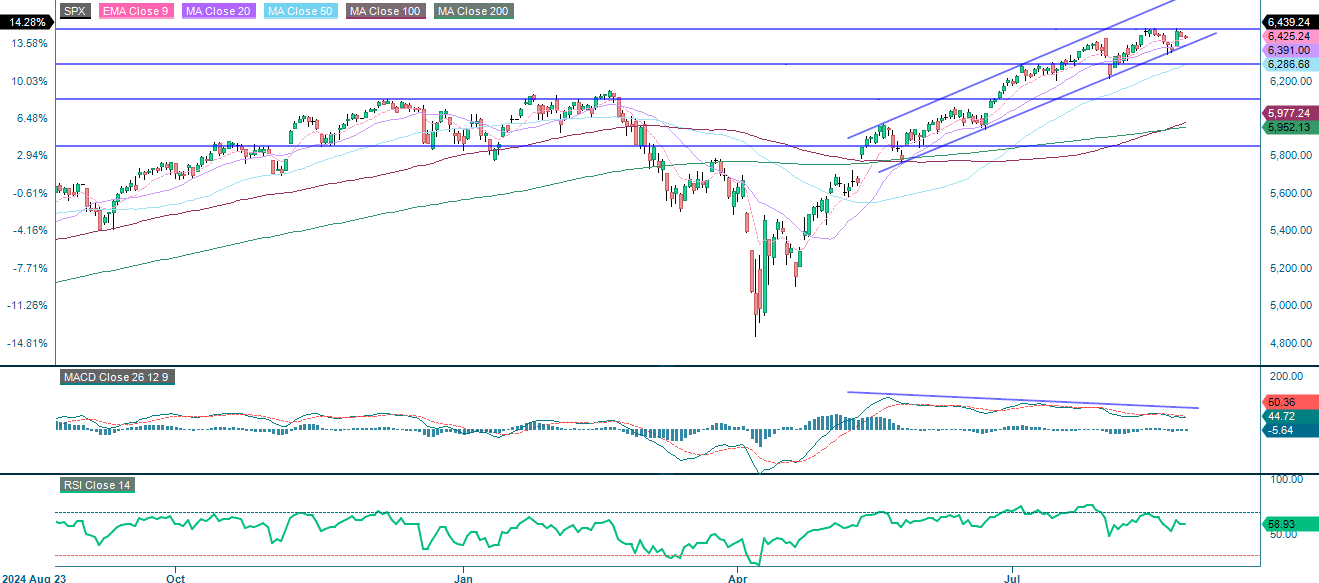
The S&P 500 remains in a strong uptrend. It is currently trading above all major moving averages and within a rising channel. Support is provided by the MA20, which is currently at 6,391. This is followed by the trend line, the MA50, and 6,290. Recent price action shows resistance near 6,475, with signs of slowing momentum as indicated by bearish MACD divergence. While the broader trend is bullish, the rally appears to be losing momentum, making short-term consolidation or a modest pullback more likely. A break above 6,475 would reinforce upward momentum.
Related Products
S&P 500 (in USD), one-year daily chart
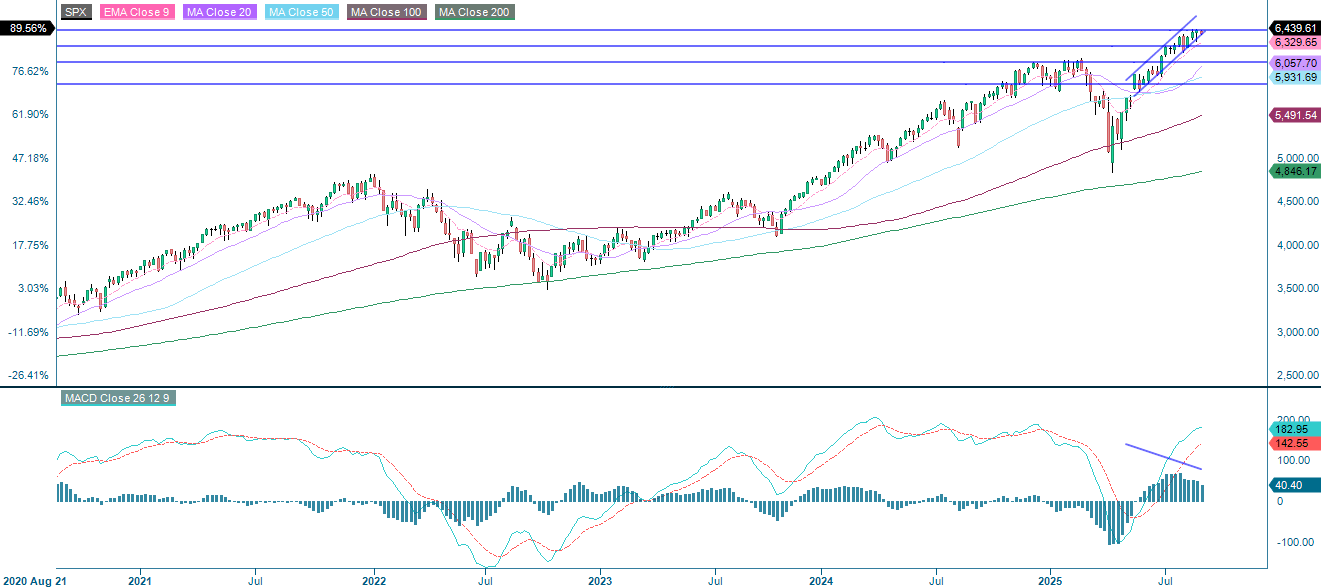
S&P 500 (in USD), weekly five-year chart
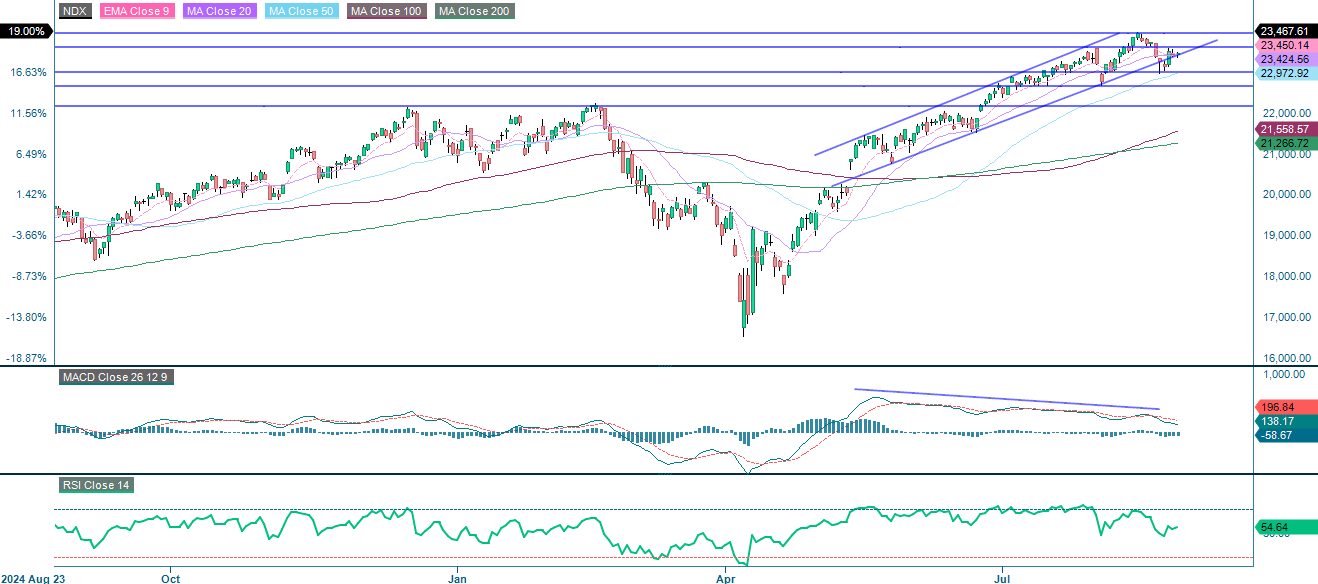
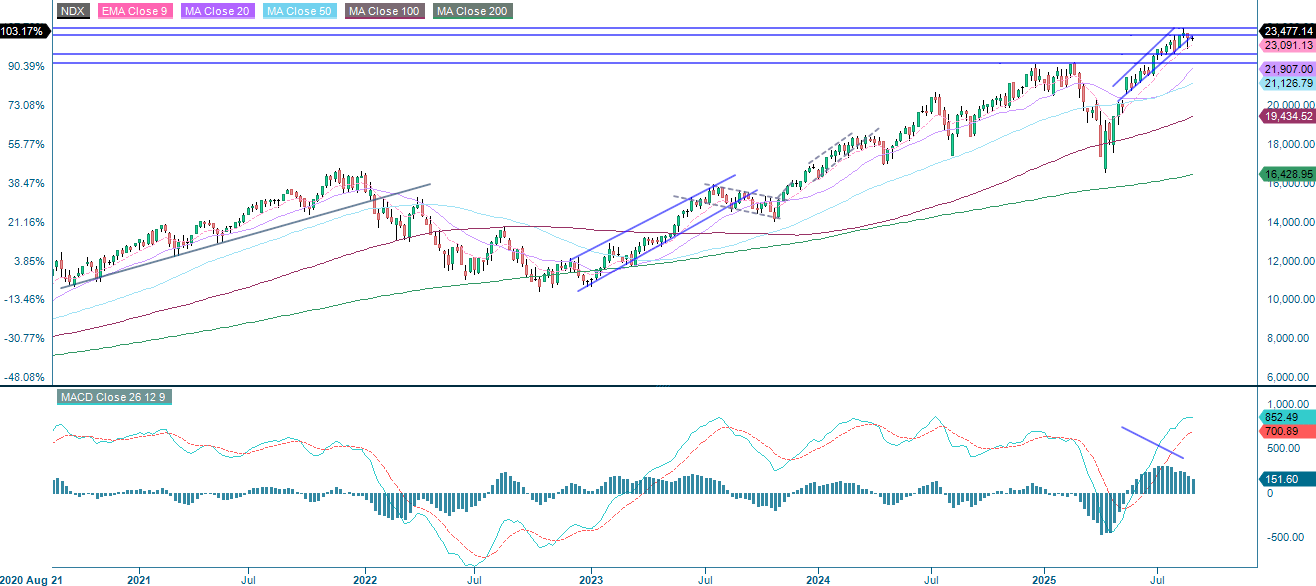
The NASDAQ-100 remains in an uptrend, but momentum is weakening. A bearish MACD divergence creates a risk of short-term consolidation or correction. Strong resistance is found at 23,425. The next support levels are found at around 23,000, 22,645 and 22,150. Conversely, a decisive break above 24,000 would signal renewed strength.
Related Products
NASDAQ-100 (in USD), one-year daily chart
NASDAQ-100 (in USD), weekly five-year chart
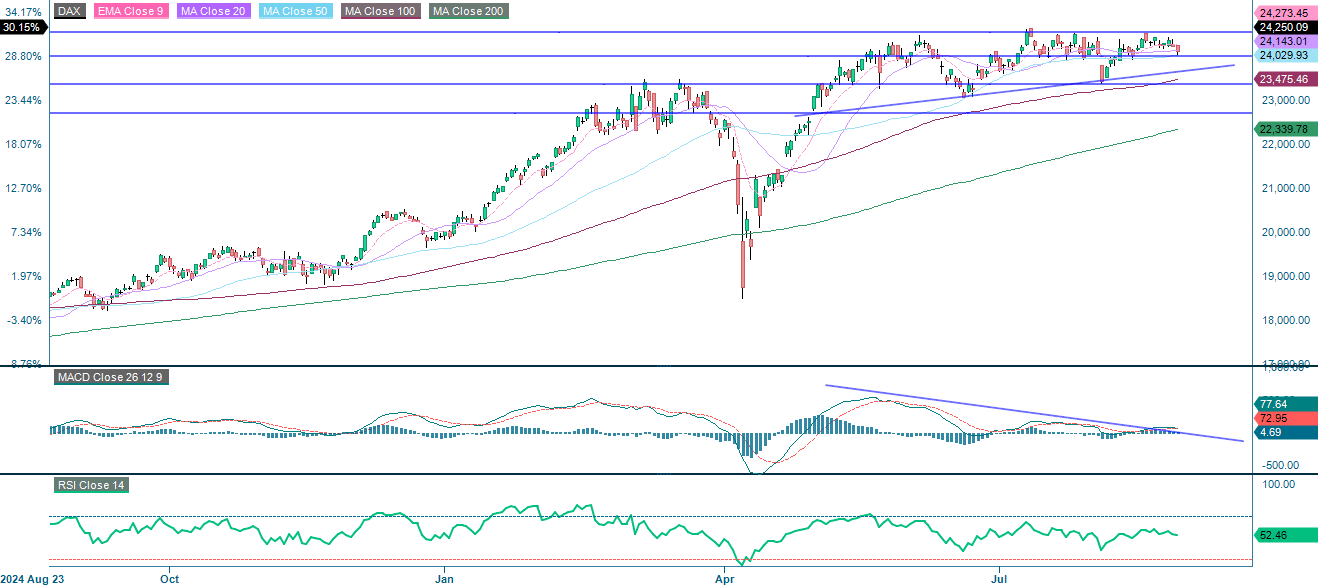
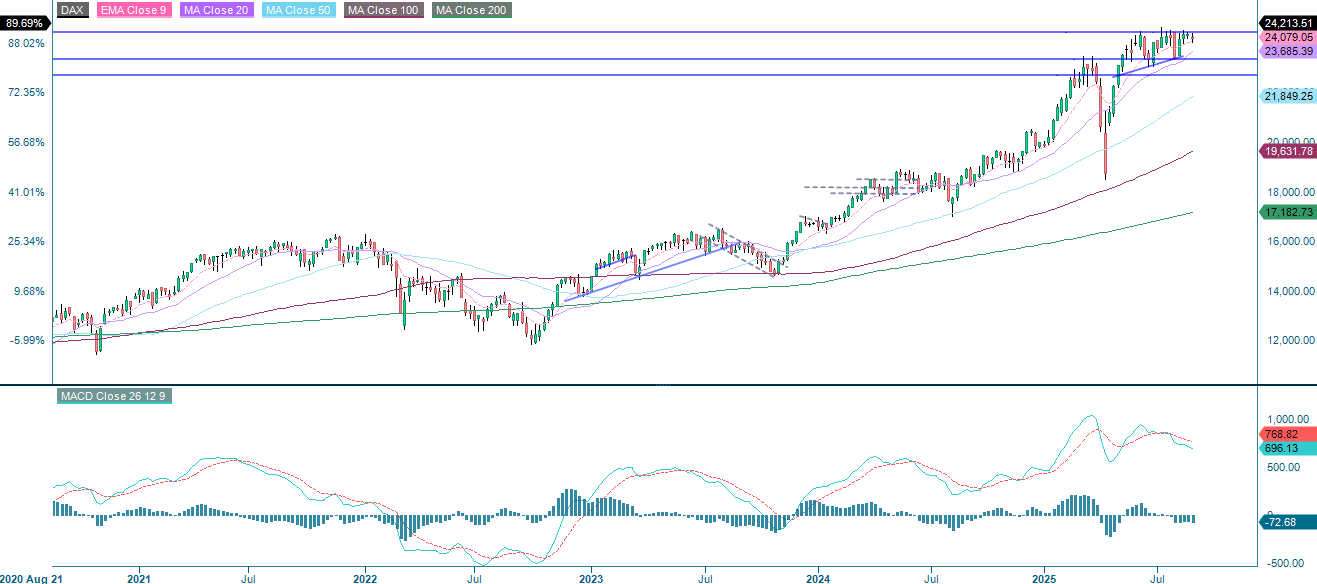
In Europe, the DAX index remains in a long-term uptrend, sitting above all major moving averages, but it is currently consolidating within a trading range between 24,000 and 24,550. Failures to break above the 24,550-resistance level highlight the challenges of moving upwards. Therefore it is important to keep track of the support levels at 24,000, the rising trend line, MA100 and 23,365. Overall, the index is range-bound with short-term downside risks. A move below 24,000 could trigger further corrective pressure, whereas a breakout above 24,550 would be required for the prior rally to resume.
Related Products
DAX (in EUR), one-year daily chart
DAX (in EUR), weekly five-year chart
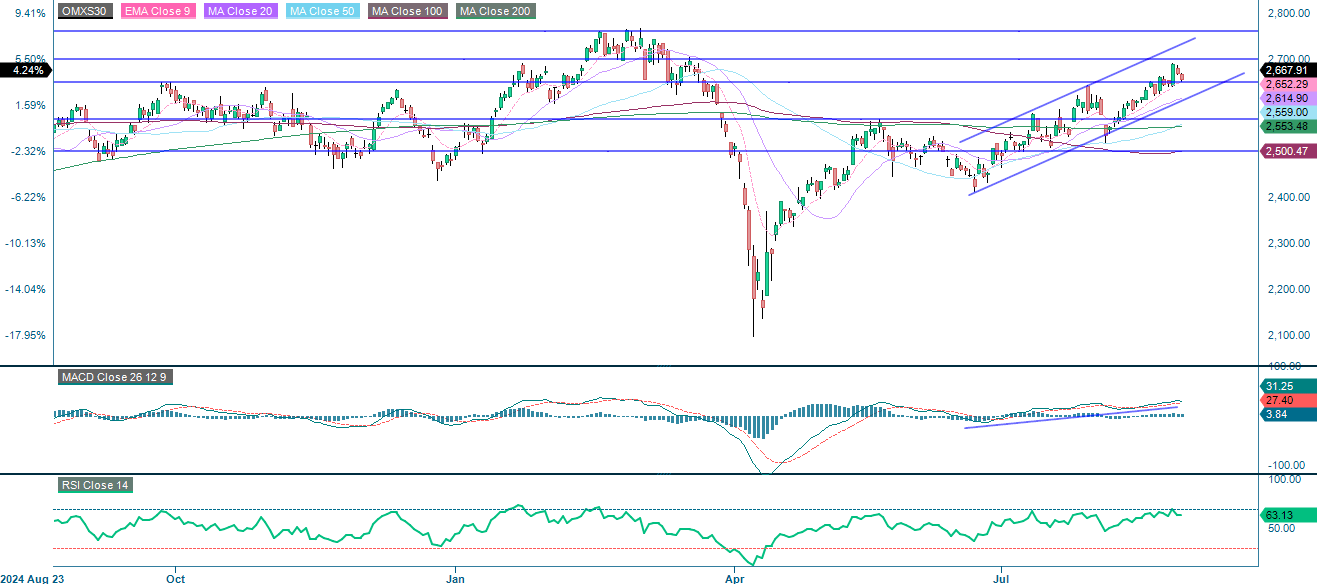
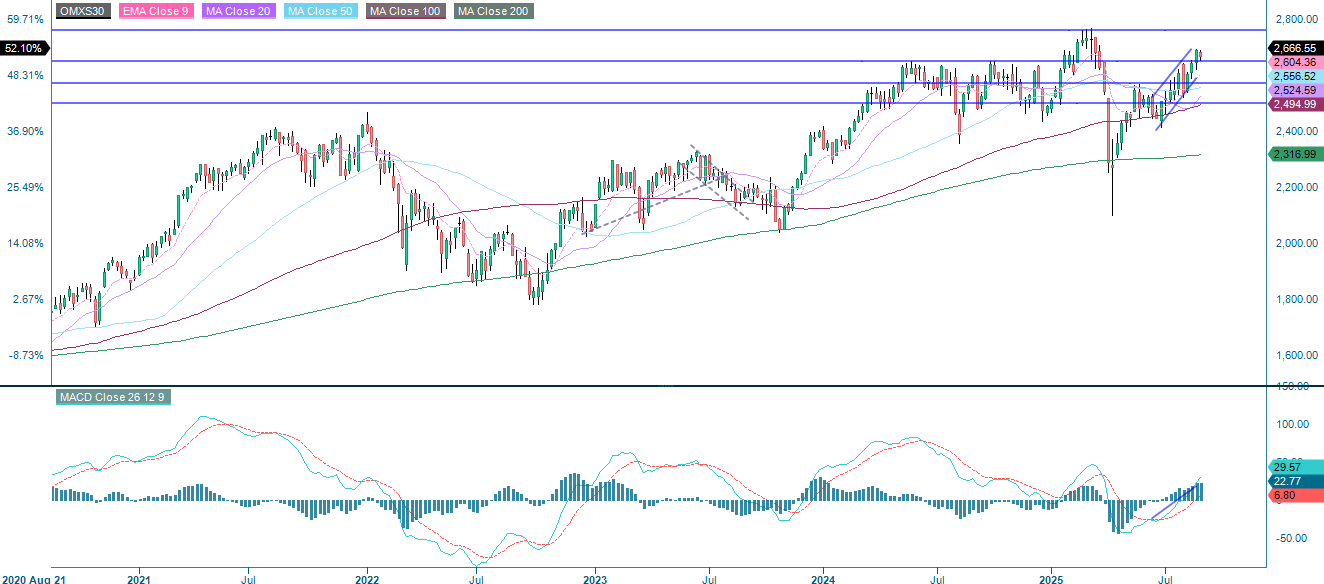
The OMXS30 index is still in a strong short-term uptrend, trading above its EMA9, MA20 and MA50 within an ascending channel. Overall, the technical outlook is bullish. However, although the MACD remains positive, it is flattening, which hints at slowing momentum. Meanwhile, resistance is emerging around 2,700, with a further key level near 2,760. This suggests a possible period of consolidation. Strong support levels are found at 2,650 and 2,570, with additional support at 2,500.
Related Products
OMX30 (in SEK), one-year daily chart
OMX30 (in SEK), weekly five-year chart
The full name for abbreviations used in the previous text:
EMA 9: 9-day exponential moving average
Fibonacci: There are several Fibonacci lines used in technical analysis. Fibonacci numbers are a sequence in which each successive number is the sum of the two previous numbers.
MA20: 20-day moving average
MA50: 50-day moving average
MA100: 100-day moving average
MA200: 200-day moving average
MACD: Moving average convergence divergence
Risks
Credit risk of the issuer:
Investors in the products are exposed to the risk that the Issuer or the Guarantor may not be able to meet its obligations under the products. A total loss of the invested capital is possible. The products are not subject to any deposit protection.
Currency risk:
If the product currency differs from the currency of the underlying asset, the value of a product will also depend on the exchange rate between the respective currencies. As a result, the value of a product can fluctuate significantly.
Market risk:
The value of the products can fall significantly below the purchase price due to changes in market factors, especially if the value of the underlying asset falls. The products are not capital-protected
Product costs:
Product and possible financing costs reduce the value of the products.
Risk with leverage products:
Due to the leverage effect, there is an increased risk of loss (risk of total loss) with leverage products, e.g. Bull & Bear Certificates, Warrants and Mini Futures.
External author:
This information is in the sole responsibility of the guest author and does not necessarily represent the opinion of Bank Vontobel Europe AG or any other company of the Vontobel Group. This information is sponsored by Bank Vontobel Europe AG, which may be a counterparty to transactions involving the financial instruments discussed in this information. The further development of the index or a company as well as its share price depends on a large number of company-, group- and sector-specific as well as economic factors. When forming his investment decision, each investor must take into account the risk of price losses. Please note that investing in these products will not generate ongoing income.
The products are not capital protected, in the worst case a total loss of the invested capital is possible. In the event of insolvency of the issuer and the guarantor, the investor bears the risk of a total loss of his investment. In any case, investors should note that past performance and / or analysts' opinions are no adequate indicator of future performance. The performance of the underlyings depends on a variety of economic, entrepreneurial and political factors that should be taken into account in the formation of a market expectation.
Disclaimer:
This information is neither an investment advice nor an investment or investment strategy recommendation, but advertisement. The complete information on the products (securities) mentioned herein, in particular the structure and risks associated with an investment, are described in the base prospectus, together with any supplements, as well as the final terms relating to the securities. The base prospectus and final terms constitute the solely binding sales documents for the products mentioned herein. It is recommended that potential investors read these documents before making any investment decision. The documents and the key information document are published on the website of the issuer, Vontobel Financial Products GmbH, Bockenheimer Landstrasse 24, 60323 Frankfurt am Main, Germany, on https://prospectus.vontobel.com and are available from the issuer free of charge. The approval of the prospectus should not be understood as an endorsement of the securities. The securities are products that are not simple and may be difficult to understand. This information includes or relates to figures of past performance. Past performance is not a reliable indicator of future performance. This information may only be distributed or published in countries where such distribution or publication is permitted by applicable law. As stated in the relevant base prospectus, the distribution of the securities mentioned in this information is subject to restrictions in certain jurisdictions. This advertisement may not be reproduced or redistributed without prior permission by Vontobel.
© Bank Vontobel Europe AG and / or affiliated companies. All rights reserved.