Investors remain optimistic


This week's case concerns the extremely high valuation of Palantir's stock compared to that of similar companies, such as Salesforce. In our view, the situation is reminiscent of internet stock valuations just before the year 2000. Investors will mainly be focusing on the purchasing managers' indices for August from the US, Europe, Japan, and India this week.
Case of the week: Palantir moving into bubble territory?
Palantir Technologies, Inc. has been delivering strong results as U.S. businesses increasingly adopt AI software to boost efficiency. However, despite the company’s impressive growth prospects, its high valuation may be challenging to justify, echoing the difficulties encountered by many internet stocks after the bubble burst in the early 2000s.
Palantir’s valuation has reached such elevated levels that the cost of its stock-based compensation (SBC) seems disproportionate to the company’s financial performance. Over the past year, the enterprise AI software provider has issued an additional 148 million shares, bringing the total number of diluted shares to 2.56 billion.
Despite being projected to generate only $4.15 billion in revenue, this dilution has effectively added close to $28 billion in market value. In other words, the value created through stock-based compensation is about seven times higher than the company’s expected sales, which is higher than the price-to-sales multiple of major software firms like Salesforce (customer relationship management). Moreover, this figure only reflects the impact of stock options and restricted stock units awarded to executives and key employees.
Although share dilution increased by around 6% year-on-year — from 2.41 billion shares in the second quarter of last year — the impact is significant given the company’s valuation. With a fully diluted market capitalisation of around $474 billion, Palantir is trading at over 100 times sales, while Wall Street estimates revenues will reach just over $40 billion by 2033. Therefore, Palantir’s valuation appears overvalued, with shares trading at almost 9x the projected revenue for 2034. For context, Salesforce (customer relationship management) is expected to generate around $41 billion in sales this year and is valued at less than six times that figure. At current levels, investors are essentially paying upfront for more than a decade of growth.
The fact that Palantir’s stock price has continued to rise does not necessarily prove that the current valuation is sustainable, nor does it dismiss concerns about it. Market history shows that, eventually, fundamentals tend to reassert themselves. In many ways, market manias mirror fashion trends: they come and go, no matter how popular they seem at the time.
In conclusion, Palantir appears expensive when assessed using traditional valuation methods, even under the most optimistic growth assumptions. While this does not necessarily imply an immediate collapse in the share price, the stock is currently trading at bubble-like levels, leaving little to no margin of safety for investors. Earlier this year, Palantir underperformed the broader market when macro conditions weakened in February and March. It only recovered in April, which coincided with the Trump administration’s decision to pause reciprocal tariffs.
This highlights the risks ahead: if economic conditions worsen again, Palantir's high valuation may be difficult to maintain, leaving the stock vulnerable to another sharp decline.
Related Products
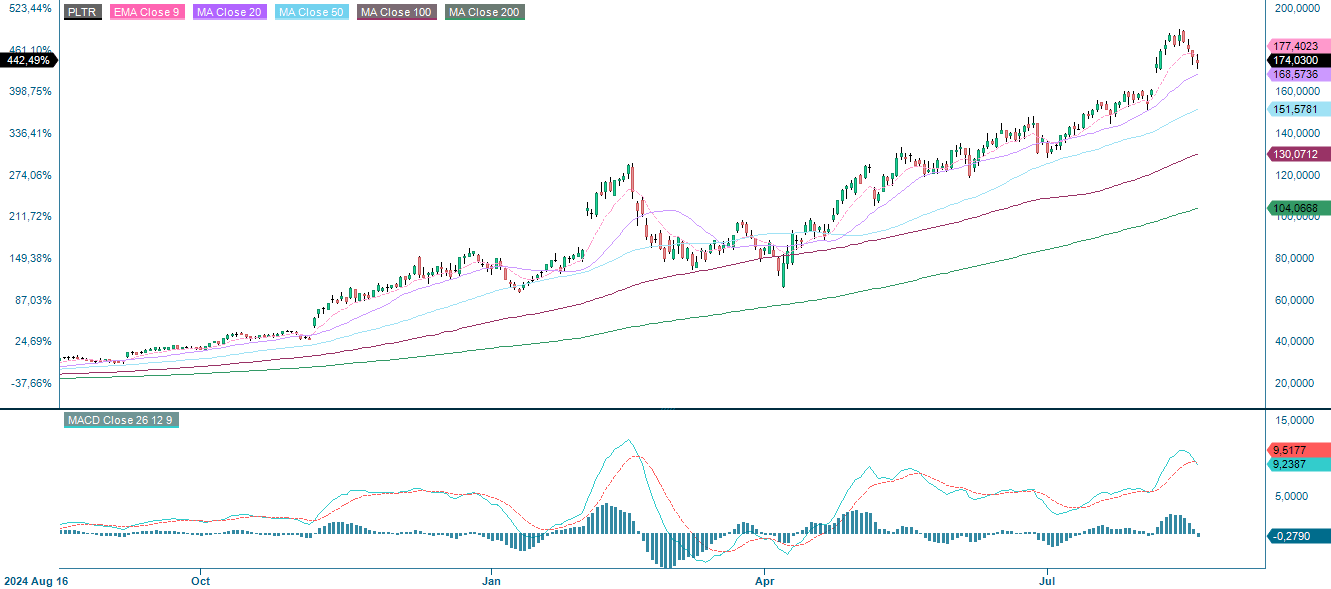
PLTR (in USD), one-year daily chart
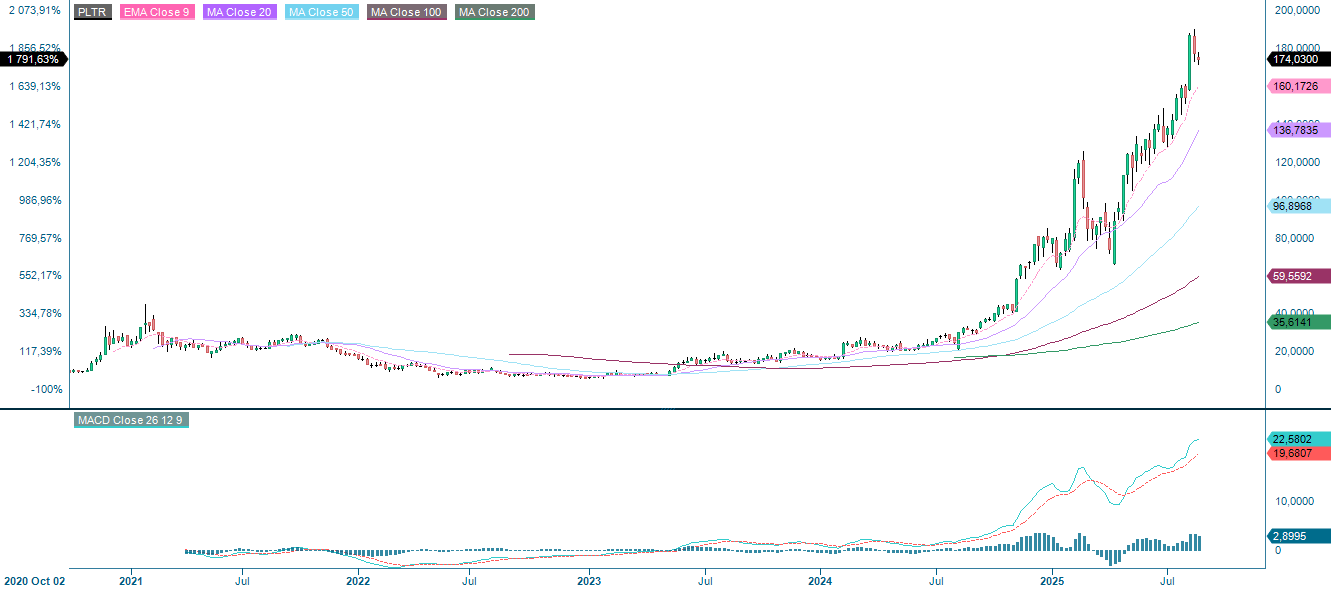
PLTR (in USD), five-year weekly chart
Macro comments
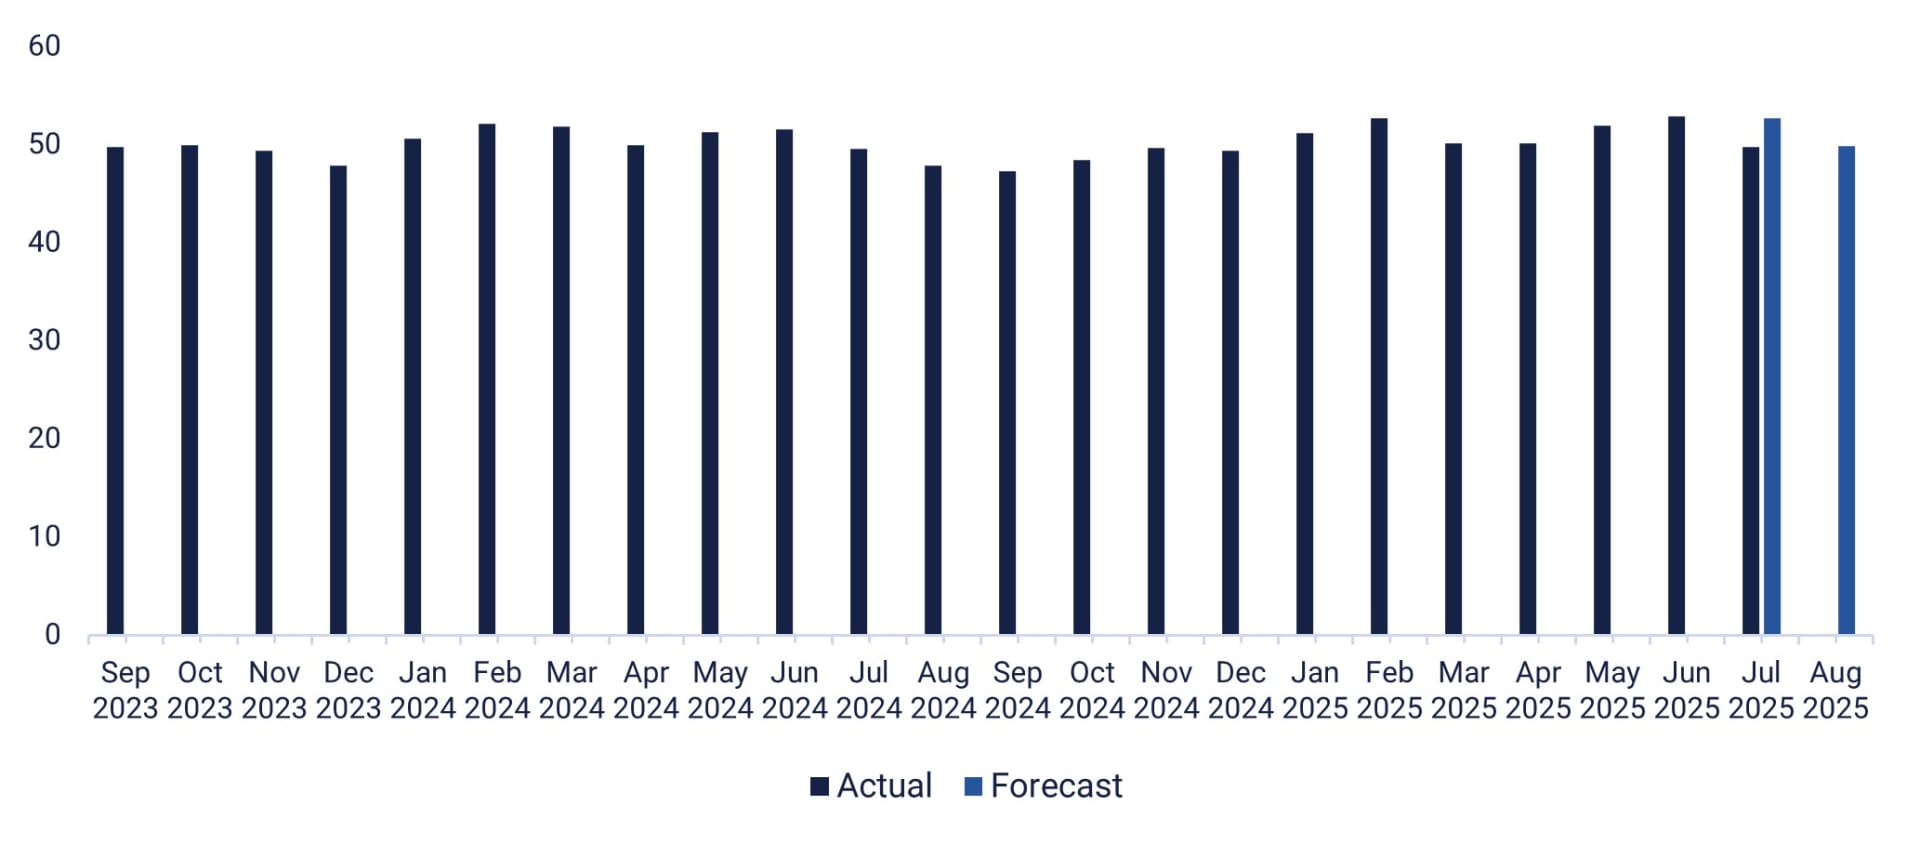
The most important event on this week's macroeconomic agenda is the release of the purchasing managers' indices from the U.S., major European countries, India and Japan on Thursday, 21 August. Based on expectations for the U.S. purchasing managers’ index in August 2025, the U.S. economy looks set to weaken (see graph below).
On Wednesday, 20 August, the Danish company Lundbeck is scheduled to publish an interim report. In the U.S., Lowe’s Companies, the TJX Companies and Analog Devices are due to report their quarterly results. The macroeconomic events begin with the release of Japan's trade balance and machinery orders figures for July and June, respectively. The UK's consumer price index and producer price index for July and Germany's producer price index for July are due a few hours later. This will be followed by the Eurozone's consumer price index in July and labour costs in Q2. The Swedish Riksbank will announce its interest rate decision. From the U.S., the Federal Reserve's policy meeting minutes from 29–30 July, and the Department of Energy's weekly oil inventory statistics are expected.
On Thursday 21 August, Hufvudstaden, GN Store Nord and Kojamo will report their interim results, as will Walmart and Intuit in the US later in the day. The macro agenda is dominated by the August purchasing managers' index from Japan, India, France, Germany, the eurozone, the UK and the U.S. In Europe, data on Swedish industry capacity utilisation in Q2, as well as the household confidence indicator for the Eurozone in August are also expected. From the U.S., the Philadelphia Fed Index for August, weekly jobless claims and existing home sales in July are also on the agenda.
On Friday 22 August, Nibe, which is listed on the Stockholm Stock Exchange, will release its Q2 2025 report. Friday's macroeconomic agenda is short and begins with Japan's consumer price index for July. This will be followed by UK retail sales in July and Germany's gross domestic product for Q2. France will release an indicator of its business climate in August. Federal Reserve chairman Jerome Powell will also deliver a speech at the Jackson Hole Symposium.
U.S. Manufacturing PMI, September 2023 to August 2025
Indices at key resistance areas. Can Powell add any fuel?
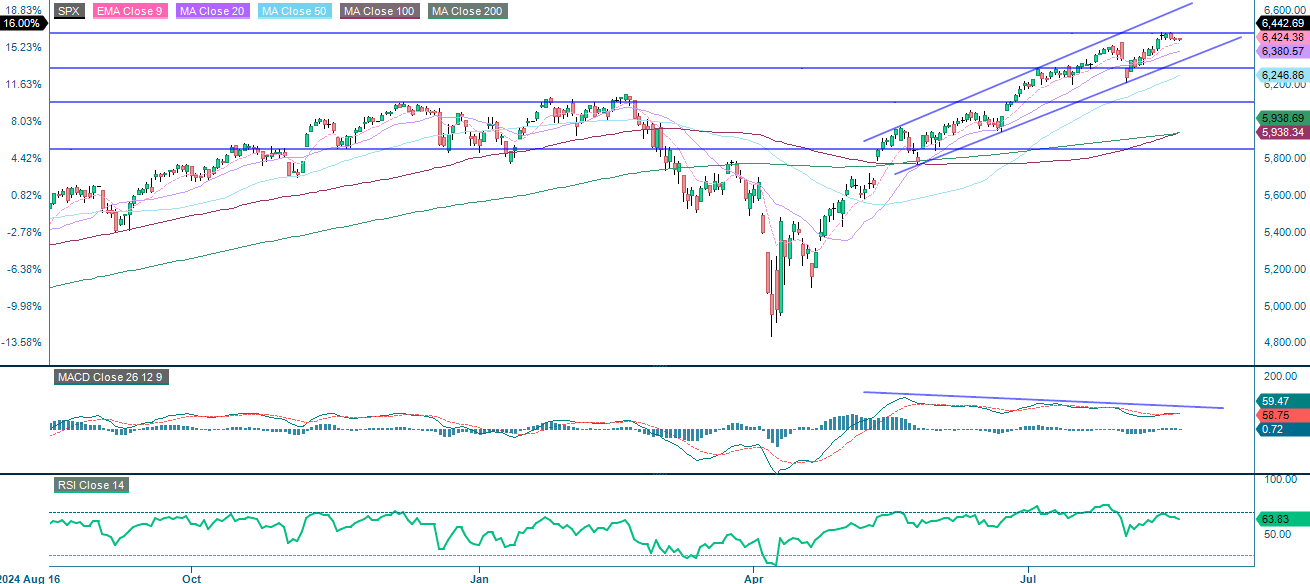
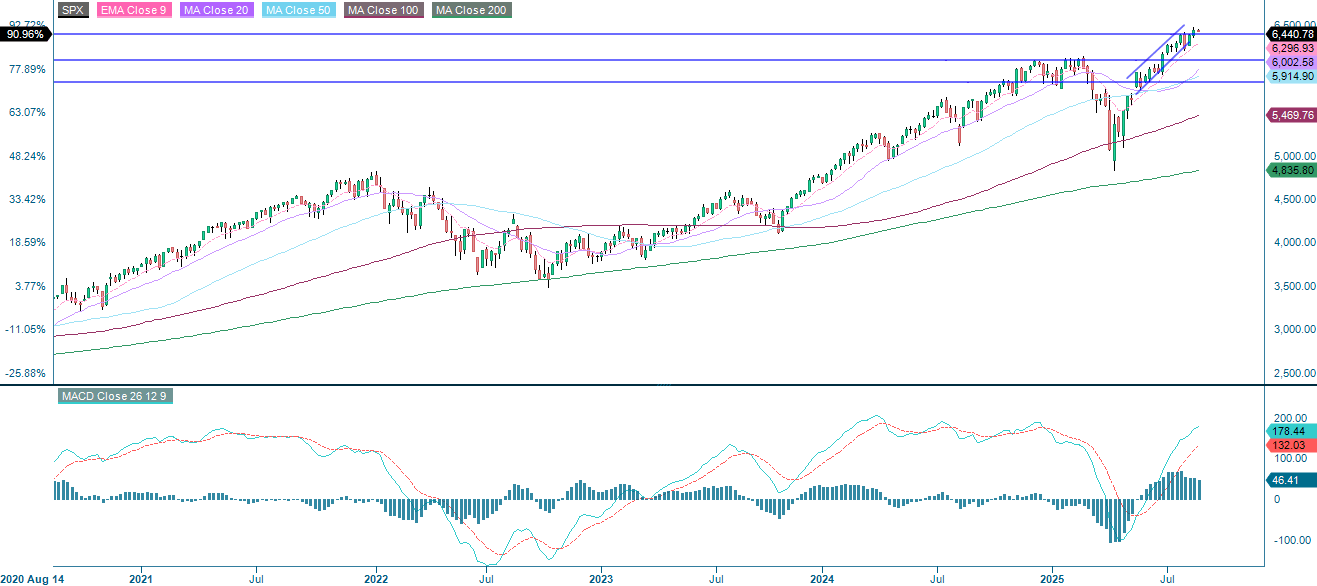
The S&P 500 remains in a strong uptrend, supported by higher lows and all major moving averages. However, momentum indicators are showing early signs of fatigue. A decisive move above 6,475 would confirm continuation of the bullish trend, while a failure to maintain the rising trend line could prompt investors to take profits and lead to a deeper retracement towards 6,100. While the broader trend remains intact, waning MACD and a flattening RSI highlight the risk of a short-term pullback. This makes resistance and support levels key areas to monitor for a potential reversal or stabilisation.
Related Products
S&P 500 (in USD), one-year daily chart
S&P 500 (in USD), weekly five-year chart
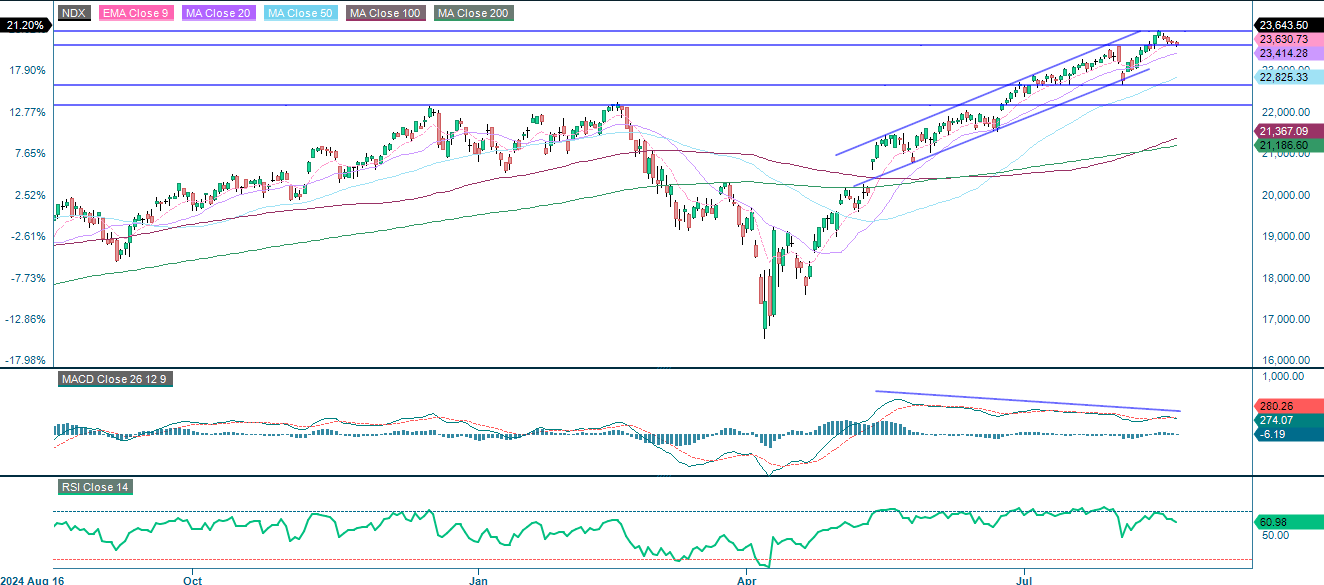
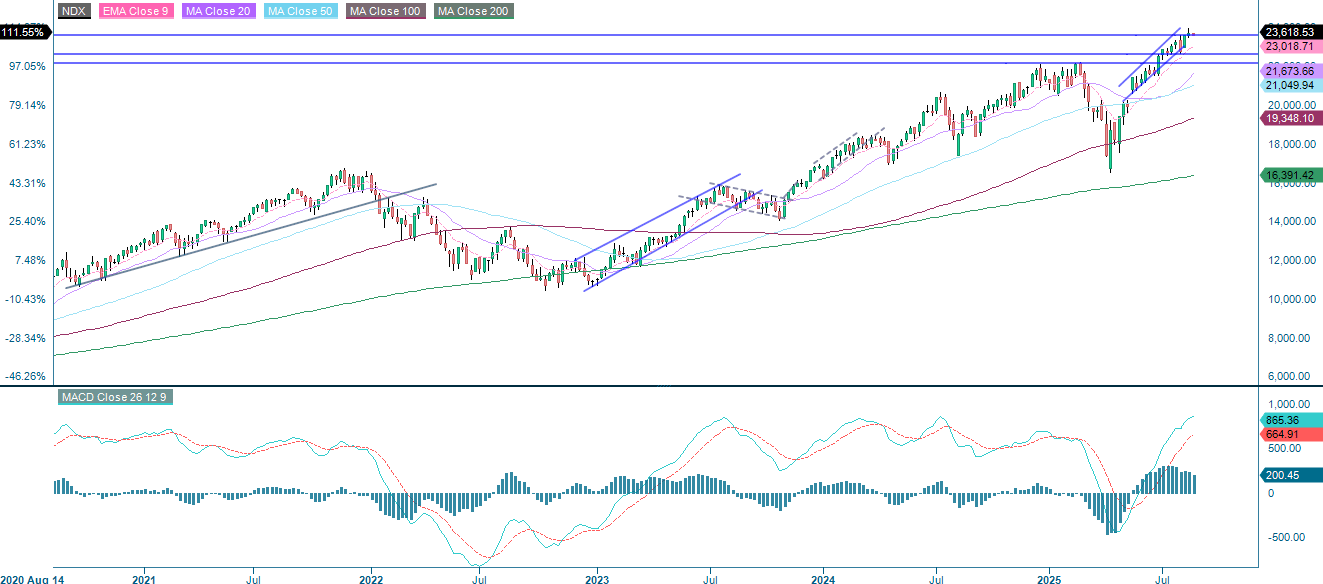
The NASDAQ-100 is still in an overall uptrend, which is supported by moving averages. However, momentum is fading, as indicated by the MACD signal, which shows potential weakness. Sustained movement above 23,945 would confirm renewed bullish momentum, whereas a drop below 23,400 could trigger a deeper pullback towards 22,645.
Related Products
NASDAQ-100 (in USD), one-year daily chart
NASDAQ-100 (in USD), weekly five-year chart
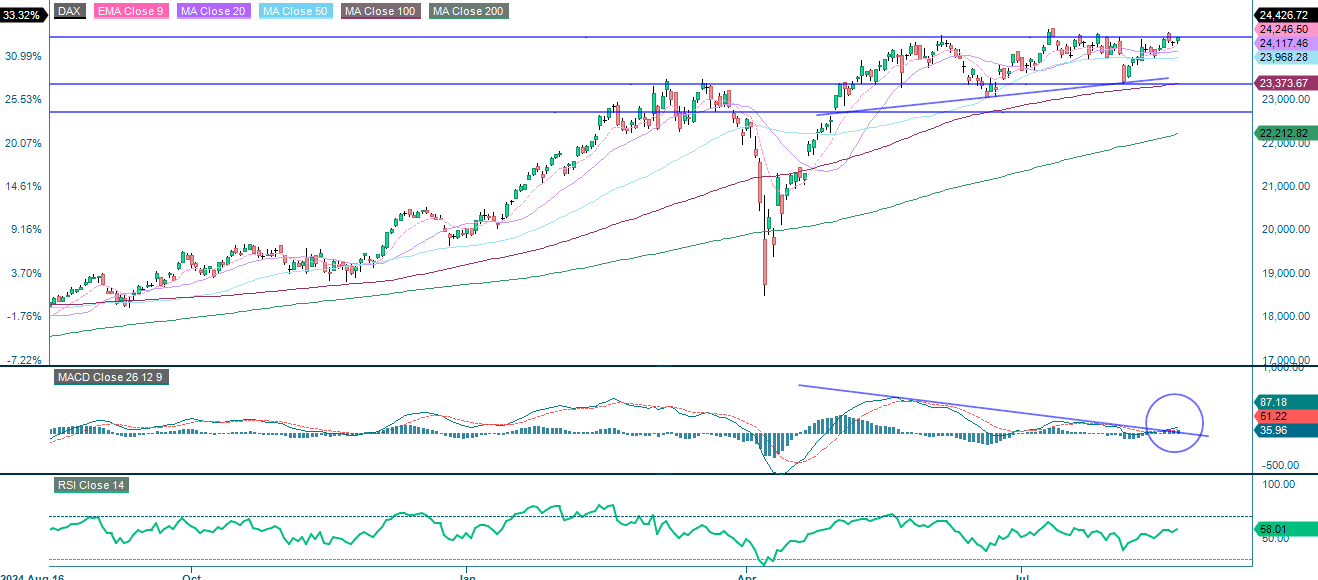
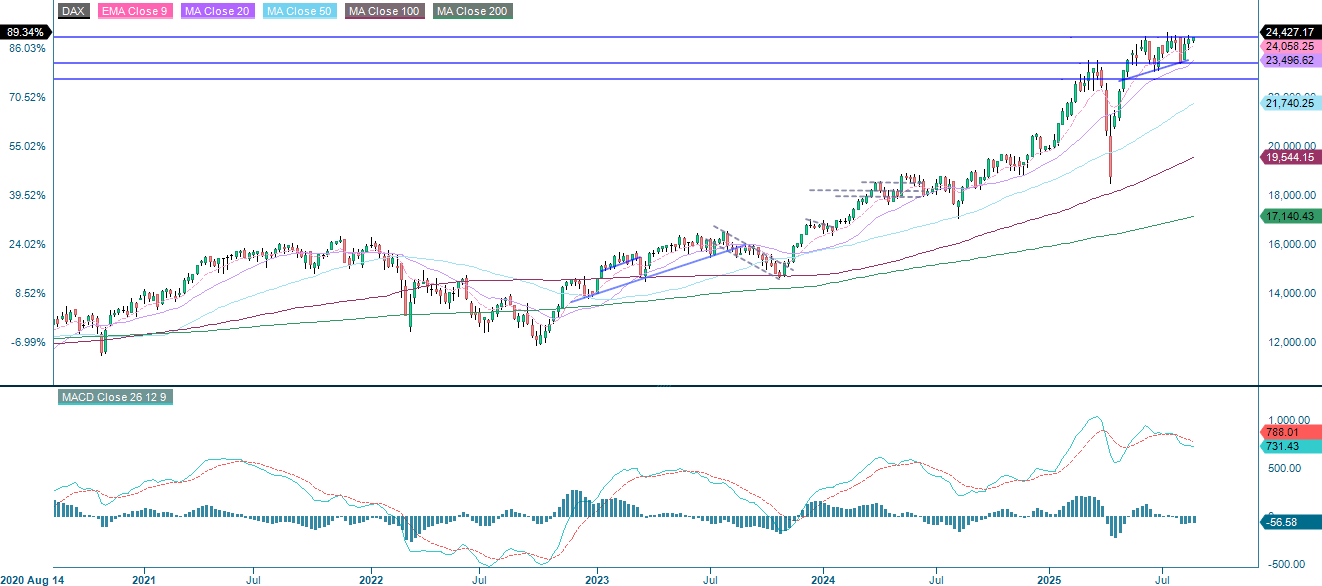
In Europe, the DAX is showing bullish momentum, which is being supported by the trend. MACD appears to have also broken the falling trend, while the RSI is not yet signalling overbought conditions. This leaves room for further gains if buying continues. Sustained movement above the 24,450-resistance level would confirm real strength. Until then, there is a risk of a pullback, with potential downside towards key moving averages.
Related Products
DAX (in EUR), one-year daily chart
DAX (in EUR), weekly five-year chart
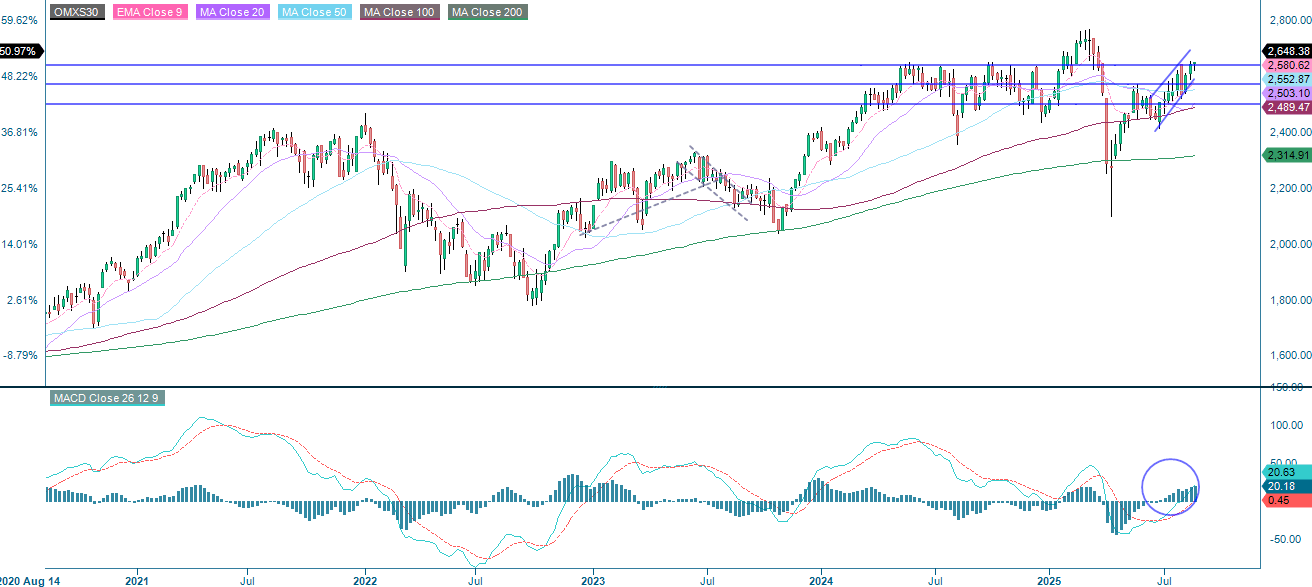
The OMXS30 is in a confirmed bullish trend, trading within an ascending channel, and all major moving averages and the MACD are supporting continued momentum. A sustained break above 2,650 would indicate potential for further gains, although the index is approaching resistance. While there is still potential for growth, investors should also be aware of the risk of profit-taking. Key support levels could stabilise the market in the event of a pullback.
Related Products
OMX30 (in SEK), one-year daily chart
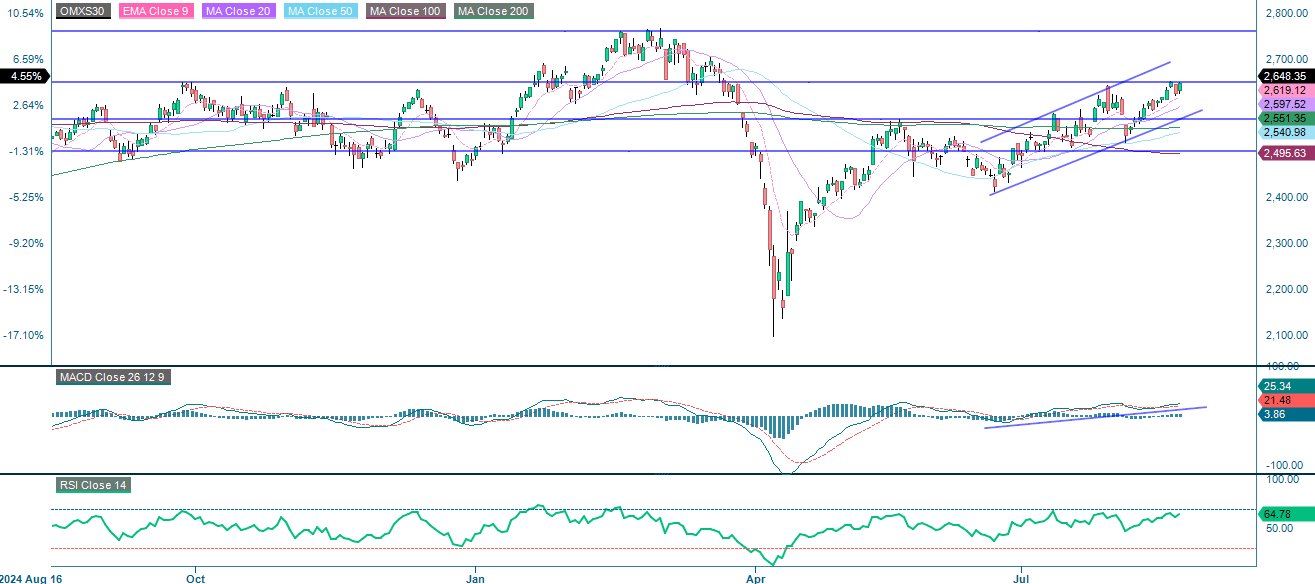
OMX30 (in SEK), weekly five-year chart
The full name for abbreviations used in the previous text:
EMA 9: 9-day exponential moving average
Fibonacci: There are several Fibonacci lines used in technical analysis. Fibonacci numbers are a sequence in which each successive number is the sum of the two previous numbers.
MA20: 20-day moving average
MA50: 50-day moving average
MA100: 100-day moving average
MA200: 200-day moving average
MACD: Moving average convergence divergence
RSI: Relative strength index
Risks
Credit risk of the issuer:
Investors in the products are exposed to the risk that the Issuer or the Guarantor may not be able to meet its obligations under the products. A total loss of the invested capital is possible. The products are not subject to any deposit protection.
Currency risk:
If the product currency differs from the currency of the underlying asset, the value of a product will also depend on the exchange rate between the respective currencies. As a result, the value of a product can fluctuate significantly.
Market risk:
The value of the products can fall significantly below the purchase price due to changes in market factors, especially if the value of the underlying asset falls. The products are not capital-protected
Product costs:
Product and possible financing costs reduce the value of the products.
Risk with leverage products:
Due to the leverage effect, there is an increased risk of loss (risk of total loss) with leverage products, e.g. Bull & Bear Certificates, Warrants and Mini Futures.
External author:
This information is in the sole responsibility of the guest author and does not necessarily represent the opinion of Bank Vontobel Europe AG or any other company of the Vontobel Group. This information is sponsored by Bank Vontobel Europe AG, which may be a counterparty to transactions involving the financial instruments discussed in this information. The further development of the index or a company as well as its share price depends on a large number of company-, group- and sector-specific as well as economic factors. When forming his investment decision, each investor must take into account the risk of price losses. Please note that investing in these products will not generate ongoing income.
The products are not capital protected, in the worst case a total loss of the invested capital is possible. In the event of insolvency of the issuer and the guarantor, the investor bears the risk of a total loss of his investment. In any case, investors should note that past performance and / or analysts' opinions are no adequate indicator of future performance. The performance of the underlyings depends on a variety of economic, entrepreneurial and political factors that should be taken into account in the formation of a market expectation.
Disclaimer:
This information is neither an investment advice nor an investment or investment strategy recommendation, but advertisement. The complete information on the products (securities) mentioned herein, in particular the structure and risks associated with an investment, are described in the base prospectus, together with any supplements, as well as the final terms relating to the securities. The base prospectus and final terms constitute the solely binding sales documents for the products mentioned herein. It is recommended that potential investors read these documents before making any investment decision. The documents and the key information document are published on the website of the issuer, Vontobel Financial Products GmbH, Bockenheimer Landstrasse 24, 60323 Frankfurt am Main, Germany, on https://prospectus.vontobel.com and are available from the issuer free of charge. The approval of the prospectus should not be understood as an endorsement of the securities. The securities are products that are not simple and may be difficult to understand. This information includes or relates to figures of past performance. Past performance is not a reliable indicator of future performance. This information may only be distributed or published in countries where such distribution or publication is permitted by applicable law. As stated in the relevant base prospectus, the distribution of the securities mentioned in this information is subject to restrictions in certain jurisdictions. This advertisement may not be reproduced or redistributed without prior permission by Vontobel.
© Bank Vontobel Europe AG and / or affiliated companies. All rights reserved.