The autumn season could be turbulent


Although US Q2 reports have been strong, this is reflected in historically high valuations. This largely ignores the significant ongoing macroeconomic uncertainty. August and September are also typically weak months for the US stock market. Therefore it is recommended that investors protect their portfolios using the VIX volatility index.
Case of the week: Summer lull in the markets, time to increase protection?
Despite the worrying headlines about trade, geopolitics and the U.S. labour market in recent months, the stock market has remained undaunted and continued to climb over the summer. Investors appear to have adopted the view that the announced trade deals between the U.S. and other countries will be honoured, and that the major uncertainties have now been resolved. Furthermore, market pricing indicates expectations of a rate cut from the Fed in the second half of 2025, even without a recession. According to the CME Group FedWatch tool, there is approximately a 90 per cent chance of a rate cut by the Federal Reserve following the next Federal Open Market Committee (FOMC) meeting on 16–17 September 2025.
However, there is a risk that markets have become overheated and are ignoring potential economic risks. For instance, stockpiling ahead of tariff increases may have boosted sales in many sectors during Q1 and Q2 of 2025. Consequently, there might be a backlash to this growth. Furthermore, tariffs could impact consumer prices if U.S. companies try to protect their margins.
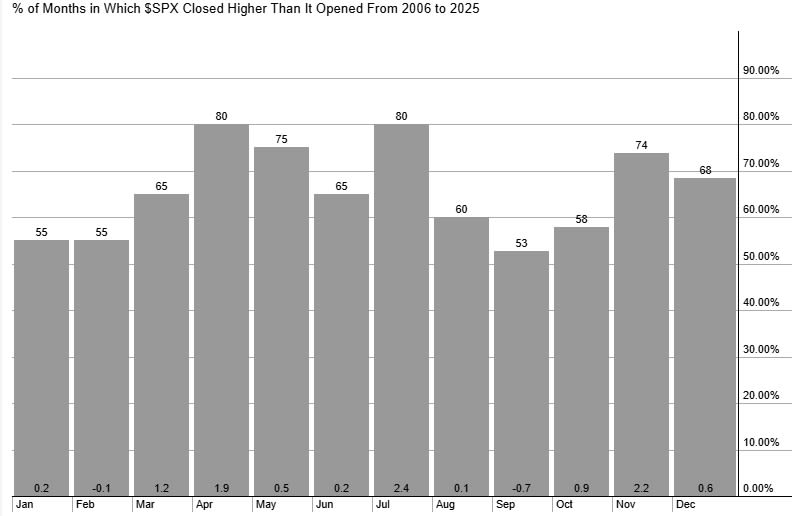
From a seasonal perspective, August and September tend to see relatively weak returns in the stock market. In fact, according to StockCharts, September has been the weakest month of the year for the S&P 500 over the last 20 years.
S&P500, average monthly performance last 20 years
Overall, it would be sensible to increase protection against potential volatility in the coming weeks and months.
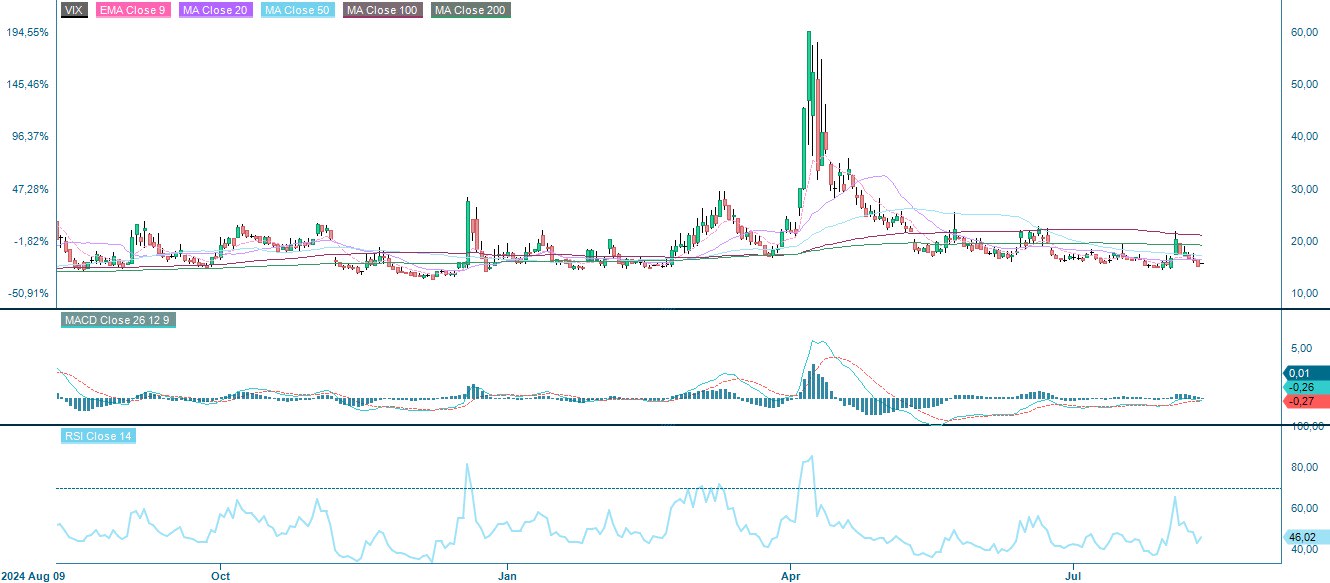
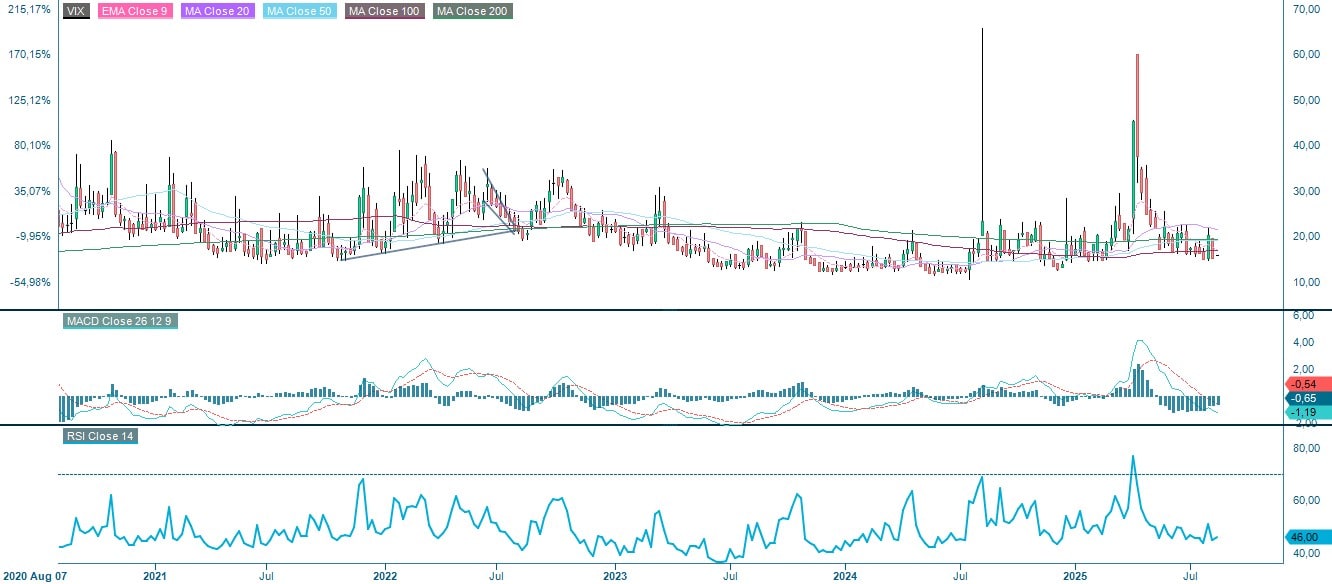
The Volatility Index (VIX) is currently trading at around the summer low of 15. However, this is significantly below this year's highs. Historically, it has spiked above 30 during periods of heightened market uncertainty, as occurred amid “Liberation Day” trade fears at the beginning of April 2025.
Related Products
VIX, one-year daily chart
VIX, five-year weekly chart
Macro comments
As of 8 August 2025, 90% of S&P 500 companies had reported their Q2 earnings. Of these, 81% reported better-than-expected earnings and revenues. The S&P 500's average earnings growth for Q2 2025 was 11.8%. However, the S&P 500's valuation is also historically high, with 12-month forward earnings valued at an average price-to-earnings (P/E) ratio of 22.1 according to Earnings Insight. The sectors with the highest valuations are Information Technology, Consumer Discretionary and Industrials, with P/E ratios of 30, 28 and 24.4 respectively. Meanwhile, the three lowest-valued S&P 500 sectors are Financials, Health Care and Energy, with P/E ratios of 16.1, 15.8 and 14.6 respectively.
On Wednesday, 13 August, we will receive interim reports from not only Danish Vestas, but also from Cisco in the US and Tencent in China. The macro agenda starts with Japan's Producer Price index (PPI) in July. This is followed by Germany's and Spain's Consumer price index (CPI) figures for July. There are also two oil reports during the day: a monthly report from the International Energy Agency (IEA) and weekly oil inventory statistics from the Department of Energy (DOE) in the US.
On Thursday, 14 August, interim reports are due from Holmen and Carlsberg in the Nordic region, Thyssen Krupp in Germany, Applied Materials and John Deere in the US, and Chinese company Alibaba. The macro agenda starts with Statistics Sweden's Consumer price index (CPI) in July and the UK's Q2 GDP. This is followed by France's Consumer price index (CPI) in July, and Gross domestic product (GDP) and employment in the Eurozone in Q2, as well as industrial production in June. From the US, we receive the Producer Price Index (PPI) for July and weekly initial jobless claims.
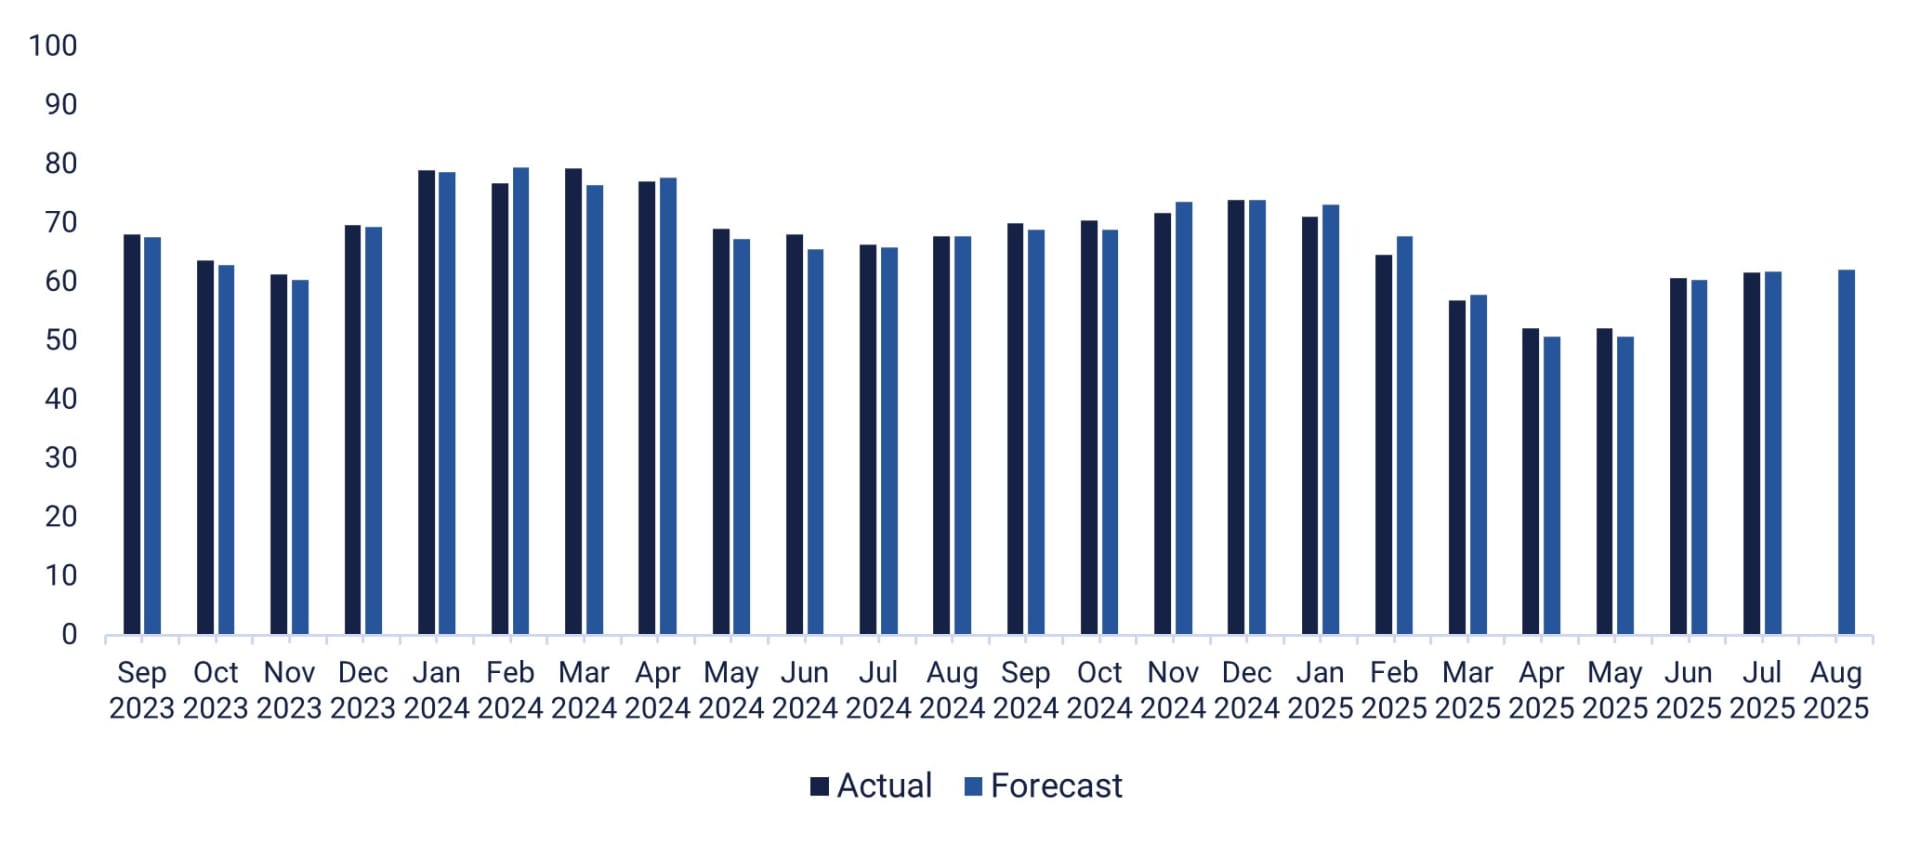
On Friday 15 August, Finnish energy company Fortum is scheduled to release its quarterly results. First up on the macro agenda is Japan's Q2 Gross Domestic Product (GDP). Next, statistics on industrial production, house prices, retail sales, fixed investments and unemployment in China in July will be released. A few hours later, Japan's industrial production figures for June are expected. From Europe, we will receive the UK's industrial production figures for June. The U.S. will contribute data on unsold stocks for June, as well as retail sales, industrial production and import prices for July. The Empire Manufacturing Index and the Michigan Consumer Confidence Index for August are also due to be released. The graph below shows how Michigan consumer sentiment has changed over the past two years.
U.S. Michigan Consumer Sentiment Index, September 2023 to August 2025
Still bullish, but the MACD may show an early sign of weakness
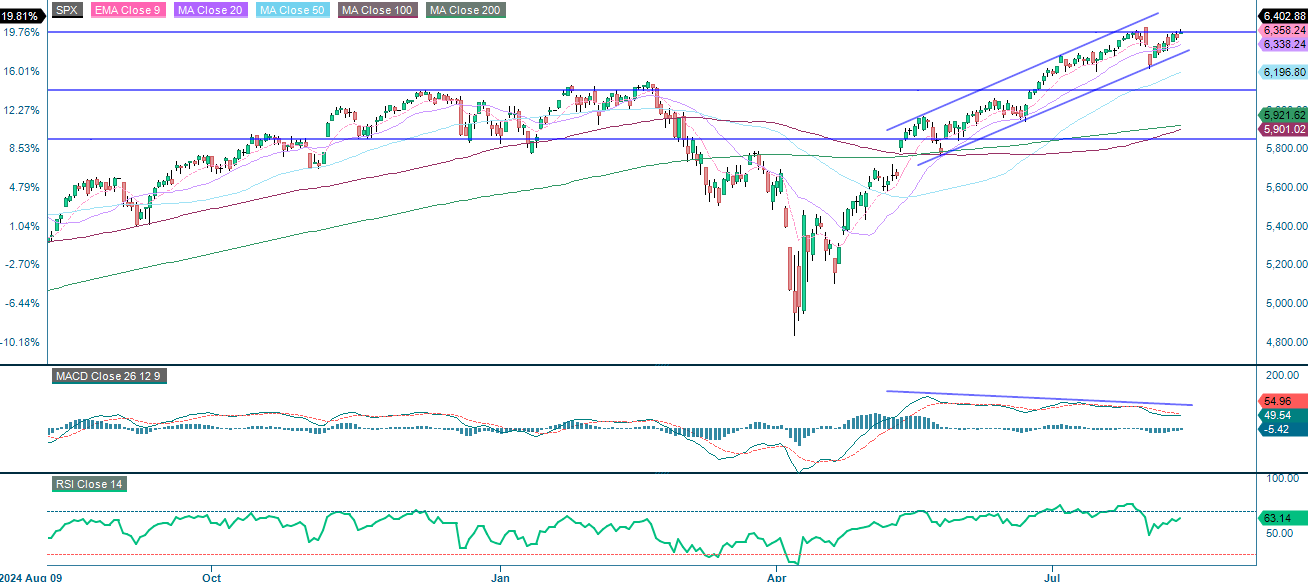
The outlook for the S&P 500 remains bullish, with the price supported by all the major moving averages and the asset firmly positioned within the upward channel. Although momentum remains positive, the MACD histogram indicates a potential slowdown that requires attention. Breaking below the lower channel boundary, which is currently near 6,340, could trigger a deeper pullback towards the MA50 at 6,197. Conversely, breaking out above 6,416 would confirm the continuation of the trend. Traders should monitor the MACD and RSI indicators for early signs of weakness and consider using trailing stops as prices approach the upper resistance level.
Related Products
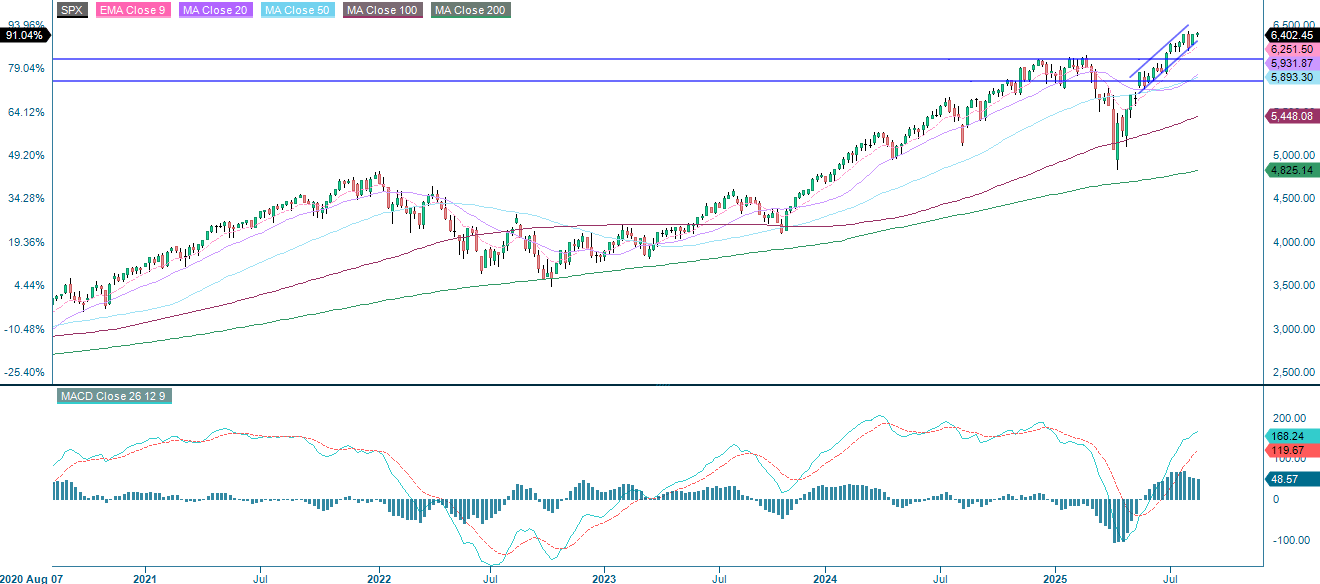
S&P 500 (in USD), one-year daily chart
S&P 500 (in USD), weekly five-year chart
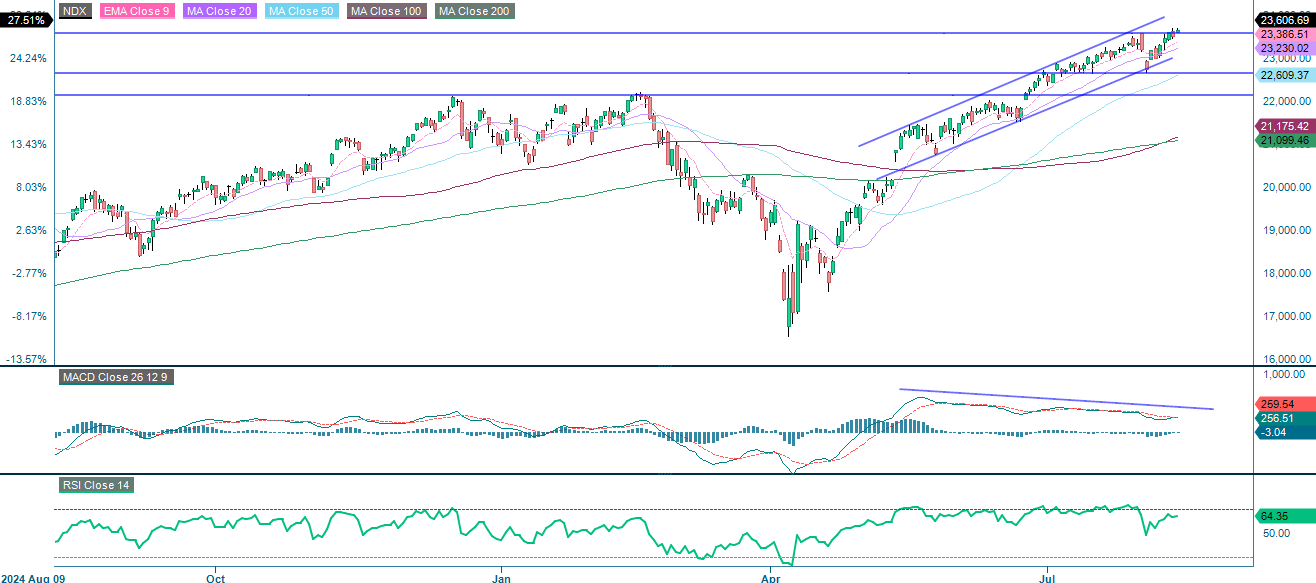
The NASDAQ-100 remains in a bullish phase, with prices above all major moving averages and contained within a rising channel. However, bearish divergence is evident once again in the MACD and RSI, indicating the potential for a short-term pullback or consolidation at higher levels. A drop below channel support at around 23,230 could prompt a deeper correction, whereas breaking out above current resistance would suggest further upside. Overall, the short-term trend remains positive, but emerging signals indicate the need for closer monitoring to manage potential reversal risks.
Related Products
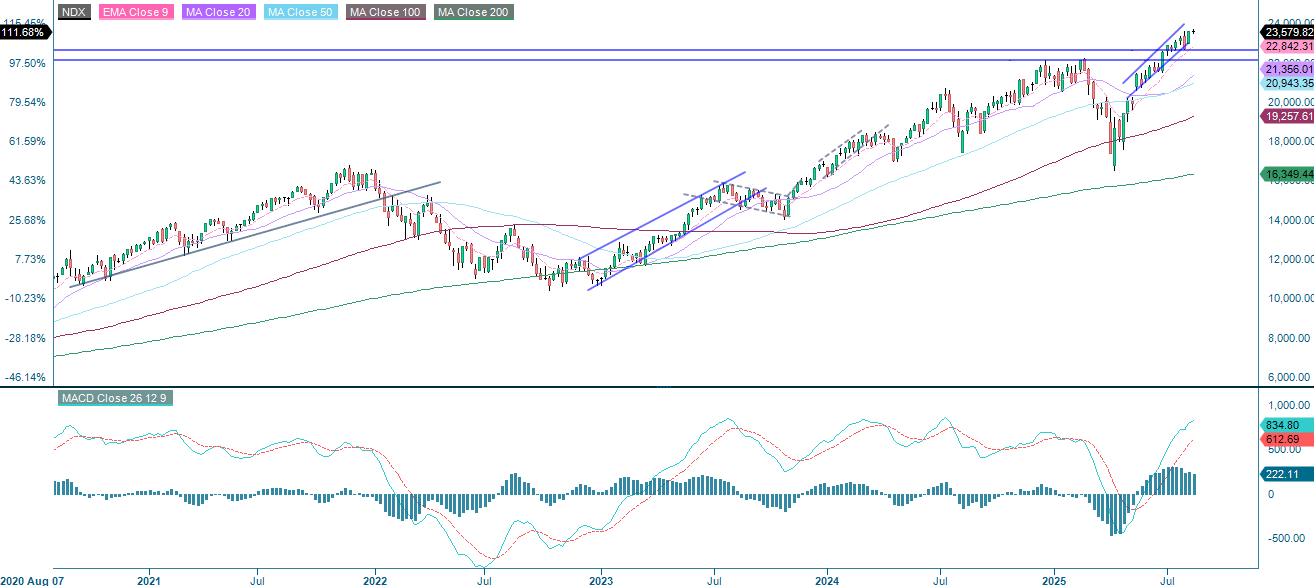
NASDAQ-100 (in USD), one-year daily chart
NASDAQ-100 (in USD), weekly five-year chart
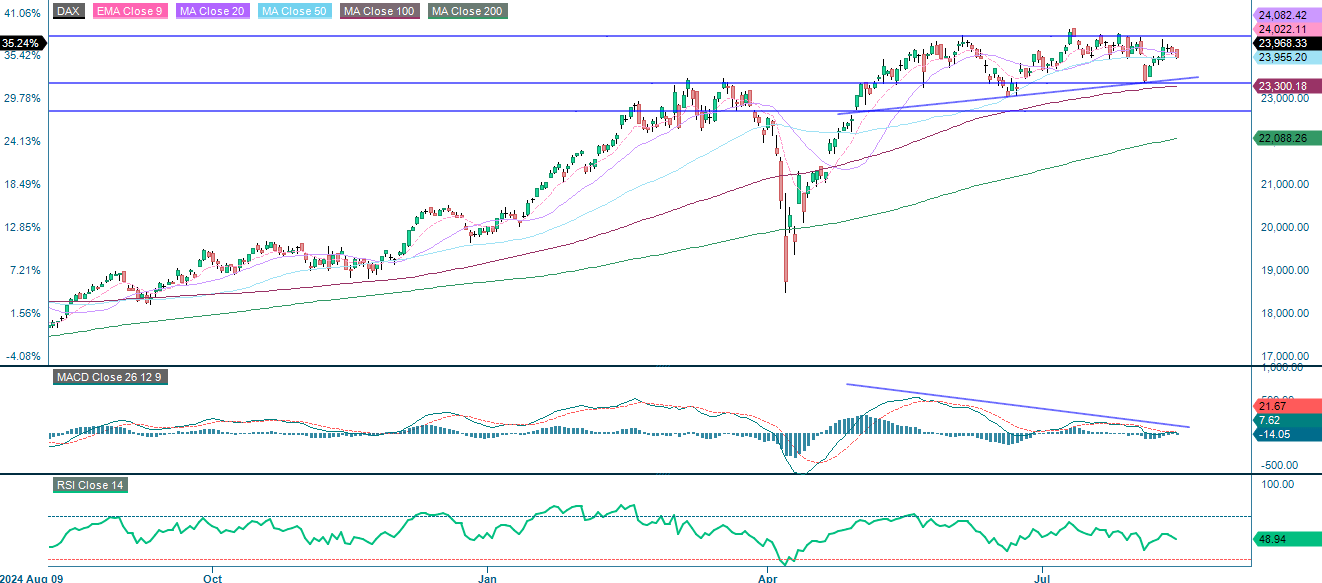
In Europe, the DAX index is consolidating after a strong rally. It has a neutral bias until a clear breakout or breakdown emerges. A decisive move above the 24,025–24,085 range would strengthen the bullish case and signal renewed momentum. Conversely, if this level is not reached, combined with bearish divergence in the MACD, this could trigger a pullback toward 23,300. There is a risk of a deeper decline, possibly extending to 22,700 or even the MA200 at 22,088. The next move depends on whether the price breaks through the resistance level or falls into a correction.
Related Products
DAX (in EUR), one-year daily chart
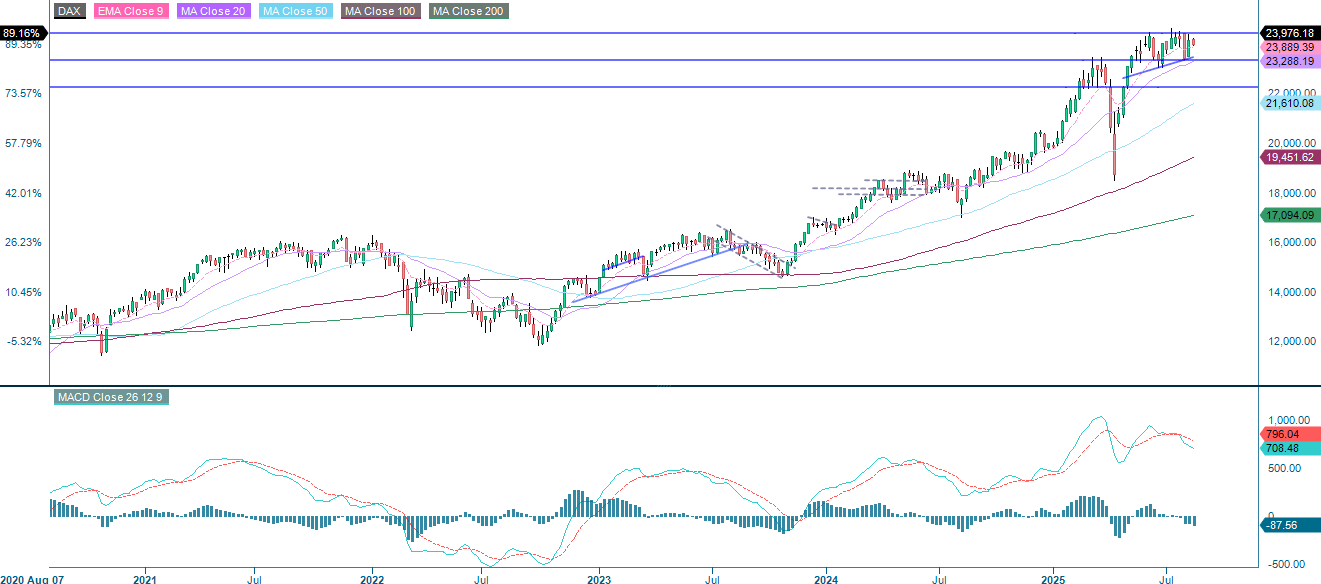
DAX (in EUR), weekly five-year chart
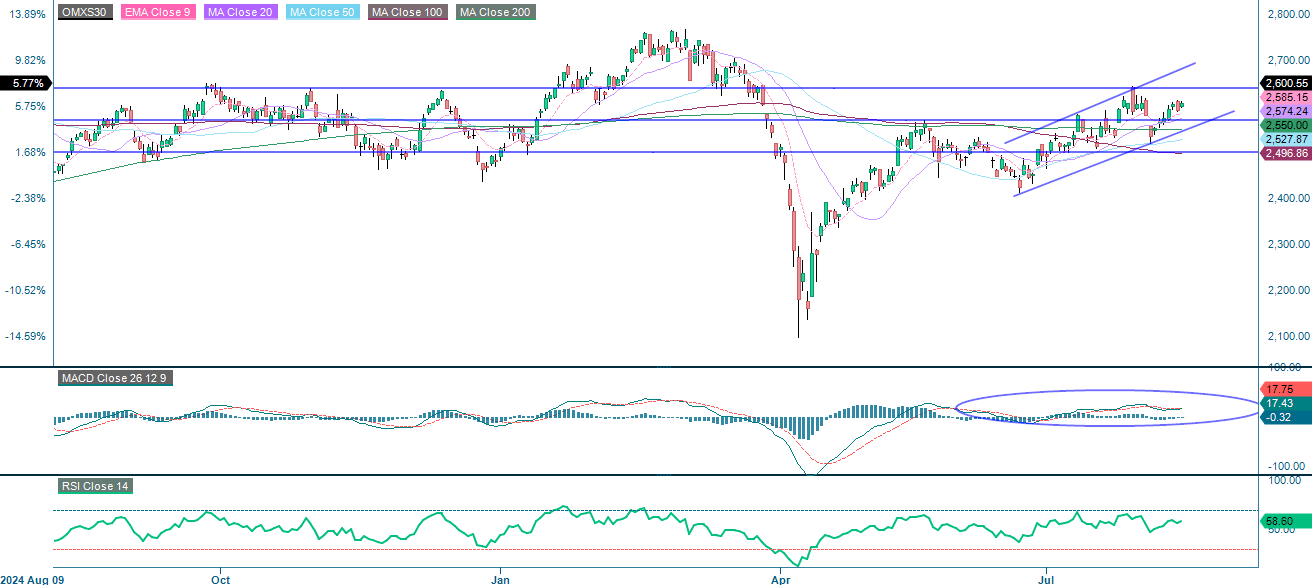
The OMXS30 remains in an uptrend, but momentum is showing signs of stalling, resulting in a balanced outlook until a decisive move occurs. A breakout above 2,600 with strong volume could propel prices towards 2,650, with the RSI likely to rise above 60–65 in the process, confirming renewed momentum. Conversely, if prices fail to clear 2,600 and a MACD bearish crossover follows, this could trigger a pullback towards 2,500.
Related Products
OMX30 (in SEK), one-year daily chart
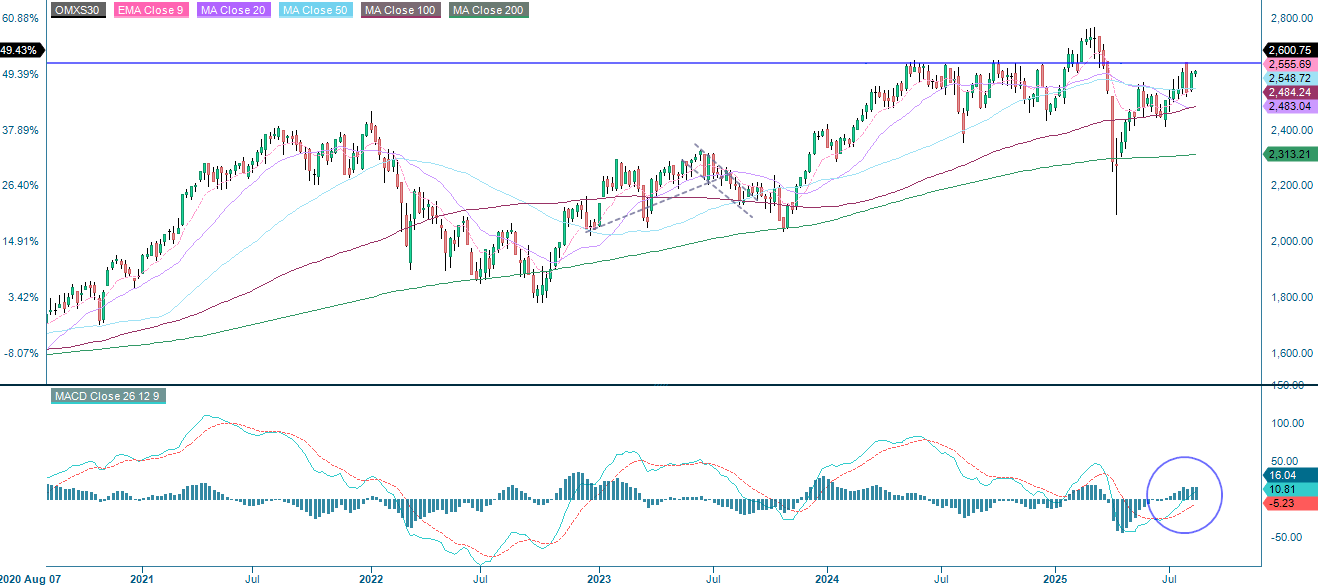
OMX30 (in SEK), weekly five-year chart
The full name for abbreviations used in the previous text:
EMA 9: 9-day exponential moving average
Fibonacci: There are several Fibonacci lines used in technical analysis. Fibonacci numbers are a sequence in which each successive number is the sum of the two previous numbers.
MA20: 20-day moving average
MA50: 50-day moving average
MA100: 100-day moving average
MA200: 200-day moving average
MACD: Moving average convergence divergence
RSI: Relative strength index
Risks
Credit risk of the issuer:
Investors in the products are exposed to the risk that the Issuer or the Guarantor may not be able to meet its obligations under the products. A total loss of the invested capital is possible. The products are not subject to any deposit protection.
Currency risk:
If the product currency differs from the currency of the underlying asset, the value of a product will also depend on the exchange rate between the respective currencies. As a result, the value of a product can fluctuate significantly.
Market risk:
The value of the products can fall significantly below the purchase price due to changes in market factors, especially if the value of the underlying asset falls. The products are not capital-protected
Product costs:
Product and possible financing costs reduce the value of the products.
Risk with leverage products:
Due to the leverage effect, there is an increased risk of loss (risk of total loss) with leverage products, e.g. Bull & Bear Certificates, Warrants and Mini Futures.
External author:
This information is in the sole responsibility of the guest author and does not necessarily represent the opinion of Bank Vontobel Europe AG or any other company of the Vontobel Group. This information is sponsored by Bank Vontobel Europe AG, which may be a counterparty to transactions involving the financial instruments discussed in this information. The further development of the index or a company as well as its share price depends on a large number of company-, group- and sector-specific as well as economic factors. When forming his investment decision, each investor must take into account the risk of price losses. Please note that investing in these products will not generate ongoing income.
The products are not capital protected, in the worst case a total loss of the invested capital is possible. In the event of insolvency of the issuer and the guarantor, the investor bears the risk of a total loss of his investment. In any case, investors should note that past performance and / or analysts' opinions are no adequate indicator of future performance. The performance of the underlyings depends on a variety of economic, entrepreneurial and political factors that should be taken into account in the formation of a market expectation.
Disclaimer:
This information is neither an investment advice nor an investment or investment strategy recommendation, but advertisement. The complete information on the products (securities) mentioned herein, in particular the structure and risks associated with an investment, are described in the base prospectus, together with any supplements, as well as the final terms relating to the securities. The base prospectus and final terms constitute the solely binding sales documents for the products mentioned herein. It is recommended that potential investors read these documents before making any investment decision. The documents and the key information document are published on the website of the issuer, Vontobel Financial Products GmbH, Bockenheimer Landstrasse 24, 60323 Frankfurt am Main, Germany, on https://prospectus.vontobel.com and are available from the issuer free of charge. The approval of the prospectus should not be understood as an endorsement of the securities. The securities are products that are not simple and may be difficult to understand. This information includes or relates to figures of past performance. Past performance is not a reliable indicator of future performance. This information may only be distributed or published in countries where such distribution or publication is permitted by applicable law. As stated in the relevant base prospectus, the distribution of the securities mentioned in this information is subject to restrictions in certain jurisdictions. This advertisement may not be reproduced or redistributed without prior permission by Vontobel.
© Bank Vontobel Europe AG and / or affiliated companies. All rights reserved.