US equity indices have taken the lead


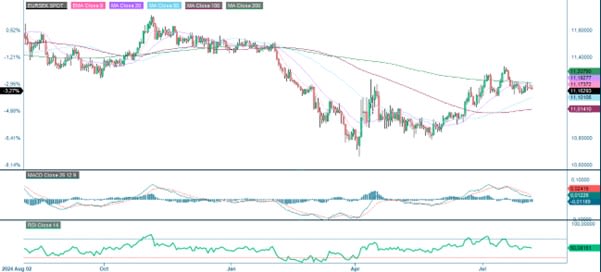
After the summer break, our first case is that the SEK will strengthen against the EUR. This is because several economic indicators suggest the Swedish economy is recovering from its previous downturn. The second quarter earnings season has been strong in the US, but mediocre from an OMX perspective. Since 18 June 2025, US equity indices have also outperformed their European counterparts.
Case of the week: A stronger Swedish economy should boost the SEK
On 1 August, statistics showed that the Swedish economy had begun to recover. The Purchasing Managers' Index (PMI) for the Swedish manufacturing sector increased to 54.2 in July, surpassing analysts' expectations of 52.5 and a rise from 51.8 in June. This is the highest PMI level recorded so far in 2025. Another sign of recovery was the strong sales of passenger cars in Sweden in July 2025, which increased by 8.2% compared to July 2024. Furthermore, the number of bankruptcies fell for the fourth consecutive month compared to the same period in 2024. The largest decrease was in wholesale trade (45%), followed by the hotel and restaurant sector (26%), then construction (23%).
The intensification of pressure on the domestic economy is evident in the yield on two-year Swedish government bonds, which increased from 1.68% on 1 July to 1.86% on 5 August. In contrast, the yield on two-year German government bonds only increased from 1.82% on 1 July to 1.88% on 5 August. These factors should strengthen the SEK against the euro, given the recent changes in interest rates that make the SEK a more attractive investment.
The Stockholm Stock Exchange's exposure to the Swedish domestic economy is limited. However, real estate companies in Sweden (e.g. Fabege, Atrium Ljungberg, Castellum and Hufvudstaden), that rent out offices and retail premises, are likely to benefit from rising rental levels in the event of a Swedish domestic economic recovery.
Ironically, a stronger Swedish economy would typically lead to a stronger SEK, putting pressure on the OMX index by making Swedish goods and services more expensive to export. While most major OMX companies, except for Ericsson and Volvo, have a relatively low proportion of exports from Sweden, the results of their foreign operations — often accounting for 80–95% of the group's total results — are still affected when converted from USD, EUR, and other foreign currencies into SEK.
Related Products
EUR/SEK, one-year daily chart
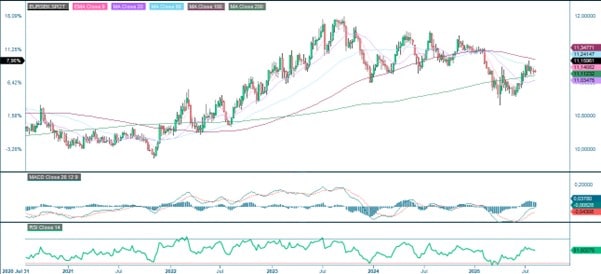
EUR/SEK, five-year weekly chart
Macro comments
On 28 July, the U.S. and the EU reached a framework agreement on trade, setting a general tariff rate of 15% on exports to the U.S. The increased tariffs on around 70% of exported goods are expected to lead to lower economic growth in both regions, as well as pushing up U.S. inflation by around two percentage points. Ahead of 1 August — the original deadline for negotiations on new trade agreements between the U.S. and a wide range of countries — President Trump moved the deadline up to 7. August for most of these countries. He also threatened to impose high tariffs on goods from countries that did not reach an agreement by the new deadline.
August began with sharp stock markets declines across Europe and the U.S. The ongoing trade dispute between the U.S. and the rest of the world, Trump's criticism of the Federal Reserve, and an unexpectedly weak U.S. jobs report all dampened the mood. With only 73,000 new jobs created in the U.S. non-farm payroll sector in July, this figure fell short of the consensus estimate of 110,000. The previous two non-farm payroll reports were also downgraded retroactively by 258,000 jobs. Following the release of the employment figures on Friday 1 August, the yield on two-year U.S. Treasuries fell from 3.96% to 3.68%. The weak U.S. jobs report for July has led investors to believe that the Fed will cut interest rates in September. Currently, the market is pricing in a 92% probability of the first of two 25-basis-point cuts occurring next month.
As the graph below shows, since the summer break of the Carlsquare Vontobel Weekly Letter on 18 June 2025, US equity indices have outperformed European ones.
Performance of world equity indices from 18 June 2025 and over 5 years, ranked by 18 June

As of 1 August 2025, 66% of S&P 500 companies had reported their Q2 earnings. Of these, 82% exceeded earnings expectations, and 79% reported positive revenue surprises. The top three sectors in terms of positive earnings surprises in Q2 2025 were Information Technology, Communication Services, and Financial Services, with 97%, 92%, and 90% of results exceeding stock market expectations, respectively.
Almost all of the major OMX companies reported their Q2 2025 results in July. Of the 94 OMX companies for which Consensus estimates were available and which reported in Q2, 53% exceeded expectations, 45% underperformed, and 2% were in line with expectations. In Q2 2025, only 35% of these OMX companies achieved higher revenues than expected.
On Wednesday, 6 August, we will receive interim reports from the following companies: Lundin Mining, Novo Nordisk and Sampo in the Nordics; Schaeffler and Zalando in Germany; McDonald's, and Walt Disney in the U.S. as well as Shopify in Canada. The macroeconomic data agenda begins with an interest rate announcement from India and the release of the services price index for Sweden for the second quarter. This is followed by Germany's industrial orders for June, the National Institute of Economic and Social Research’s (NIESR) economic update for Sweden, and the Eurozone's retail sales for June. We receive weekly oil inventory statistics from the U.S. Department of Energy.
On Thursday, 7 August, we will receive interim reports from the following companies:
Lundin Gold, Genmab and Maersk on the Nordic exchanges, Rheinmetall and Siemens in Germany, Millicom, a telecom operator listed in Luxembourg, ConocoPhillips, Eli Lilly, Gilead Sciences and Parker Hannifin in the US and Japan’s SoftBank, Sony and Toyota. The macro agenda begins with China's July trade balance. This will be followed by Sweden's consumer price index (CPI) for July and Germany's trade balance and industrial production figures for June. The Bank of England will also issue an interest rate statement. From the U.S. we will receive weekly jobless claims, wholesale inventories for June, and the New York Federal Reserve’s (Fed) inflation expectations.
The macro agenda on Friday, 8 August, begins with Japanese household consumption and the current account balance for June. A few hours later, the Swedish Central Bureau of Statistics (SCB) will release household consumption and industrial orders for June. The day will conclude with Canada's unemployment figures for July.
A strong performance over the summer may continue for some time
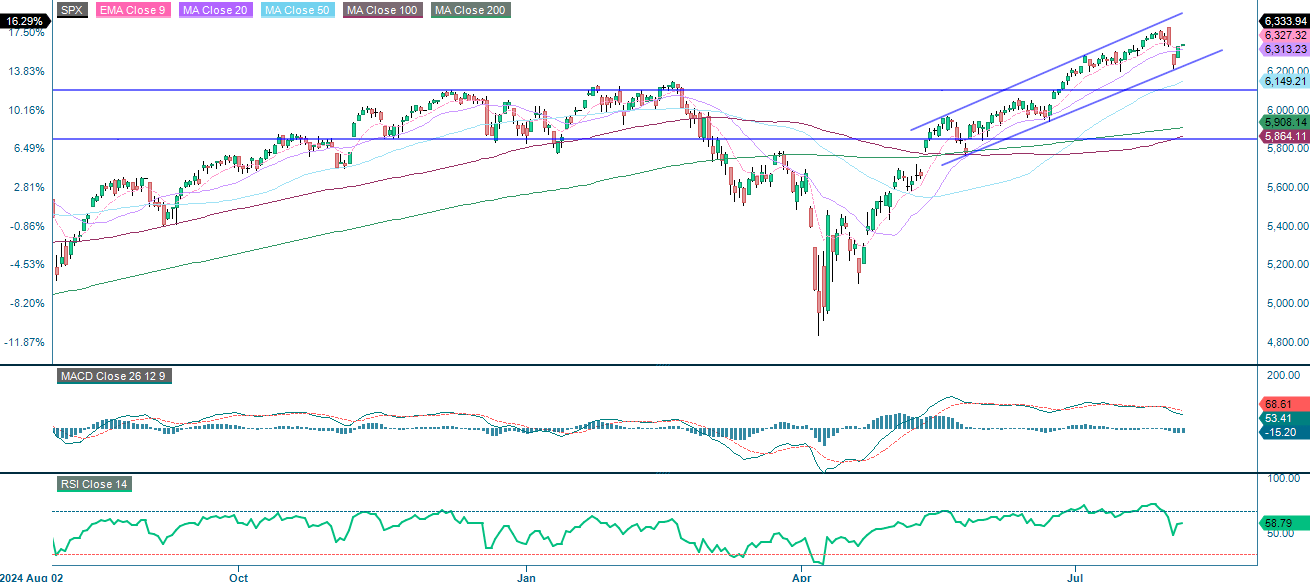
The S&P 500 remains firmly bullish in its primary trend, supported by all major moving averages. However, short-term momentum is softening, with a bearish MACD crossover and an elevated relative strength index (RSI) suggesting a potential consolidation or pullback. Key support lies between 6,100 and 6,150; the lower channel must hold for the bulls to maintain control. Conversely, a break below this level could signal a deeper correction. If the recent high is surpassed, the uptrend is likely to continue; otherwise, expect a range-bound move between 6,200 and 6,400. Overall, the outlook remains bullish unless key support levels are breached.
Related Products
S&P 500 (in USD), one-year daily chart
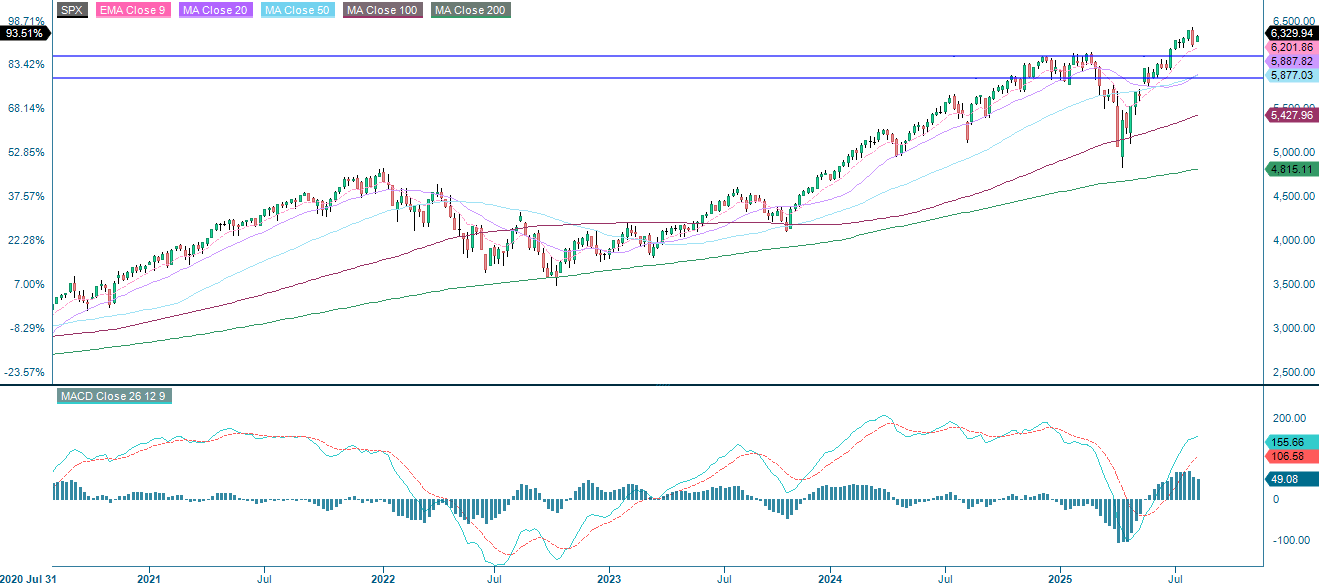
S&P 500 (in USD), weekly five-year chart
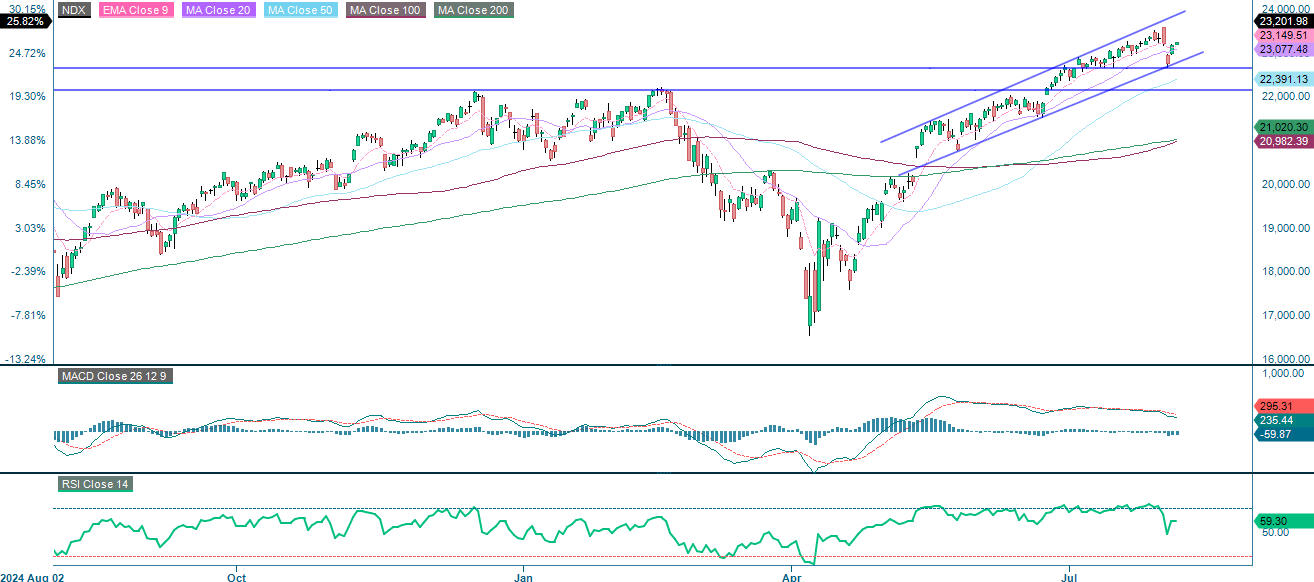
The NASDAQ 100 is still in a strong upward trend, as indicated by an ascending channel, higher highs and higher lows. Although MACD and the relative strength index (RSI) indicate weakening momentum, suggesting the possibility of consolidation or a minor pullback, the overall trend remains bullish. Key support levels, which are crucial to maintaining the uptrend, are found at 22,650 and 22,150, followed by the lower channel. A break below these levels could lead to a sharper correction. Breaking above the recent high would likely trigger the next upward movement. Overall, the outlook remains positive as long as the key support levels hold.
Related Products
NASDAQ 100 (in USD), one-year daily chart
NASDAQ 100 (in USD), weekly five-year chart

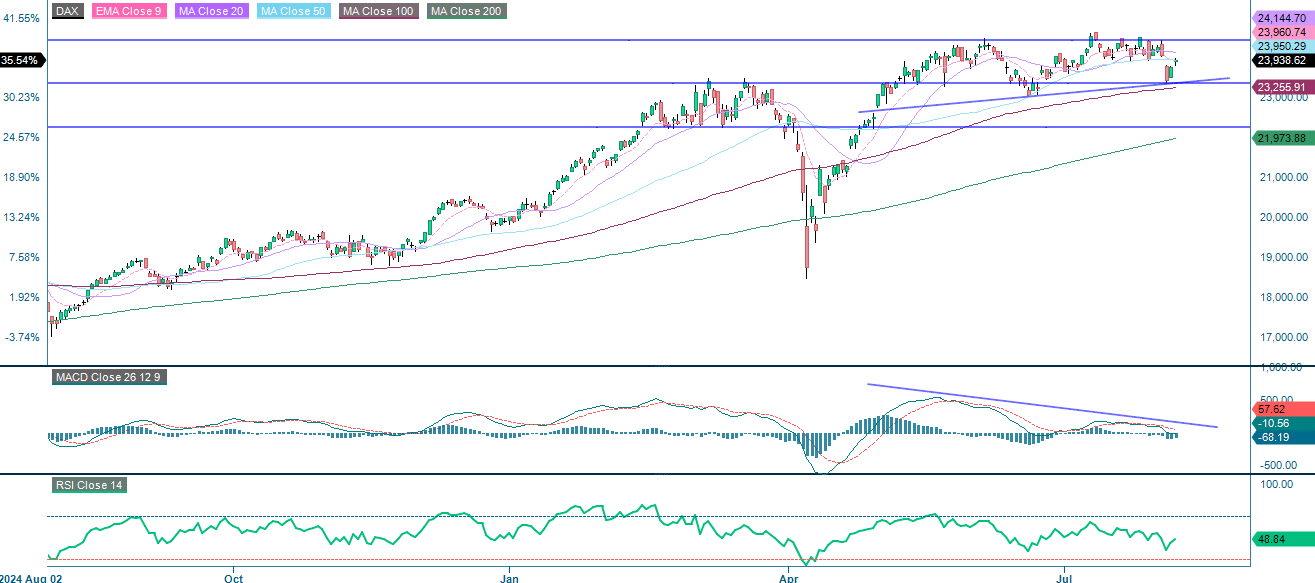
In Europe, the DAX is still in an uptrend, but weakening momentum — as indicated by MACD bearish divergence and a neutral RSI — calls for caution. Key support lies in the 23,250–23,400 zone. Holding this area could trigger a rebound, while a breakdown could lead to a deeper pullback towards the MA200. Upside is limited by resistance at 24,145; a breakout above this level would confirm continuation of the bullish trend. Overall, the index is consolidating following a strong rally, and the outlook remains positive as long as key support levels are maintained.
Related Products
DAX (in EUR), one-year daily chart
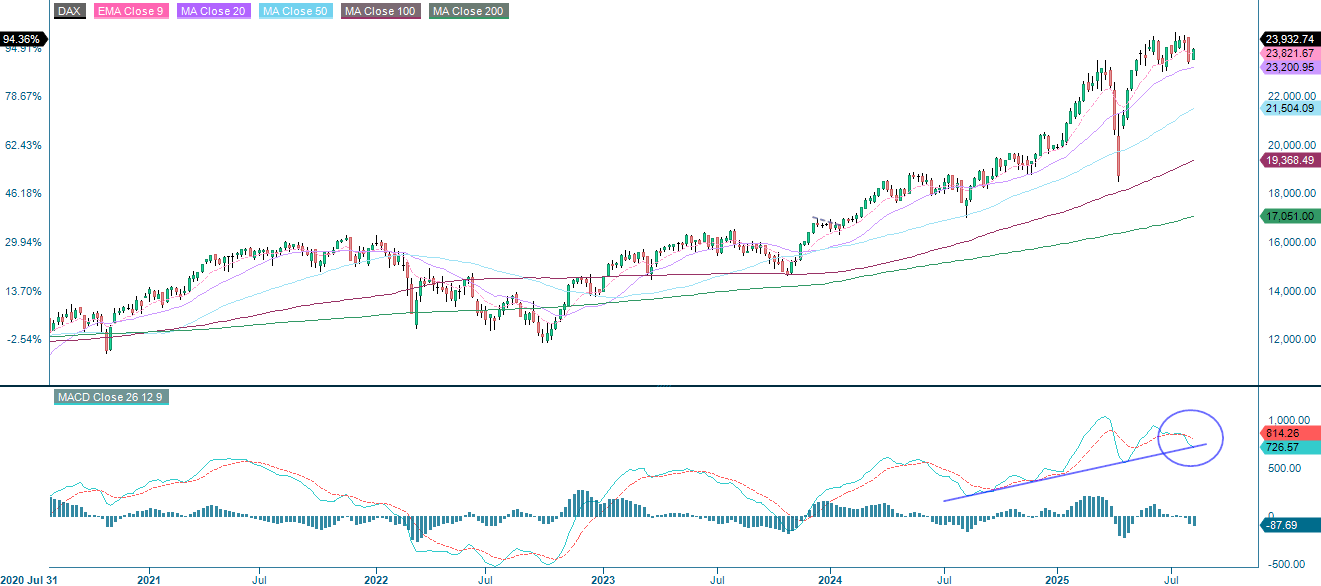
DAX (in EUR), weekly five-year chart
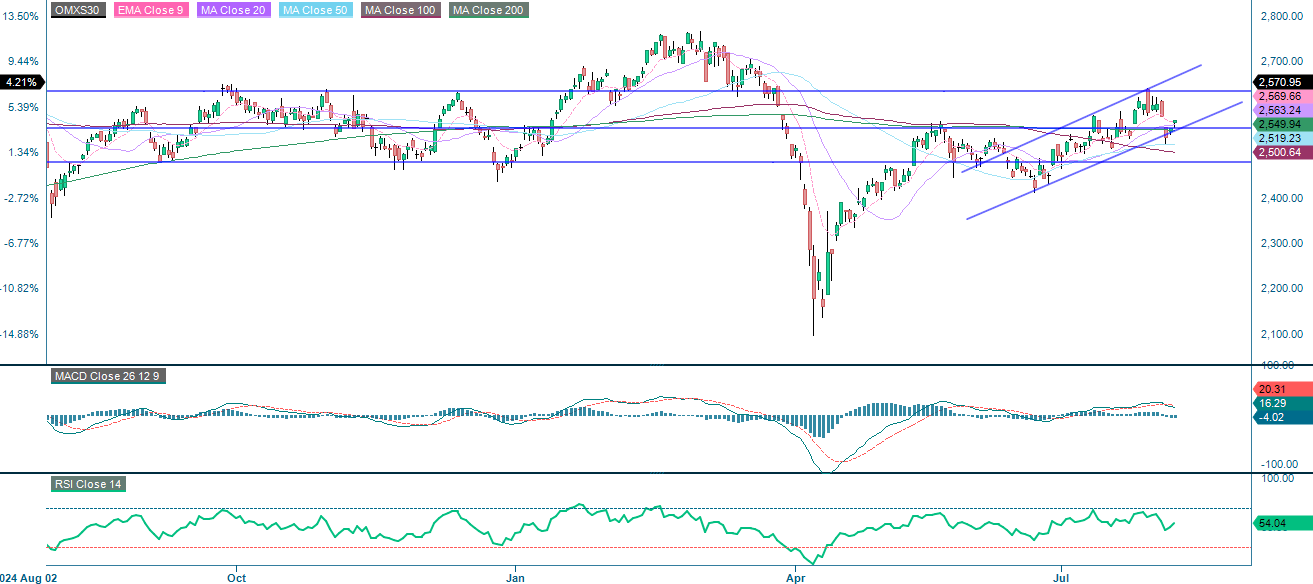
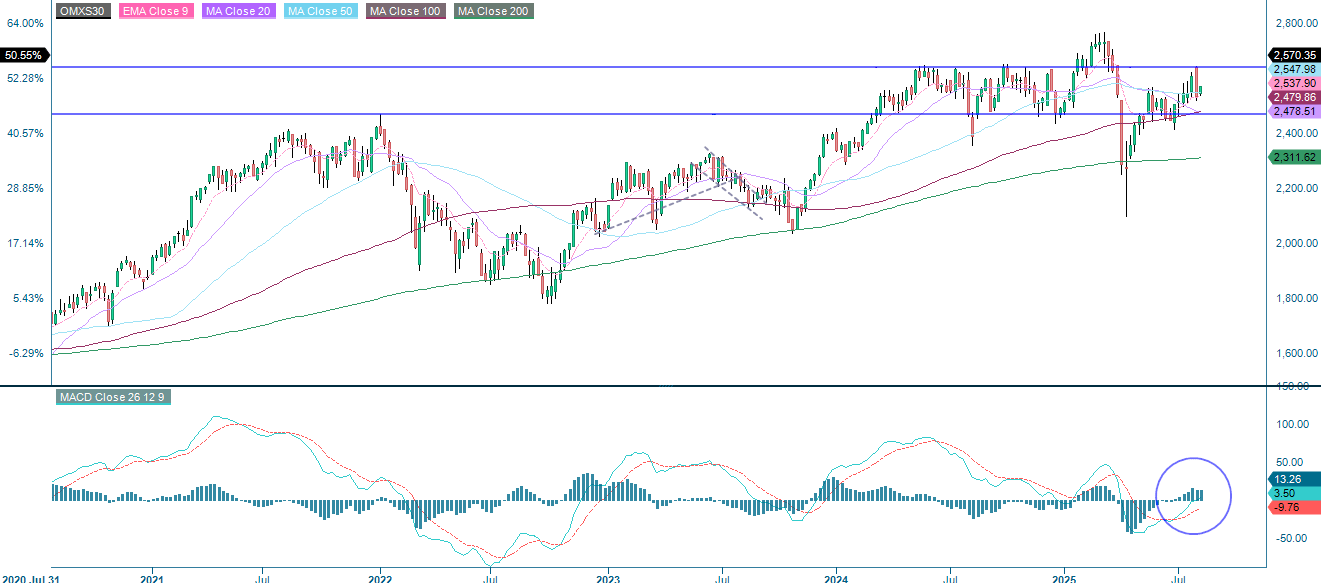
As can be seen from the daily chart below, OMXS30 has a bullish short- to medium-term outlook while it remains above the key support zone of 2,500–2,550. Breaking below this level would warrant caution. While a push higher is possible if recent highs are reclaimed, softening MACD momentum suggests that traders should remain vigilant for potential bearish divergence or a pullback. With the RSI showing no extreme conditions, the index retains directional flexibility, and the bullish bias remains intact as long as the support level is maintained. Additionally, the MACD recently generated a buy signal on the weekly chart. From this perspective, the OMXS30 may be a more attractive option for long positions than the DAX, for example.
Related Products
OMX30 (in SEK), one-year daily chart
OMX30 (in SEK), weekly five-year chart
The full name for abbreviations used in the previous text:
EMA 9: 9-day exponential moving average
Fibonacci: There are several Fibonacci lines used in technical analysis. Fibonacci numbers are a sequence in which each successive number is the sum of the two previous numbers.
MA20: 20-day moving average
MA50: 50-day moving average
MA100: 100-day moving average
MA200: 200-day moving average
MACD: Moving average convergence divergence
Risks
Credit risk of the issuer:
Investors in the products are exposed to the risk that the Issuer or the Guarantor may not be able to meet its obligations under the products. A total loss of the invested capital is possible. The products are not subject to any deposit protection.
Currency risk:
If the product currency differs from the currency of the underlying asset, the value of a product will also depend on the exchange rate between the respective currencies. As a result, the value of a product can fluctuate significantly.
Market risk:
The value of the products can fall significantly below the purchase price due to changes in market factors, especially if the value of the underlying asset falls. The products are not capital-protected
Product costs:
Product and possible financing costs reduce the value of the products.
External author:
This information is in the sole responsibility of the guest author and does not necessarily represent the opinion of Bank Vontobel Europe AG or any other company of the Vontobel Group. This information is sponsored by Bank Vontobel Europe AG, which may be a counterparty to transactions involving the financial instruments discussed in this information. The further development of the index or a company as well as its share price depends on a large number of company-, group- and sector-specific as well as economic factors. When forming his investment decision, each investor must take into account the risk of price losses. Please note that investing in these products will not generate ongoing income.
The products are not capital protected, in the worst case a total loss of the invested capital is possible. In the event of insolvency of the issuer and the guarantor, the investor bears the risk of a total loss of his investment. In any case, investors should note that past performance and / or analysts' opinions are no adequate indicator of future performance. The performance of the underlyings depends on a variety of economic, entrepreneurial and political factors that should be taken into account in the formation of a market expectation.
Risk with leverage products:
Due to the leverage effect, there is an increased risk of loss (risk of total loss) with leverage products, e.g. Bull & Bear Certificates, Warrants and Mini Futures.
Disclaimer:
This information is neither an investment advice nor an investment or investment strategy recommendation, but advertisement. The complete information on the products (securities) mentioned herein, in particular the structure and risks associated with an investment, are described in the base prospectus, together with any supplements, as well as the final terms relating to the securities. The base prospectus and final terms constitute the solely binding sales documents for the products mentioned herein. It is recommended that potential investors read these documents before making any investment decision. The documents and the key information document are published on the website of the issuer, Vontobel Financial Products GmbH, Bockenheimer Landstrasse 24, 60323 Frankfurt am Main, Germany, on https://prospectus.vontobel.com and are available from the issuer free of charge. The approval of the prospectus should not be understood as an endorsement of the securities. The securities are products that are not simple and may be difficult to understand. This information includes or relates to figures of past performance. Past performance is not a reliable indicator of future performance. This information may only be distributed or published in countries where such distribution or publication is permitted by applicable law. As stated in the relevant base prospectus, the distribution of the securities mentioned in this information is subject to restrictions in certain jurisdictions. This advertisement may not be reproduced or redistributed without prior permission by Vontobel.
© Bank Vontobel Europe AG and / or affiliated companies. All rights reserved.