The US poses a risk to bond investors


Bond investors are facing many uncertainties. If implemented, trade wars and tariffs are likely to cause inflation. On top of that, there is the Trump 'big and beautiful' tax bill, which was approved by the US House of Representatives late last week and is expected to increase the US federal deficit. This week's case study focuses on the US 10-year Treasury yield. Although our technical analysis indicates bullish trends for US equity indices, consolidation may be imminent. In the meantime, the OMX is falling behind the other indices.
Case of the week: TACOs or tariffs?
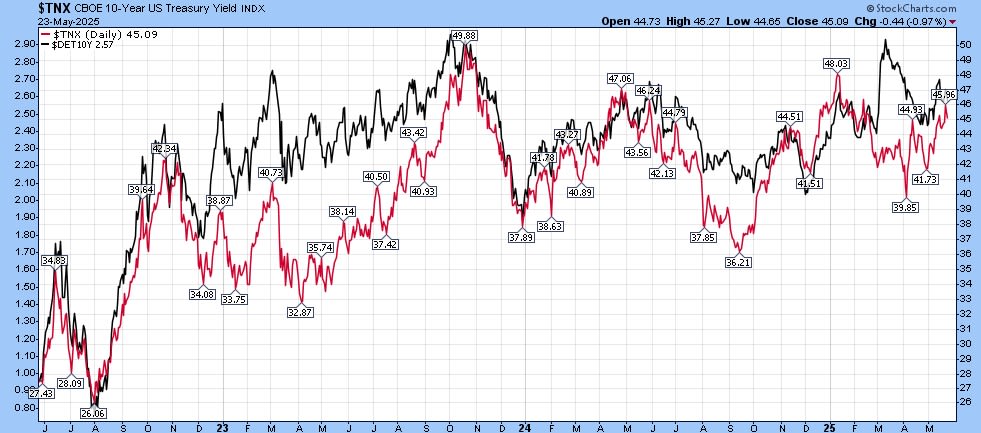
US ten-year Treasury interest rates have been volatile in 2025. However, unlike rates on many other sovereign bonds, they have remained almost unchanged overall throughout the year. The graph below shows the US 10-year yield versus the German 10-year Treasury yield over the last three years.
US and German 10-year Treasury yields (%), three-year daily chart
Bond investors are facing many uncertainties. If implemented, trade wars and tariffs are likely to be inflationary. It is worrying that the Trump administration is promoting tariffs as a potentially important source of revenue ('taxing foreigners') rather than simply as a negotiating tool in trade talks. If Trump is more determined to implement tariffs than Treasury bulls are hoping, the bond market may sell off further. Meanwhile, equity markets have adopted a more tranquil trading stance, resulting in the acronym TACO ("Trump Always Chickens Out").
According to the Financial Times, treasuries were also sold ahead of Trump’s “big, beautiful” tax bill. The bill will extend the tax cuts that were implemented during the president’s first term in 2017. The Committee for a Responsible Federal Budget claims that the bill will increase the US debt-to-GDP ratio from 100 to 125 per cent.
The Federal Reserve is in a tough spot due to a combination of loose fiscal policy and potentially inflationary trade policies. In that scenario, any rate cuts seem out of the question. Despite the rate cuts implemented by the Fed last year, the 10-year interest rate has risen by around 100 basis points since October 2024. This is another indication that bond investors are becoming increasingly anxious about developments in Washington. With the July 9 deadline for the 90-day delay of reciprocal tariffs approaching and Trump’s tax bill moving through the US Congress, a jittery summer and higher interest rates are possible.
Although rates fell back somewhat after the spike following 'Liberation Day' on 2 April, the US 10-year yield has moved steadily upwards again since the beginning of May, showing a positive trend in both the daily and weekly charts.
Related Products
US 10-year Treasury yield (%), one-year daily chart

US 10-year Treasury yield (%), five-year weekly chart

Macro comments
Interim reports from Nvidia and Salesforce will be released in the US on Wednesday 28 May. Meanwhile, Statistics Sweden will publish figures for April's retail sales, household lending and trade balance. In addition, France's Q1 GDP and Germany's May unemployment figures will be released, as will April's Eurozone household inflation expectations. From the US, the May Richmond Fed Index, Redbook's weekly retail sales figures, the API’s weekly oil inventory statistics and the minutes from the 7 May Fed meeting are anticipated. Please note that the Stockholm Exchange will close at 13:00 CET on 28 May, as 29 May is a public holiday.
On Thursday, 29 May, the US is set to release data on initial jobless claims, Q1 GDP, pending home sales, and weekly oil inventories from the Department of Energy (DOE). Interim reports are also expected from Costco Wholesale in the US and the Royal Bank of Canada. However, as Thursday is a public holiday in the Nordic countries, the Nordic stock exchanges will be closed for trading that day.
The macroeconomic news agenda on Friday 30 May begins with the release of Japan's April unemployment, industrial production and retail sales figures. A few hours later, Sweden's Q1 GDP, Germany's April retail sales and import prices, as well as Spain's May CPI will be announced. Shortly afterwards, Italy's Q1 GDP and its and Germany's May CPI will be announced. From North America, Canada's Q1 GDP and US personal consumption and inflation (PCE), the goods trade balance and wholesale inventories for April will be announced. From the US, the Chicago PMI and the Michigan index for May will also be released.
Nvidia (USD), five-year weekly chart

Consolidation for US equities is on the cards, while Sweden is lagging
The chart below shows the S&P 500 in a recovery phase. It is currently trading at around 5,890, which is above the MA20, MA50 and MA100. This suggests bullish momentum and room for further upside. Key support lies at around 5,770–5,785, while resistance is near the recent highs, just below 6,200. Overall, the trend remains bullish, but caution is warranted given the short-term MACD is close to generating a soft sell signal. A consolidation phase may be on the horizon.
S&P 500 (in USD), one-year daily chart

S&P 500 (in USD), five-year weekly chart

As can be seen from the NASDAQ 100 chart below, the index is currently trading above its key moving averages (MA20, MA50 and MA100). Immediate support is found around the 21,000 level, while resistance lies near the recent highs. Overall, the trend is bullish, though the index may undergo short-term consolidation before attempting a breakout.
NASDAQ 100 (in USD), one-year daily chart
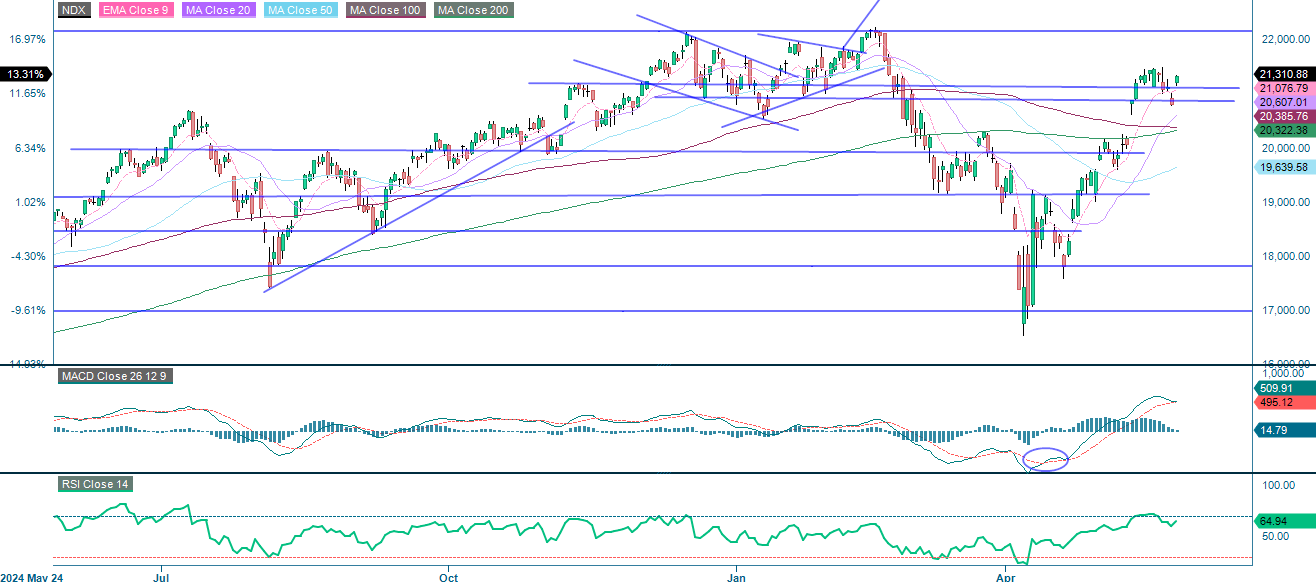
Please note that the MACD indicator has generated a soft buy signal on the weekly chart below.
NASDAQ 100 (in USD), five-year weekly chart

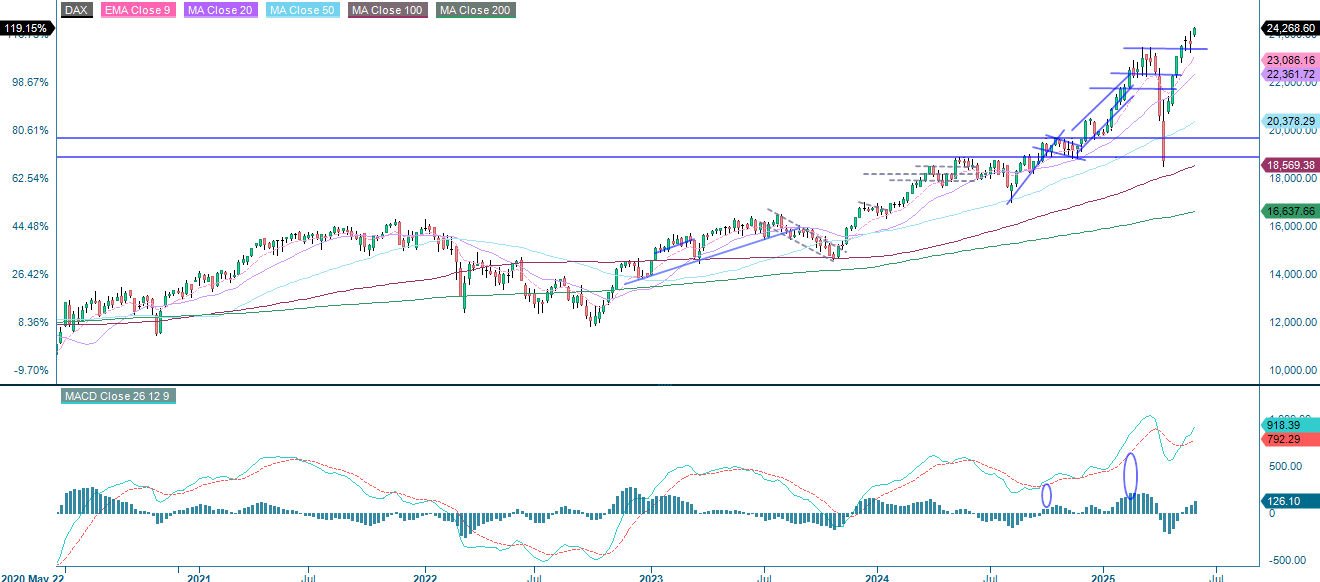
The DAX index has resumed its strong upward trend, hitting a new high following yesterday's close. The price is now well above all the major moving averages, with the 9-day EMA leading the way, which indicates robust bullish momentum. The RSI stands at 67.74, approaching overbought levels and suggesting strong momentum, as well as the potential for short-term consolidation. The MACD also confirms positive but decreasing momentum; however, a pause or minor pullback could occur following the recent strong rally.
DAX (in EUR), one-year daily chart

DAX (in EUR), five-year weekly chart
The OMXS30 is lagging the other indices as several key moving averages have yet to be reclaimed. For a more sustained bullish trend to be confirmed, a break above the cluster of resistance near 2,560 would be needed, while a drop below 2,473 may expose the index to further downside. Overall, the index is in a consolidation zone and traders may wait for confirmation of a breakout either way.
OMX30 (in SEK), one-year daily chart

OMX30 (in SEK), five-year weekly chart

The full name for abbreviations used in the previous text:
EMA 9: 9-day exponential moving average
Fibonacci: There are several Fibonacci lines used in technical analysis. Fibonacci numbers are a sequence in which each successive number is the sum of the two previous numbers.
MA20: 20-day moving average
MA50: 50-day moving average
MA100: 100-day moving average
MA200: 200-day moving average
MACD: Moving average convergence divergence
Risks
External author:
This information is in the sole responsibility of the guest author and does not necessarily represent the opinion of Bank Vontobel Europe AG or any other company of the Vontobel Group. This information is sponsored by Bank Vontobel Europe AG, which may be a counterparty to transactions involving the financial instruments discussed in this information. The further development of the index or a company as well as its share price depends on a large number of company-, group- and sector-specific as well as economic factors. When forming his investment decision, each investor must take into account the risk of price losses. Please note that investing in these products will not generate ongoing income.
The products are not capital protected, in the worst case a total loss of the invested capital is possible. In the event of insolvency of the issuer and the guarantor, the investor bears the risk of a total loss of his investment. In any case, investors should note that past performance and / or analysts' opinions are no adequate indicator of future performance. The performance of the underlyings depends on a variety of economic, entrepreneurial and political factors that should be taken into account in the formation of a market expectation.
Market risk:
The value of the products can fall significantly below the purchase price due to changes in market factors, especially if the value of the underlying asset falls. The products are not capital-protected
Product costs:
Product and possible financing costs reduce the value of the products.
Risk with leverage products:
Due to the leverage effect, there is an increased risk of loss (risk of total loss) with leverage products, e.g. Bull & Bear Certificates, Warrants and Mini Futures.
Currency risk:
If the product currency differs from the currency of the underlying asset, the value of a product will also depend on the exchange rate between the respective currencies. As a result, the value of a product can fluctuate significantly.
Credit risk of the issuer:
Investors in the products are exposed to the risk that the Issuer or the Guarantor may not be able to meet its obligations under the products. A total loss of the invested capital is possible. The products are not subject to any deposit protection.