The pause in US-China tariffs has boosted stock markets


This week's case study focuses on Palantir Technologies, a company which delivered a robust interim report this week. Its market capitalisation has grown so much that it is now one of the ten most valuable technology companies. However, compared with other tech giants, Palantir's valuation appears stretched. Meanwhile, the announcement that the US and China will reduce tariffs on each other's goods for 90 days has sent equity markets near their recent highs.
Case of the week: Palantir joins tech's elite — but can the valuation hold?
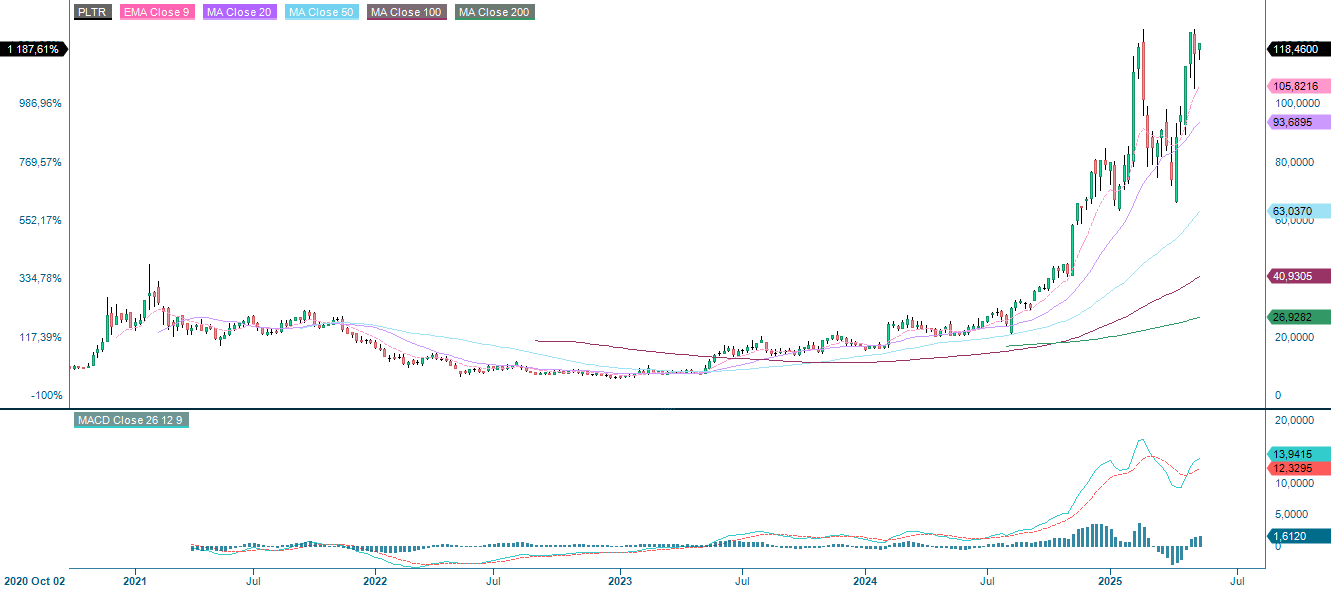
Palantir Technologies recently reported strong results for the first quarter of 2025, generating $884 million in revenue and beating Wall Street expectations by around $22 million. Notably, US commercial revenue grew at an impressive rate of 71%.
After a successful quarter, Palantir joined the ranks of the top 10 most valuable tech companies by market capitalisation, overtaking Salesforce to claim 10th place. The company's current valuation exceeds $280 billion.
That placement is striking, especially considering that Oracle, the next company on the list, recently reported $14 billion in quarterly revenue. Oracle is rapidly expanding its AI-driven cloud business which generates around 15 times more revenue than Palantir.
When compared to other leading tech companies, Palantir's valuation seems even more inflated. Both Snowflake and CrowdStrike, recognised leaders in AI-powered data and cybersecurity, reported slightly higher revenues than Palantir, yet their market caps remain much lower.
Currently, Snowflake is trading at around 13x forward revenue, with a market capitalisation of less than $60 billion. Despite trading at over 21x forward sales, CrowdStrike still appears to offer better relative value. Meanwhile, Palantir is trading at over 71x projected revenue, which is far above that of its peers.
Like many tech companies, Palantir uses stock-based compensation (SBC) to attract and retain talent. However, the level of SBC at Palantir is unusually high, which puts pressure on shareholders who are already paying a premium for the stock. In Q1 of 2025, Palantir's diluted share count increased by 155 million year-on-year, rising from 2.4 billion to 2.55 billion.
Looking ahead, consensus estimates suggest that Palantir will generate $6.6 billion in revenue by 2027. If the company were to trade at a more typical sales multiple of 10x, this would imply a market capitalisation of around $66 billion. In order to reach a share price of $200 in three years — equivalent to a valuation of $560 billion — Palantir would have to deliver annual returns of almost 20% and see its share count rise to around 2.8 billion. This level of dilution is actually conservative compared to 2024 trends.
In order to justify that level of potential growth, Palantir would need to trade at a forward price-to-sales ratio of 85x, which is an extremely aggressive valuation. Many investors seem to underestimate the extent to which dilution is inflating the company's valuation. At these levels, even modest price increases lead to disproportionate increases in valuation multiples, raising concerns about sustainability.
The major risk is a sharp revaluation, similar to what happened with Snowflake. Despite still growing revenue at about 30% annually, that stock once traded near $400 in late 2021 but has since lost more than half its value.
If Palantir were to trade at the more modest forward sales multiple of 13x, as Snowflake does today, it would be worth about $86 billion in 2027. Assuming 2.8 billion shares are outstanding, this would imply a stock price of just $31 — a steeper drop than Snowflake has experienced over the past three years.
Ultimately, Palantir's valuation far exceeds what its growth justifies. While momentum and hype surrounding artificial intelligence (AI) could keep driving the stock price up in the short term, the company's fundamentals do not support its current position among the top 10 tech giants. For long-term investors, now may be a good time to take a step back before the market catches up with reality.
Related Products
Palantir (USD), one-year daily chart

Palantir (USD), five-year weekly chart
Macro comments
The announcement that the US and China would mutually reduce tariffs between the two countries for 90 days (from 145% to 30% in the US and from 125% to 10% in China) sent Asian, European and US stock indices higher on Monday 12th May. However, the bond market also pushed the US 10-year Treasury note up 8 basis points (bps) to 4.46% on fears of rising inflation. The US-China trade deal is positive for global economic activity, with China looking like the winner. The US delegation must have realised that the earlier, much higher tariffs would have hit the US economy hard.
On Wednesday, 14 May, the interim reports from Lundbeck in Denmark, Daimler Truck in Germany, Cisco in the US, and Sony and Tencent in Japan and China, respectively are expected.
Macroeconomic news will include the April Consumer Price Index (CPI) figures from Sweden, Germany and Spain. OPEC will release its monthly oil report, and also the weekly oil inventories (DOE) from the US are expected.
Interim reports will be released on Thursday 15 May by Nibe in Sweden, ThyssenKrupp in Germany, and the US companies Applied Materials, Deere & Company and Walmart, as well as the Chinese e-commerce giant Alibaba. The day's macroeconomic news will begin with the UK's Gross Domestic Product (GDP) figures for Q1 and industrial production figures for March. This will be followed by Germany's wholesale prices and France's CPI for April. From the eurozone, first-quarter GDP and employment figures will be released, as well as April's industrial production figures. The IEA (International Energy Agency) will also release a monthly oil report. The US will contribute the following: Producer Price Index (PPI) (see graph below), retail sales and industrial production for April, the Empire Manufacturing Index, the Philadelphia Fed Index and the NAHB Housing Market Index for May as well as weekly initial jobless claims and unsold inventories for March.
On Friday, 16th May, our macro news feed will start with Japan's Q1 GDP and March industrial production. We will also get Italy's CPI for April and the Euro-zone trade balance for March. From the US, April housing and import prices and the Michigan index for May will be released.
US. Producer Price Index (PPI) year-on-year, Jan 2021-March 2025

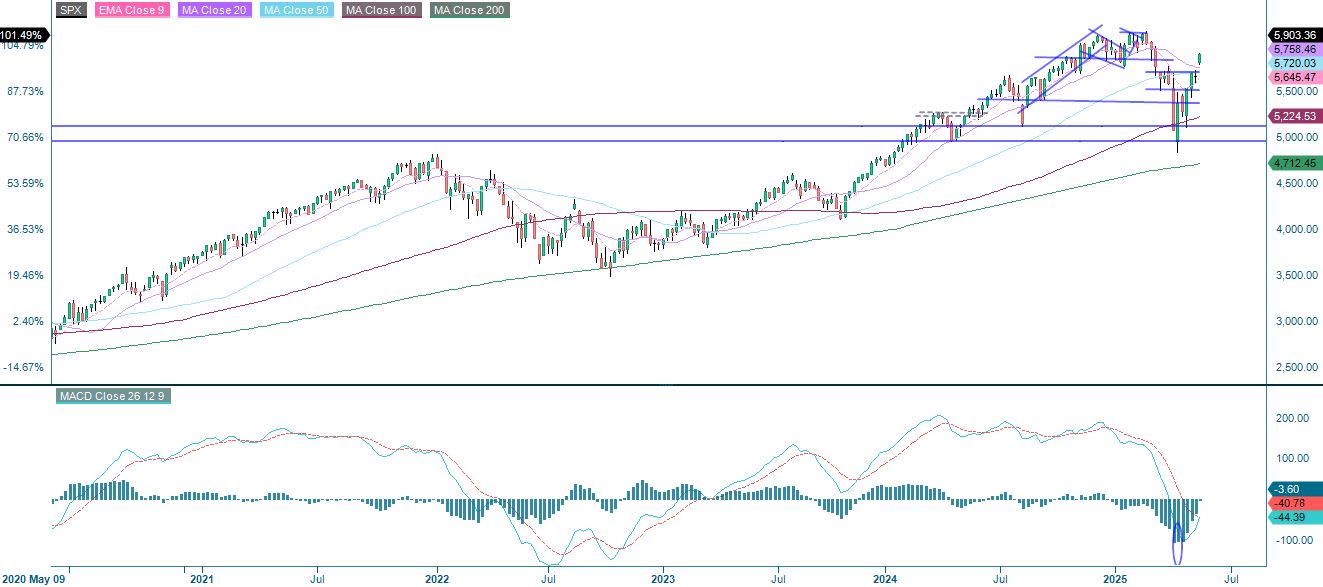
US equity indices are approaching the highs seen in early 2025.
The S&P 500 is showing strong bullish momentum, having broken above the key resistance level of 5,850 and holding near 5,900. The MACD is bullish, showing rising momentum, and the Realtive Strength Index (RSI) of almost 68 indicates significant buying interest, although it is approaching overbought territory. Short-term consolidation is possible, but the trend remains bullish.
Related Products
S&P 500 (in USD), one-year daily chart
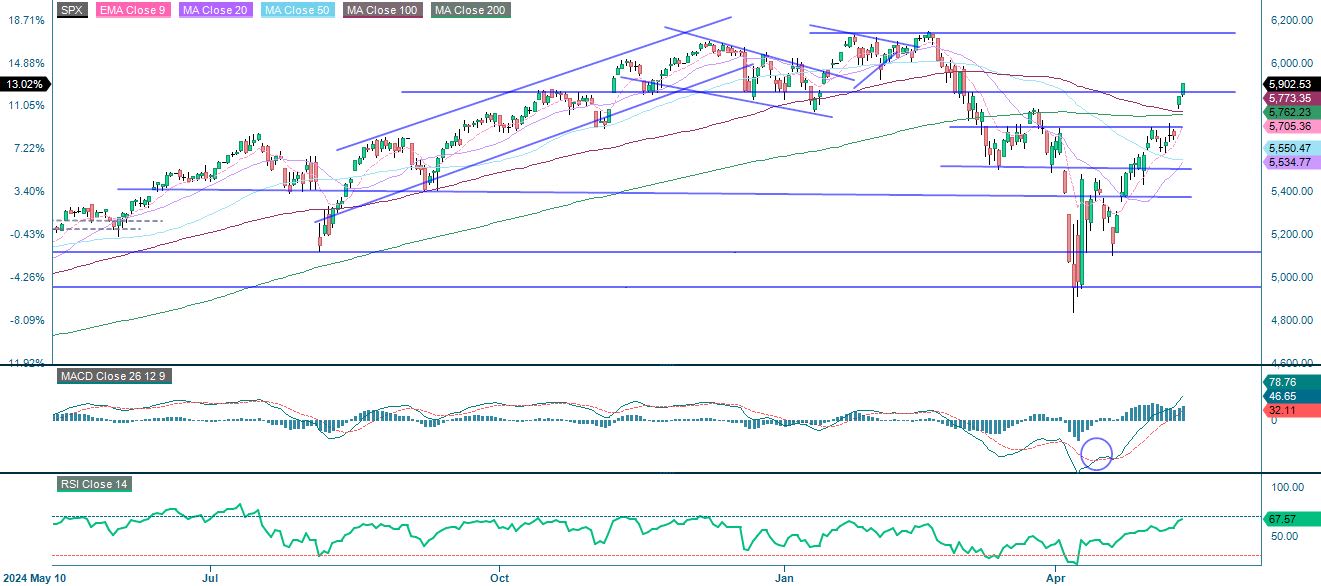
S&P 500 (in USD), five-year weekly chart
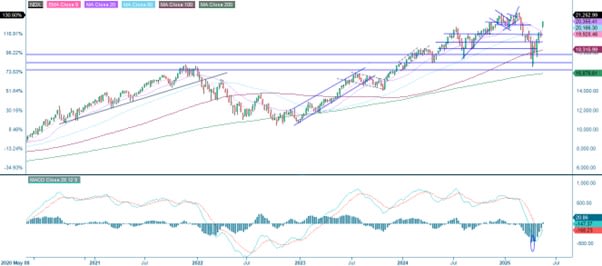
The chart below shows the NASDAQ-100 breaking out strongly above the resistance level of 21,000, which confirms bullish momentum. The price has surged past all the key moving averages, indicating a broad uptrend. The MACD continues to rise, suggesting an increase in upward momentum. The RSI is at 70.28, entering overbought territory, which may lead to a short-term consolidation or a pullback. Nevertheless, the overall technical outlook remains positive, bolstered by robust price action and momentum indicators.
Related Products
NASDAQ 100 (in USD), one-year daily chart
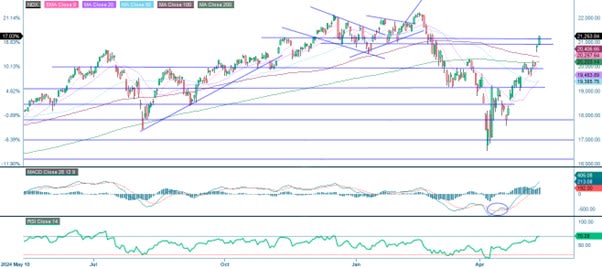
Note that MACD has generated a soft buy singal in the weekly chart below.
NASDAQ 100 (in USD), five-year weekly chart
Similar to the US, the German DAX index chart shows a robust bullish recovery. The price has recently surpassed the significant resistance level of around 23,200, continuing to rise. All major moving averages have been reclaimed, which supports the bullish trend. The MACD shows strong upward momentum, with a significant gap between the MACD and signal lines following a recent bullish crossover. The RSI is at 67.90, approaching overbought territory, but leaving room for further growth. Although short-term consolidation is possible due to stretched momentum, the breakout above prior highs suggests a bullish continuation.
DAX (in EUR), one-year daily chart
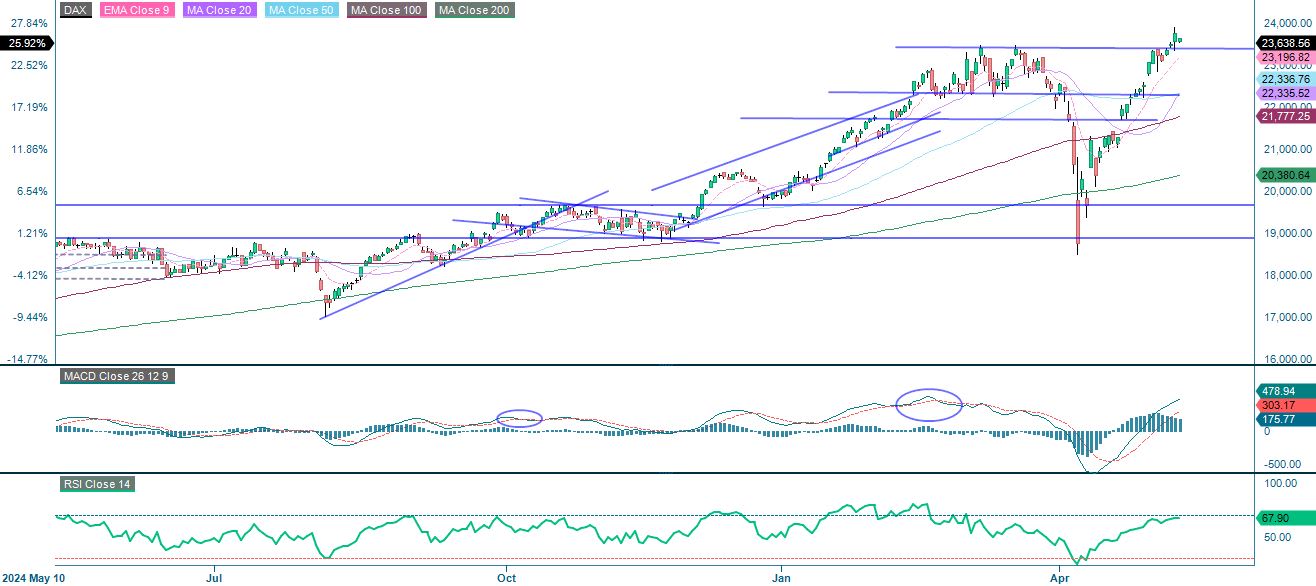
DAX (in EUR), five-year weekly chart

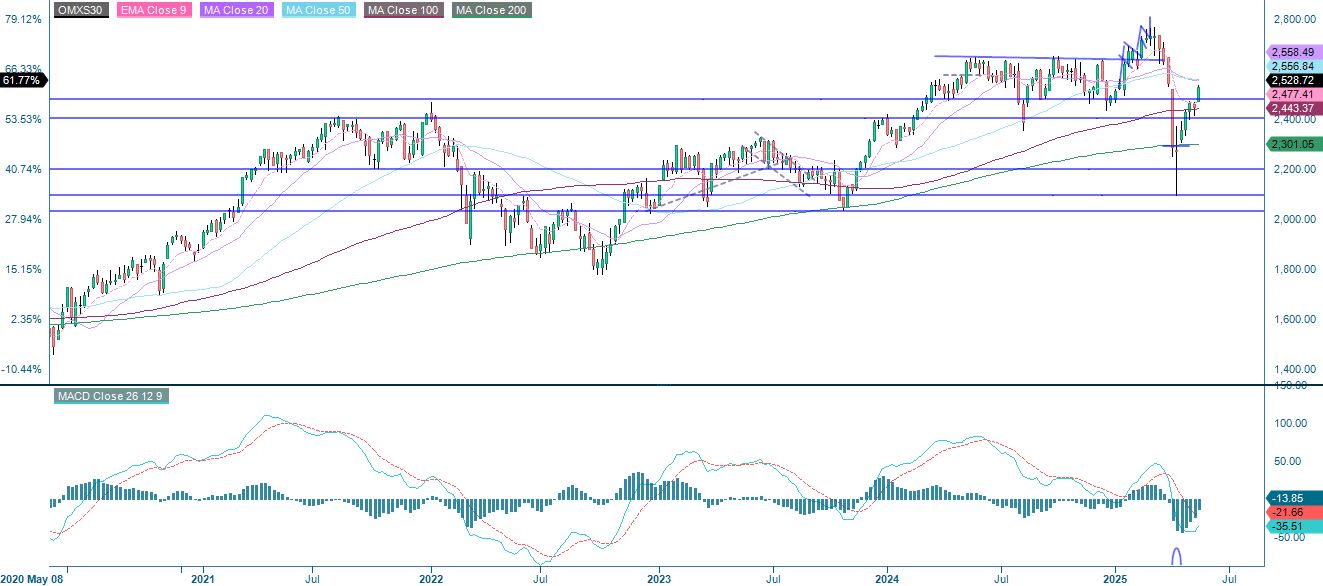
The OMXS30 is continuing its recovery, but is clearly lagging behind the German DAX. The index is now trading above the key resistance level of 2,500 and is approaching the MA200 level, which is currently at 2,557 and will be the next major hurdle. The MACD recently generated a buy signal, confirming bullish momentum. The RSI stands at 61.38, indicating healthy momentum and suggesting there is room for further upside before the market becomes overbought. From a technical perspective, if the OMXS30 can break above the MA200, it may be a more favourable option for a long position.
Related Products
OMX30 (in SEK), one-year daily chart
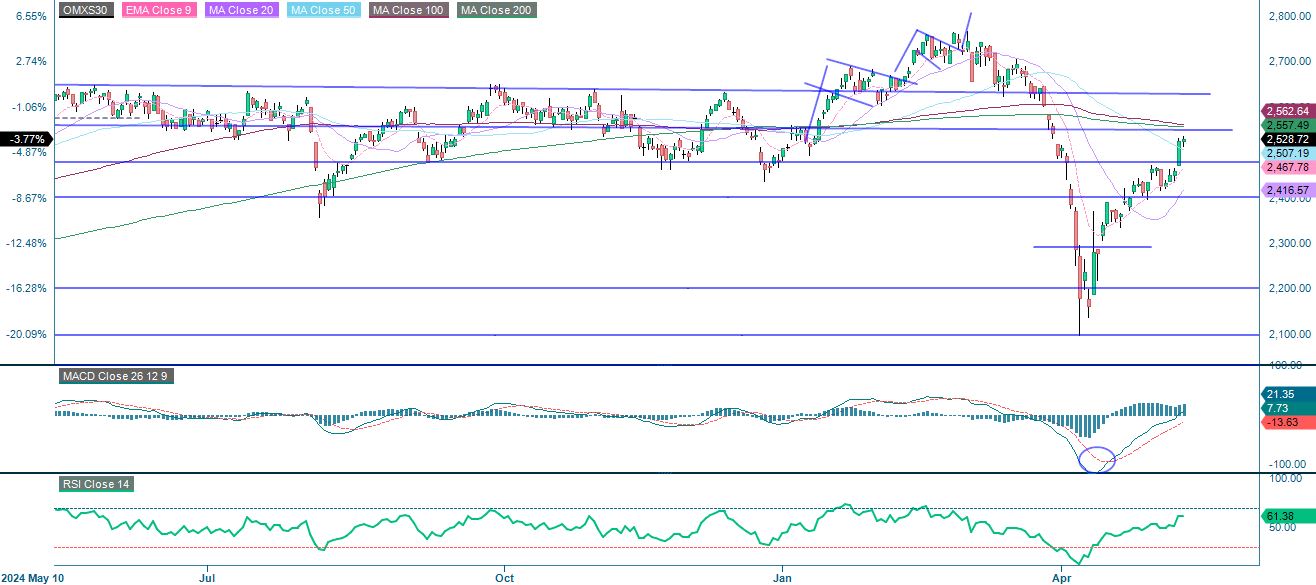
OMX30 (in SEK), five-year weekly chart
The full name for abbreviations used in the previous text:
EMA 9: 9-day exponential moving average
Fibonacci: There are several Fibonacci lines used in technical analysis. Fibonacci numbers are a sequence in which each successive number is the sum of the two previous numbers.
MA20: 20-day moving average
MA50: 50-day moving average
MA100: 100-day moving average
MA200: 200-day moving average
MACD: Moving average convergence divergence
Risks
Credit risk of the issuer:
Investors in the products are exposed to the risk that the Issuer or the Guarantor may not be able to meet its obligations under the products. A total loss of the invested capital is possible. The products are not subject to any deposit protection.
Currency risk:
If the product currency differs from the currency of the underlying asset, the value of a product will also depend on the exchange rate between the respective currencies. As a result, the value of a product can fluctuate significantly.
External author:
This information is in the sole responsibility of the guest author and does not necessarily represent the opinion of Bank Vontobel Europe AG or any other company of the Vontobel Group. This information is sponsored by Bank Vontobel Europe AG, which may be a counterparty to transactions involving the financial instruments discussed in this information. The further development of the index or a company as well as its share price depends on a large number of company-, group- and sector-specific as well as economic factors. When forming his investment decision, each investor must take into account the risk of price losses. Please note that investing in these products will not generate ongoing income.
The products are not capital protected, in the worst case a total loss of the invested capital is possible. In the event of insolvency of the issuer and the guarantor, the investor bears the risk of a total loss of his investment. In any case, investors should note that past performance and / or analysts' opinions are no adequate indicator of future performance. The performance of the underlyings depends on a variety of economic, entrepreneurial and political factors that should be taken into account in the formation of a market expectation.
Market risk:
The value of the products can fall significantly below the purchase price due to changes in market factors, especially if the value of the underlying asset falls. The products are not capital-protected
Product costs:
Product and possible financing costs reduce the value of the products.
Risk with leverage products:
Due to the leverage effect, there is an increased risk of loss (risk of total loss) with leverage products, e.g. Bull & Bear Certificates, Warrants and Mini Futures.
Disclaimer:
This information is neither an investment advice nor an investment or investment strategy recommendation, but advertisement. The complete information on the products (securities) mentioned herein, in particular the structure and risks associated with an investment, are described in the base prospectus, together with any supplements, as well as the final terms relating to the securities. The base prospectus and final terms constitute the solely binding sales documents for the products mentioned herein. It is recommended that potential investors read these documents before making any investment decision. The documents and the key information document are published on the website of the issuer, Vontobel Financial Products GmbH, Bockenheimer Landstrasse 24, 60323 Frankfurt am Main, Germany, on https://prospectus.vontobel.com and are available from the issuer free of charge. The approval of the prospectus should not be understood as an endorsement of the securities. The securities are products that are not simple and may be difficult to understand. This information includes or relates to figures of past performance. Past performance is not a reliable indicator of future performance. This information may only be distributed or published in countries where such distribution or publication is permitted by applicable law. As stated in the relevant base prospectus, the distribution of the securities mentioned in this information is subject to restrictions in certain jurisdictions. This advertisement may not be reproduced or redistributed without prior permission by Vontobel.
© Bank Vontobel Europe AG and / or affiliated companies. All rights reserved.