Rising interest rates put pressure on stock markets


The sugar market is entering a potentially tighter multi-year period, with production risks concentrated in India and Brazil. The rising price of oil has led to increased demand for ethanol in Brazil, by-product of sugar production. Although oil prices are currently high, they could fall if the situation in the Middle East improves. In India, there is still a chance of rain before the harvest begins, which could cause sugar prices to fall significantly. Overall, rising interest rates, led by those in the US, are putting pressure on stock markets.
Case of the week: The sugar high could be about to crash
After a temporary surplus in 2025/26, the sugar market is entering a potentially tighter multi-year period. Production risks are concentrated in India and Brazil, and a strong El Niño could reduce output simultaneously in both of these major production regions. India’s decision to permit up to 1 million tonnes (MMT) of tariff-free raw sugar imports indicates domestic supply issues and may reduce export availability from one of the world’s largest producers. Meanwhile, Brazil’s ability to switch cane between sugar and ethanol production makes it sensitive to fluctuations in crude oil price fluctuations. While the USDA still forecasts a surplus and higher ending stocks, private-sector forecasts are moving sharply towards a deficit. StoneX expects a shortfall of 1.7 MMT in 2026/27, while Czarnikow projects a deficit of 2.9 MMT in 2027/28.
At the time of writing (mid-September 2026), Brazil is in the active late-season harvest phase rather than the off-season. The main harvest began in early April 2026. By the end of June, mills in the Center-South region had processed 214.47 million tonnes of cane, whithe cumulative sugar production reaching 10.75 million tonnes, marking a 12.38% year-on-year decline. Meanwhile, ethanol production was ahead of the previous season at 11.37 billion litres, marking a 20.44% year-on-year increase. Therefore, the availability of cane is not the most important feature of the current Brazilian crop; how mills allocate it between sugar and ethanol production is also important. At the start of the season, only 33% of crushed cane was allocated to sugar production, with over two-thirds going to ethanol production. This allocation depends on the interplay of prices for raw sugar, ethanol and oil, and achieving a balance between the three is key to the decision-making process. Crude oil prices have been rising sharply since July, with prices now exceeding USD 100 per barrel. This increase is relatively well tracked by with ethanol prices, as ethanol becomes a more attractive alternative when oil prices rise. The ongoing war in Iran is actively driving prices up and causing oil stockpiles in both China and the USA to dwindle, in turn creating further long-term demand for oil.
Brazil produces significantly more ethanol than India, where the current crop cycle is in its late monsoon/growing phase. In Q4, crushing will begin and the first new-season sugar will enter the market. El Niño brought below-normal rainfall during the monsoon season, which forms of the crop cycle. The market is now monitoring whether the end of the season will make up for this, or whether the dry conditions will continue. While sufficient rainfall would boost crop output, but too much could lead to waterlogging and increase the risk of diseases affecting the health of the crop. The Indian government's authorisation of up to 1 MMT of raw sugar imports without taxes may suggest that hopes for sufficient rainfall before crushing are low, at least domestically.
In the past, sugar prices have overreacted to a multi-country weather shock affecting multiple countries before the most important supply information has became available. Brazil is still in its main harvest period and lower crude oil prices could redirect cane from ethanol to sugar production. Furthermore, the USDA’s balance sheet remains much more favourable than private deficit forecasts suggest. Meanwhile, India’s monsoon season has improved significantly from its early-season low, and a larger-than-expected Indian harvest could coincide with Brazil’s ongoing supply to the export market. With speculative positioning already net long, a shift in the sugar/ethanol mix or a series of less bearish crop updates could trigger a significant fall in prices.
Related Products
Sugar #11 October 2026 future (in cents per pound), one-year daily chart

Sugar #11 October 2026 future (in cents per pound), five-year weekly chart

Macro comments
The price of Brent oil has been creeping upwards over the past week. Following the latest attacks, the price rose further to reach $109 per barrel on Thursday, 10 September. However, it has since fallen back to $107 per barrel.
On Wednesday, 9 September, the US Treasury announced an increase in the buyback of long-term government bonds, raising it from the previous range from $2 billion to $4 billion to $6 billion. The intention was to push down long-term interest rates. However, some investors had hoped the figure would be as high as $10 billion.
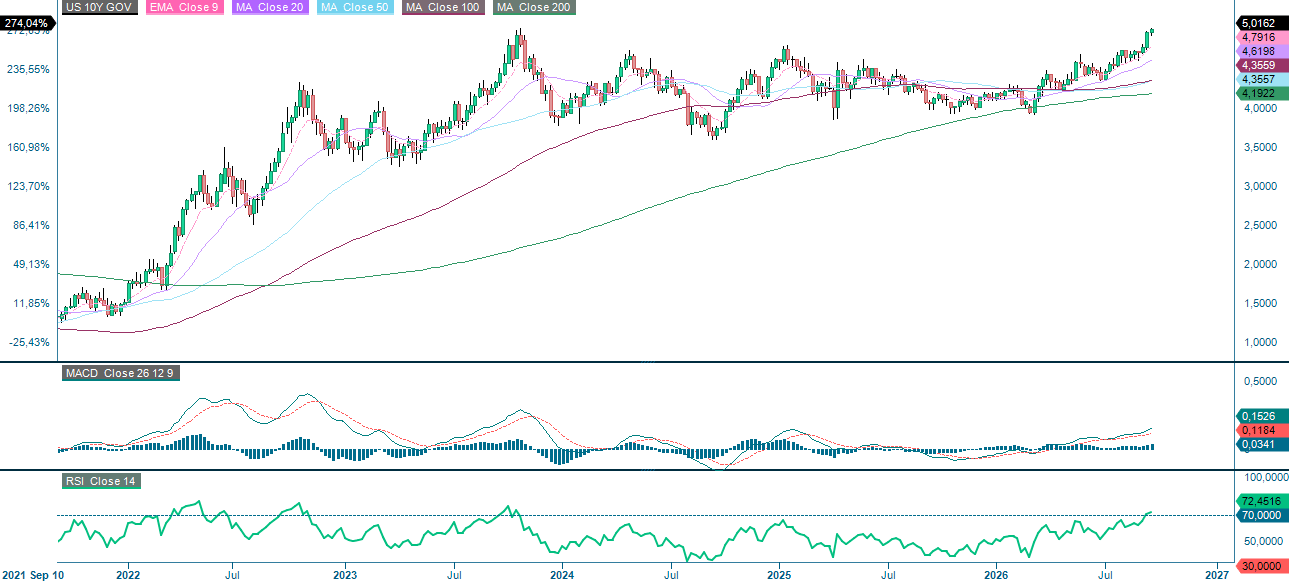
Following the release of US inflation data (producer and consumer price indices) last week, the market now anticipates a 92% probability of a 25-basis-point increase in the Fed's benchmark interest rate on Wednesday 16 September. The market also anticipates a further rate hike from the Federal Reserve later this year, followed by one more in 2027. On Monday 14 September, the yield on the US 10-year Treasury bond surpassed 5 per cent for the first time since October 2023 (see the graph below for the last five years).
Rising interest rates are putting downward pressure on global stock markets. The declines have been moderate so far, however, with the Dow Jones Global Index falling by around 2% over the past month.
The US 10-year Treasury yield (in %) on a five-year weekly chart
Calendar
On Wednesday, 16 September, the stream of macroeconomic news begins with the release Japan’s trade balance and machinery orders figures for July and August and, respectively. Next, the UK’s consumer and producer price indices and retail sales for August, as well as Italy’s consumer price index for August, and the Eurozone’s industrial production figures for July will be examined. Next, the US for retail sales and import prices in August, the NAHB index in September, unsold inventory levels in July, and weekly oil inventory data from the Department of Energy will be released. This will be followed by the Federal Reserve's interest rate decision and forecasts.
On Thursday, 17 September, Volvo Cars will be hosting a Capital Markets Day. In terms of macroeconomic news, the Eurozone consumer price index for August, as well as a rate announcement from the Bank of England are expected. From the US data on housing starts and contracted home purchases in August, the Philadelphia Fed index in September, and weekly jobless claims will be received.
The week's macroeconomic news begins on Friday 18 September, with the release of Japan’s CPI for August and the Bank of Japan’s interest rate decision. Attention will then shift to Europe, where UK retail sales and Germany’s producer price index for August will be released. The Eurozone will release data on the current account and construction output for July. The week will conclude in the US with the release of industrial production and leading indicators for August.
Will the bears continue to put weight on equities?
Looking at the S&P 500, the risk remains on the downside. As can be seen in the chart below, the index is trading close to the 7,600-support level, while the MACD has generated a sell signal. If it breaks below 7,600, the next support level is around 7,500.
Related Products
S&P500 (in USD), one-year daily chart

S&P500 (in USD), five-year weekly chart

The MACD indicator has also generated a sell signal for the Nasdaq 100. The next step could be a break below the support levels of around 28,775 and 28,100.
Related Products
Nasdaq 100 (in USD), one-year daily chart

Nasdaq 100 (in USD), five-year weekly chart

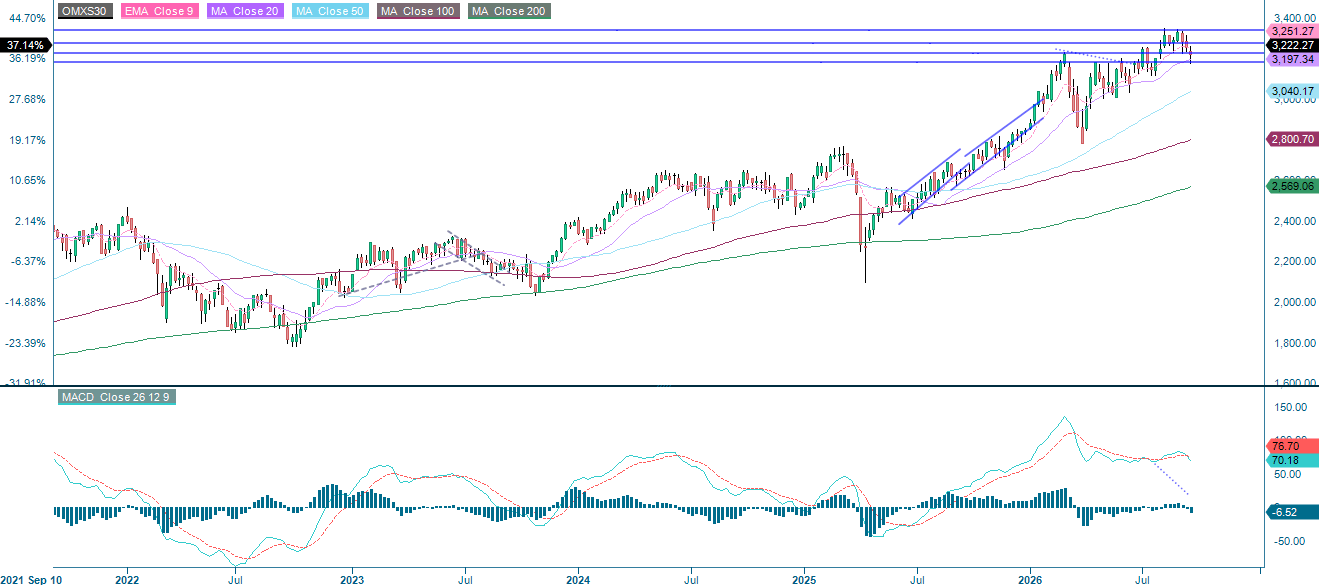
As the chart below shows, the OMXS30 has bounced back strongly from the MA100. However, momentum remains negative and is falling, as shown by the MACD, which has generated a sell signal. If it falls below 3,180, the next support level is around 3,120.
Related Products
OMX30 (in SEK), one-year daily chart

OMX30 (in SEK), five-year weekly chart
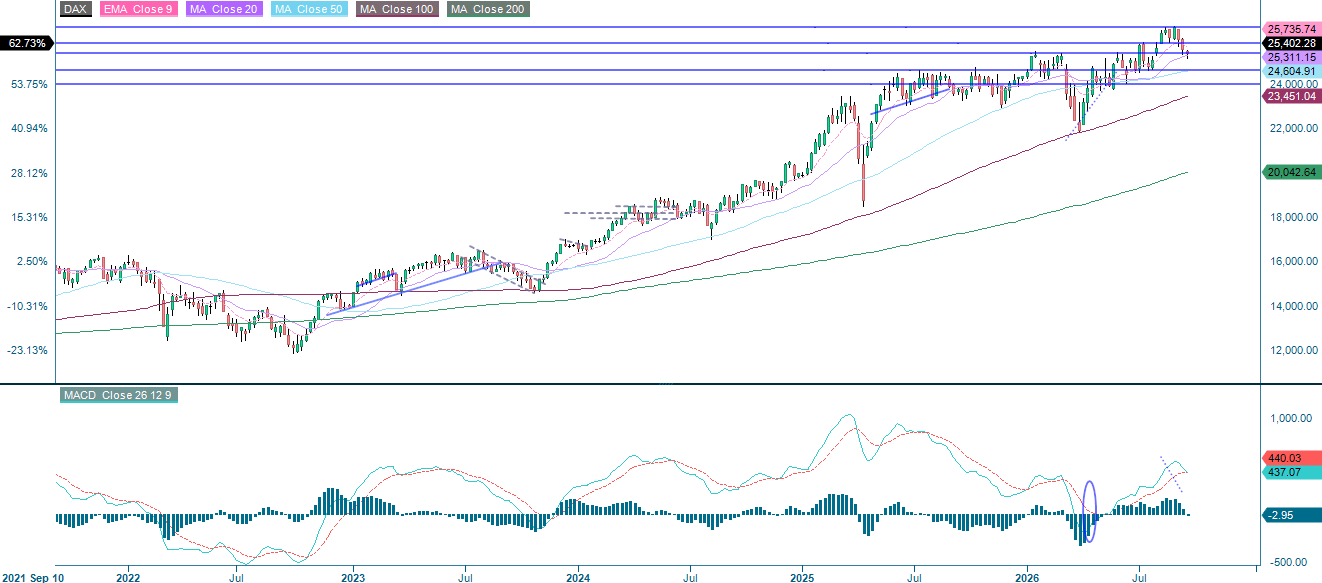
During yesterday’s trading, the German DAX tested the MA100, which is still serving as the first level of support. If this level is broken, the next target may be the 25,000 level.
Related Products
DAX (in EUR), one-year daily chart

DAX (in EUR), five-year weekly chart
The full name for abbreviations used in the previous text:
EMA 9: 9-day exponential moving average
Fibonacci: There are several Fibonacci lines used in technical analysis. Fibonacci numbers are a sequence in which each successive number is the sum of the two previous numbers.
MA20: 20-day moving average
MA50: 50-day moving average
MA100: 100-day moving average
MA200: 200-day moving average
MACD: Moving average convergence divergence
Risks
Credit risk of the issuer:
Investors in the products are exposed to the risk that the Issuer or the Guarantor may not be able to meet its obligations under the products. A total loss of the invested capital is possible. The products are not subject to any deposit protection.
Currency risk:
If the product currency differs from the currency of the underlying asset, the value of a product will also depend on the exchange rate between the respective currencies. As a result, the value of a product can fluctuate significantly.
Market risk:
The value of the products can fall significantly below the purchase price due to changes in market factors, especially if the value of the underlying asset falls. The products are not capital-protected
Product costs:
Product and possible financing costs reduce the value of the products.
Risk with leverage products:
Due to the leverage effect, there is an increased risk of loss (risk of total loss) with leverage products, e.g. Bull & Bear Certificates, Warrants and Mini Futures.
External author:
This information is in the sole responsibility of the guest author and does not necessarily represent the opinion of Bank Vontobel Europe AG or any other company of the Vontobel Group. This information is sponsored by Bank Vontobel Europe AG, which may be a counterparty to transactions involving the financial instruments discussed in this information. The further development of the index or a company as well as its share price depends on a large number of company-, group- and sector-specific as well as economic factors. When forming his investment decision, each investor must take into account the risk of price losses. Please note that investing in these products will not generate ongoing income.
The products are not capital protected, in the worst case a total loss of the invested capital is possible. In the event of insolvency of the issuer and the guarantor, the investor bears the risk of a total loss of his investment. In any case, investors should note that past performance and/or analysts' opinions are no adequate indicator of future performance. The performance of the underlyings depends on a variety of economic, entrepreneurial and political factors that should be taken into account in the formation of a market expectation.
Disclaimer:
This information is neither an investment advice nor an investment or investment strategy recommendation, but advertisement. The complete information on the products (securities) mentioned herein, in particular the structure and risks associated with an investment, are described in the base prospectus, together with any supplements, as well as the final terms relating to the securities. The base prospectus and final terms constitute the solely binding sales documents for the products mentioned herein. It is recommended that potential investors read these documents before making any investment decision. The documents and the key information document are published on the website of the issuer, Vontobel Financial Products GmbH, Bockenheimer Landstrasse 24, 60323 Frankfurt am Main, Germany, on https://prospectus.vontobel.com and are available from the issuer free of charge. The approval of the prospectus should not be understood as an endorsement of the securities. The securities are products that are not simple and may be difficult to understand. This information includes or relates to figures of past performance. Past performance is not a reliable indicator of future performance. This information may only be distributed or published in countries where such distribution or publication is permitted by applicable law. As stated in the relevant base prospectus, the distribution of the securities mentioned in this information is subject to restrictions in certain jurisdictions. This advertisement may not be reproduced or redistributed without prior permission by Vontobel.
© Bank Vontobel Europe AG and / or affiliated companies. All rights reserved.